
Market Overview
| Study Period | 2020 - 2031 |
|---|---|
| Forecast Data Period | 2026 - 2031 |
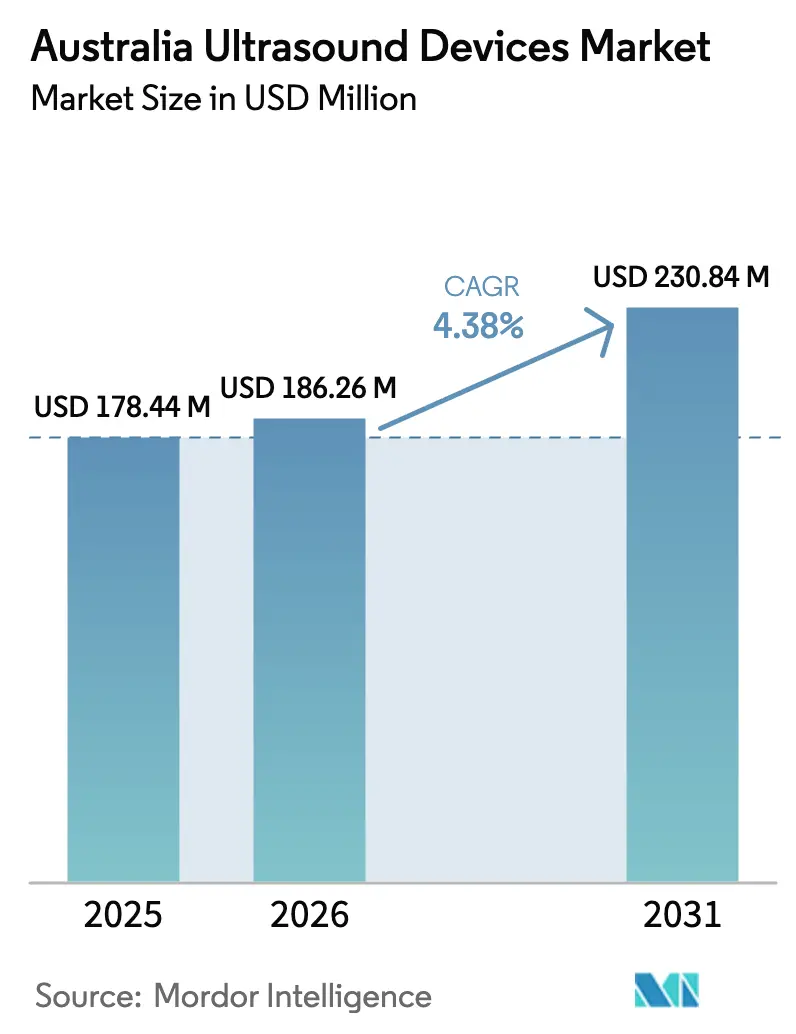
| Base Year Market Size (2025) | USD 178.44 Million |
| Market Size (2026) | USD 186.26 Million |
| Market Size (2031) | USD 230.84 Million |
| Growth Rate (2026 - 2031) | 4.38 % |
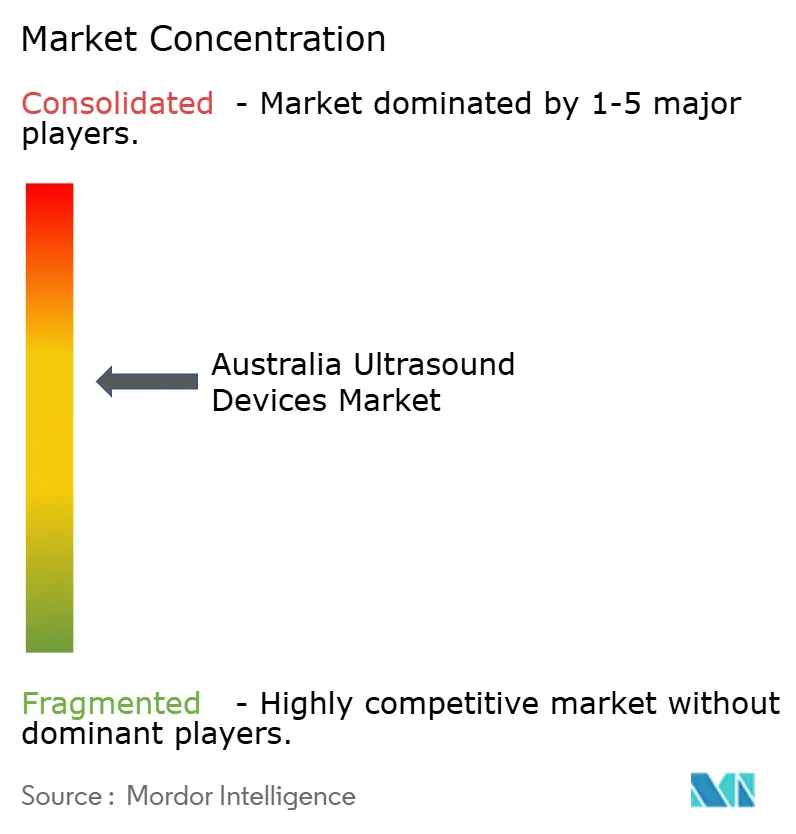
| Market Concentration | Medium |
Major Players *Disclaimer: Major Players sorted in no particular order Image © Mordor Intelligence. Reuse requires attribution under CC BY 4.0. | |
Australia Ultrasound Devices Market Analysis by Mordor Intelligence
Australia Ultrasound Devices Market size in 2026 is estimated at USD 186.26 million, growing from 2025 value of USD 178.44 million with 2031 projections showing USD 230.84 million, growing at 4.38% CAGR over 2026-2031.
Demand benefits from sustained public-sector capital expenditure, rising chronic-disease prevalence, and steady technological migration toward 3D, 4D, and AI-enabled imaging. Expansion of private obstetric clinics in second-tier cities, coupled with growing point-of-care ultrasound (POCUS) adoption in ambulances and primary care, underpins incremental unit sales. The Australia ultrasound devices market also gains from a supportive regulatory environment after the Therapeutic Goods Administration (TGA) streamlined audits for low-risk equipment in 2024, easing time-to-market for global manufacturers. Structural headwinds remain: a nationwide deficit of more than 3,000 accredited sonographers, 80% import dependence on hardware, and capital budget constraints in public hospitals restrain faster uptake.
Key Report Takeaways
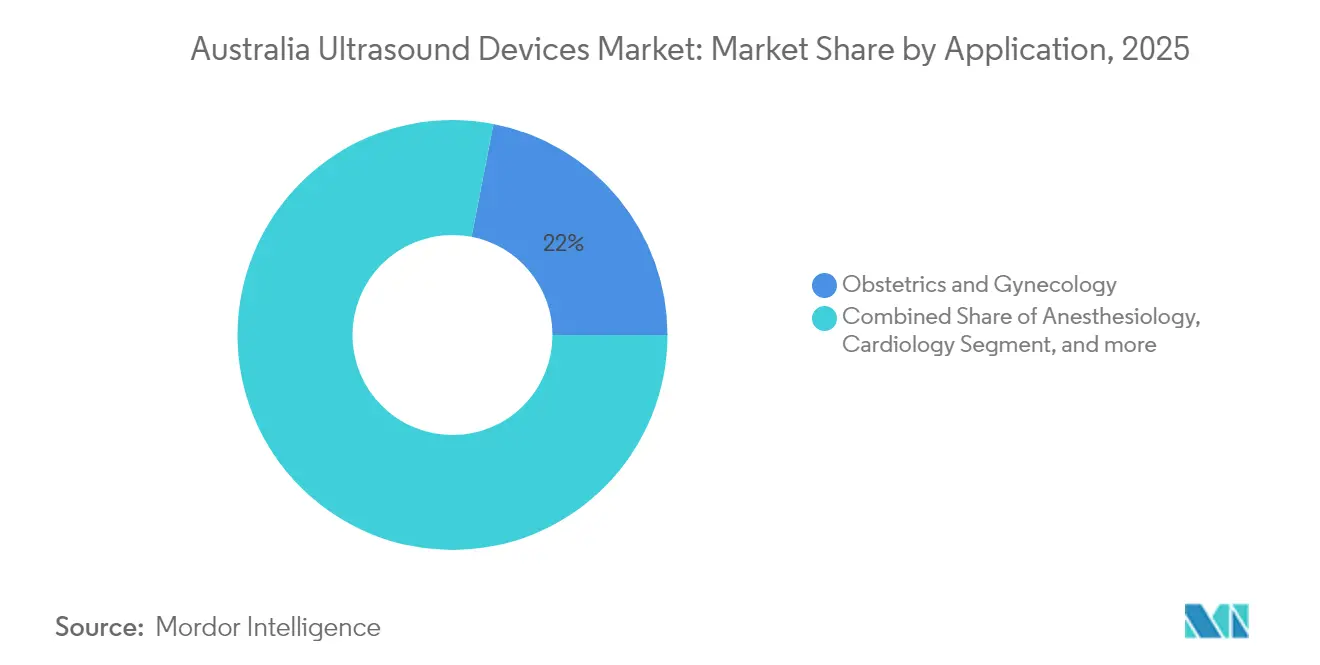
- By application, obstetrics and gynecology led with a 21.95% share of the Australia ultrasound devices market in 2025, while anesthesiology recorded the highest projected CAGR at 5.69% through 2031.
- By technology, 3D and 4D systems accounted for 42.98% of the Australia ultrasound devices market size in 2025; high-intensity focused ultrasound (HIFU) is forecast to expand at a 5.19% CAGR to 2031.
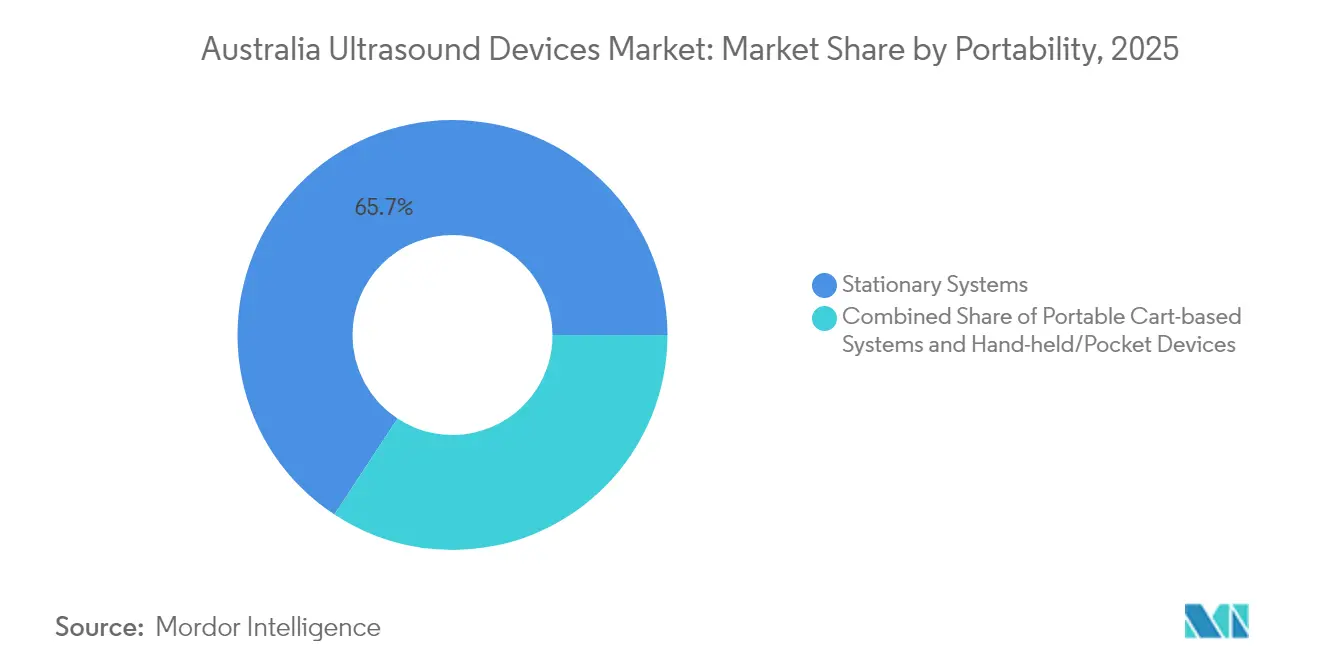
- By portability, stationary platforms held 65.74% of the Australia ultrasound devices market share in 2025, yet handheld units are advancing at a 7.01% CAGR over the same period.
- By end user, public hospitals commanded 38.85% revenue share in 2025; private hospitals are projected to grow at 6.49% CAGR through 2031.
Note: Market size and forecast figures in this report are generated using Mordor Intelligence’s proprietary estimation framework, updated with the latest available data and insights as of 2026.
Australia Ultrasound Devices Market Trends and Insights
Drivers Impact Analysis*
| Driver | (~) % Impact on CAGR Forecast | Geographic Relevance | Impact Timeline |
|---|---|---|---|
| Burden of Chronic & Lifestyle Diseases | +0.8% | National, with higher impact in urban centers | Long term (≥ 4 years) |
| Rapid Adoption of POCUS in Primary Care & Ambulances | +0.7% | National, with emphasis on rural and remote areas | Medium term (2-4 years) |
| Miniaturisation & AI-Assisted Imaging Workflow | +0.6% | National, with early adoption in major hospitals | Medium term (2-4 years) |
| Government "Buying Australian Made" Procurement Push | +0.4% | National, with focus on public sector procurement | Long term (≥ 4 years) |
| Private Obstetric Clinics Expansion in Tier-2 Cities | +0.3% | Regional centers and tier-2 cities | Medium term (2-4 years) |
| Defence & Remote-Medicine Projects in Northern Territory | +0.2% | Northern Territory and remote regions | Long term (≥ 4 years) |
| Source: Mordor Intelligence | |||
Burden of Chronic & Lifestyle Diseases
Chronic cardiovascular, musculoskeletal, and oncologic conditions are increasing alongside an aging population, heightening ultrasound demand in every state. AI-enhanced workflows now shorten scan-to-report times, crucial where sonographer shortages delay appointments. Mobile systems further support community screenings, reducing the need to refer patients for costly CT or MRI. As over-65 citizens are projected to rise 60% by 2030, scalable diagnostic capacity becomes a policy imperative. Vendors that bundle preventative-care training with equipment sales benefit from this demographic burden.
Rapid Adoption of POCUS in Primary Care & Ambulances
Point-of-care ultrasound is migrating from emergency departments to general practice. Rural clinicians who completed structured courses reported a 22% knowledge gain and 62% clinical utilisation within six months. The Northern Territory’s tele-sonography initiative links paramedics with hospital specialists via live video, proving lifesaving in obstetric emergencies. Despite clear utility, diffusion is tempered by practice cultures that prefer specialist referral and by reimbursement rules that still mandate on-site supervision for Medicare rebates.[1]Evidence-generation studies underway aim to clarify billing pathways and further legitimise POCUS in primary settings.
Miniaturization & AI-Assisted Imaging Workflow
Silicon-based micro-electro-mechanical (MEMS) transducers now enable a single handheld probe to cover multiple frequencies, shrinking hardware footprints while maintaining image fidelity.[2]Algorithms automate beam-forming and anatomical measurements so entry-level users can capture diagnostic-quality scans, directly addressing Australia’s workforce shortfall. GE Healthcare teamed with NVIDIA in 2025 to virtualise probe training, accelerating AI deployment without on-patient experimentation. Sports-medicine clinics already rely on augmented guidance to visualise tendon injuries, signalling that AI lowers skill barriers beyond hospital walls.
Government “Buying Australian Made” Procurement Push
Canberra’s Future Made in Australia Act encourages public buyers to award contracts that deliver domestic economic value. The Australian Medtech Manufacturing Centre committed USD 20 million to bolster local device production capacity, with ultrasound components listed among priority categories. Import dependence still covers 80% of ultrasound hardware, making immediate reshoring unrealistic. Yet vendors that assemble or service units locally secure preferential scoring in public tenders, as seen when Victorian hospitals shortlisted suppliers demonstrating local content compliance. Over time, these criteria could redistribute market share toward partnerships that embed manufacturing or R&D functions in Australia.
Restraints Impact Analysis*
| Restraint | (~) % Impact on CAGR Forecast | Geographic Relevance | Impact Timeline |
|---|---|---|---|
| Reimbursement Uncertainty for Handheld Scans | -0.5% | National, with higher impact on private practice adoption | Short term (≤ 2 years) |
| Sonographer Workforce Shortages | -0.8% | National, with acute impact in rural areas | Long term (≥ 4 years) |
| Import-Dependency Driven Price Volatility | -0.4% | National, affecting all market segments | Medium term (2-4 years) |
| Slow Capital-Budget Cycles in Public Hospitals | -0.3% | State-level variations, with NSW and Victoria leading | Long term (≥ 4 years) |
| Source: Mordor Intelligence | |||
Reimbursement Uncertainty for Handheld Scans
Medicare note IN.0.13 requires specialist supervision for many ultrasound rebates, leaving handheld POCUS scans by general practitioners unfunded outside hospital walls. This limits private adoption even where clinical benefit is proven. Private insurers have not yet standardised handheld coverage, instead approving claims case-by-case. Upcoming Health Technology Assessment reforms promise conditional funding pathways, but evidence dossiers and price-volume agreements will take time to assemble. For rural GPs, the absence of clear billing codes remains the chief obstacle to investment.
Sonographer Workforce Shortages
Just 7,780 accredited sonographers were practicing nationwide in 2023, leaving an estimated 3,000-person gap that lengthens appointment wait times and inflates salaries.[3] Only 25% of practitioners work under formal regulation, complicating quality assurance and inter-state mobility. Clinical-placement shortages hinder student throughput, especially in private clinics where supervision depresses productivity. The cascading effect pushes some providers toward CT or MRI referrals, raising system costs. AI-driven automation may ease strain, but credentialing bodies still require human oversight for final reports.
*Our forecasts treat driver/restraint impacts as directional, not additive. The impact forecasts reflect baseline growth, mix effects, and variable interactions.
Segment Analysis
By Application: Obstetrics Maintains Dominance while Anesthesiology Surges
Obstetrics and gynecology retained a 21.95% share of the Australia ultrasound devices market in 2025, reflecting universal antenatal screening guidelines and the popularity of 3D fetal imaging packages in private clinics. The segment continues to generate steady unit sales as expectant parents opt for elective 4D keepsake scans that require advanced transducers. Rising maternal age also drives high-risk screenings, favoring cart-based systems with sophisticated workflow modules.
Anesthesiology is forecast to expand at a 5.69% CAGR, the fastest among clinical uses, as regional-block techniques increasingly rely on ultrasound guidance for safety. Emergency departments and day-surgery centers are retrofitting procedure rooms with portable systems capable of vascular access, nerve mapping, and post-operative lung checks. The Australia ultrasound devices market size for anesthesiology is therefore set to climb more quickly than radiology purchases, though overall revenue remains smaller in absolute terms.

By Technology: 3D Leadership Faces HIFU Innovation
Three-dimensional and four-dimensional imaging captured 42.98% of the Australia ultrasound devices market size in 2025, benefiting from obstetric and cardiology demand for volumetric assessment and post-processing analytics. Vendors differentiate through ergonomic probe designs and real-time rendering, which shorten scan times.
High-intensity focused ultrasound commands just a niche share today but shows 5.19% CAGR potential thanks to non-invasive tumor ablation for uterine fibroids and prostate applications. Hospitals trialling HIFU note shorter patient recovery times versus surgery, indicating broader adoption once capital budgets align. Traditional 2D diagnostic systems will persist in rural settings because of low cost, but advanced modalities appear poised to capture incremental spend.
By Portability: Stationary Platforms Hold Ground while Handheld Devices Disrupt
Stationary consoles accounted for 65.74% of the Australia ultrasound devices market share in 2025, anchored by radiology and cardiology departments that need premium image quality for complex cases. Five-year replacement cycles and bundled service contracts help vendors secure recurring revenue.
Handheld probes, however, show a rapid 7.01% CAGR as clinicians seek bedside diagnostics and telemedicine integration. Device makers that couple hardware with subscription-based cloud storage report faster penetration in general practice where IT budgets are lean. The continuum of portability therefore grows stratified: high-end carts for tertiary centers, mid-range mobiles for regional hospitals, and pocket devices for field use.
By End User: Public Hospital Scale Meets Private-Hospital Agility
Public hospitals captured 38.85% of expenditure by virtue of their role in trauma, obstetrics, and oncology pathways. Multi-modality procurement frameworks boost negotiation leverage, yet tender scope favors full-line manufacturers that supply service and training.
Private hospitals grew at 6.49% CAGR on pent-up elective procedures and investments in same-day surgery. While the segment remains smaller than the public block, its faster pace offers suppliers attractive upsell opportunities. Specialist clinics and physiotherapy centers also scale purchases of lightweight devices, encouraged by financing schemes that spread costs over usage-based periods.
Geography Analysis
Metropolitan states dominate volume, with New South Wales, Victoria, and Queensland accounting for more than 70% of installed capacity. Sydney’s integrated e-Health record platform drives centralized imaging archives that favor console replacements aligned with network upgrades. Melbourne hospitals leverage state-led procurement panels, compressing vendor shortlists but guaranteeing order visibility over multi-year spans.
Regional markets reveal contrasting patterns. The Northern Territory Tele-Sonography program pioneered live cardiac scanning across 500 km distances, proving demand for robust portable units in remote indigenous communities. Western Australia pilots similar models where fly-in clinicians operate battery-powered probes during outreach camps. Tasmania and the Australian Capital Territory add smaller but technology-savvy pockets. Hobart’s Royal Hospital upgraded to AI-enabled cart systems in 2024 to address staffing gaps. Canberra focuses on defence-aligned trauma research, integrating ultrasound with rapid-response protocols. Geography therefore shapes both specification and service models, demanding versatile supplier portfolios.
Regulatory Landscape
Ultrasound systems supplied in Australia are regulated by the Therapeutic Goods Administration (TGA) under the Therapeutic Goods (Medical Devices) Regulations 2002, and must be included on the Australian Register of Therapeutic Goods (ARTG) before supply. Diagnostic ultrasound platforms are generally treated as active medical devices (commonly Class IIa) and must demonstrate compliance with the Essential Principles (Schedule 1), including risk management and safety for energy-emitting devices.
Market access typically runs through a sponsor responsible for ARTG inclusion, conformity assessment evidence, and ongoing post-market obligations. The Australian Regulatory Guidelines for Medical Devices (ARGMD) set expectations for evidence, labeling, vigilance reporting, and traceability, which becomes more material as software-enabled features (including AI workflow tools) expand and require additional documentation and lifecycle controls.
Competitive Landscape
Global multinationals continue to shape the Australia ultrasound devices market through local subsidiaries and distributor alliances. GE Healthcare retains leadership leveraging a broad cardiac and women’s health portfolio. Philips and Siemens Healthineers hold significant shares but have ceded ground in portable systems to Chinese entrants and U.S. startups.
AI capability is the new battleground. GE’s 2025 collaboration with NVIDIA targets autonomous image acquisition workflows, a direct answer to the sonographer deficit. Butterfly Network and Exo Imaging capitalize on smartphone connectivity to undercut cart pricing while offering cloud-based quality assurance. Compliance with TGA’s post-market vigilance rules acts as a barrier for smaller importers, thus sustaining moderate market concentration even as product variety widens.
Price pressures surface due to currency volatility. Vendors offering part-assembly or probe repair within Australia mitigate exchange-rate risk and appeal to procurement rules favoring local content. Service breadth now differentiates suppliers as much as pixel count or scan depth, especially in regional tenders that bundle devices with tele-education.
Australia Ultrasound Devices Industry Leaders
-
GE Healthcare
-
Siemens Healthineers AG
-
Fujifilm Holdings Corporation
-
Koninklijke Philips N.V.
-
Mindray Medical
- *Disclaimer: Major Players sorted in no particular order
Market Opportunities and Future Outlook
Near-term whitespace in Australia centers on expanding point-of-care ultrasound (POCUS) beyond emergency departments into general practice, ambulance services, and remote care models. In these settings, portability and simplified workflows help reduce reliance on scarce sonography capacity. The Northern Territory tele-sonography initiative highlighted in the report context (linking paramedics with hospital specialists via live video) points to continued demand for rugged, connected devices, alongside vendor-provided training, protocol libraries, and quality assurance services that can function across long distances.
A second opportunity sits in localization and service footprint, given the report-context import dependence (about 80% of ultrasound hardware) and procurement emphasis on domestic economic value. Programs such as the Future Made in Australia Act and the Australian Medtech Manufacturing Centre commitment of USD 20 million create openings for suppliers that add Australian-based assembly, probe repair, cybersecurity support, and clinical application training. On commercialization, reimbursement pathways remain a gating factor for handheld scanning in private practice, so vendors that produce indication-specific evidence packages and support providers navigating Medicare Benefits Schedule constraints can help accelerate adoption in primary care and specialist clinics despite funding uncertainty.
Recent Industry Developments
- June 2026: Echo IQ Limited announced a binding Heads of Agreement with Pro Medicus Limited for an up to A$20 million strategic investment and for Echo IQ to become a reseller of EchoSolv in the United States. The arrangement expands Echo IQ's US channel reach and accelerates adoption of its EchoSolv suite, while aligning Pro Medicus with an AI driven imaging ecosystem to enhance cross sell opportunities across radiology and cardiology units.
- November 2025: GE HealthCare completed the first Australian delivery of its Vivid Pioneer cardiovascular ultrasound system to Synergy Cardiology in Queensland. The milestone supports increased access to advanced cardiac imaging in the region and strengthens GE HealthCare's position in high value cardiovascular diagnostics in Australia.
- September 2025: GE HealthCare launched the Voluson Performance 18 and 16 ultrasound systems for women's health applications. The introduction broadens GE HealthCare's portfolio for obstetric and gynecologic imaging, enabling facilities to upgrade capabilities and improve patient care with advanced 3D and 4D imaging features.
Research Methodology Framework and Report Scope
Market Definition and Coverage
For this methodology, the market covers revenue generated from ultrasound imaging devices sold and installed in Australia, including complete systems and their core configurations used for clinical diagnosis and guided procedures.
Scope exclusions: We exclude ultrasound procedure revenue, scanning fees, extended service contracts, and other diagnostic imaging modalities such as CT, MRI, and X-ray.
Segmentation Overview
- By Application
- Anesthesiology
- Cardiology
- Obstetrics & Gynecology
- Musculoskeletal
- Radiology
- Critical Care
- Urology
- Vascular
- Other Applications
- By Technology
- 2D Ultrasound Imaging
- 3D & 4D Ultrasound Imaging
- Doppler Imaging
- High-Intensity Focused Ultrasound
- Other Technologies
- By Portability
- Stationary Systems
- Portable Cart-based Systems
- Hand-held / Pocket Devices
- By End User
- Public Hospitals
- Private Hospitals
- Specialist Clinics
- Other End Users
Data Sources, Market Sizing, and Validation
Desk Research
We first mapped the addressable demand by combining Australia health system capacity signals with device usage patterns, and then matching that view with import and supply cues where available. Public sources that helped anchor the model include Australian Institute of Health and Welfare publications, Department of Health and Aged Care and Medicare Benefits Schedule statistics, Australian Bureau of Statistics releases, Therapeutic Goods Administration guidance and registries, and peer reviewed radiology and sonography literature.
On the supply side, annual reports, investor presentations, and tender disclosures were reviewed to understand product mix shifts, pricing direction, and replacement cycles in hospitals and imaging centers. Where it added clarity, we also used a paid subscription for company financials and news, and a patent database to track feature progress that can influence average selling prices. These desk research sources are illustrative, and many other public documents and references were also used to collect data, validate it, and clarify assumptions.
Primary Interviews and Surveys
To close gaps that desk research does not fully answer, we ran expert interviews and structured surveys with stakeholders across public and private hospitals, imaging networks, distributors, and clinical users who influence procurement. The goal of these conversations was to confirm replacement timing, how often portable units are adopted versus cart based systems, and how purchasing decisions are shifting across major states, including differences between metro and regional care settings.
Distribution of primary research fieldwork respondents
| Company type | Respondent position |
|---|---|
| Top tier: 26% | CXOs: 12% |
| Mid tier: 60% | Functional/Unit leaders: 38% |
| Smaller Players: 14% | Managers: 50% |
Market-Sizing & Forecasting
Sizing starts with a top down rebuild of the installed base and annual demand pool, where procedure volumes and care activity are translated into likely scanner capacity needs and refresh requirements. That output is then checked against selective bottom up approximations, mainly sample price by unit shipments through key channels, and sanity checks against typical replacement and expansion buying in major care sites.
Inputs that shaped the model include public versus private purchasing mix, the share of portable systems used in emergency and bedside workflows, application pull from OB-GYN and cardiology caseloads, technology migration from 2D toward 3D and 4D in selected settings, and typical replacement cycles tied to uptime, service availability, and budget windows. When unit information was incomplete, we handled the gap using proxy ratios from comparable care settings, then adjusted after channel discussions. Forecasts were built using scenario analysis supported by expert views on health spending direction, staffing constraints for sonographers, and the pace of point of care adoption, which were then converted into value using price progression assumptions.
Data Validation & Update Cycle
We validate each step by comparing the model against independent signals such as Medicare funded ultrasound utilization trends, hospital activity indicators, and procurement patterns discussed by industry participants. Outliers are reviewed, assumptions are rechecked, and follow up calls are triggered when a variance cannot be explained by scope or timing differences.
Before sign off, a second analyst reviews the calculations and the reasonableness of key inputs, and then the narrative is aligned to the final numbers. Reports are refreshed annually, with interim updates when major policy, reimbursement, trade, or technology events materially change demand. Right before delivery, we complete a final pass so clients receive the latest updated view.
Mordor Intelligence's Australia Ultrasound Devices Market Size Compared Against Other Published Estimates
Published market values for ultrasound devices in Australia can differ because each publisher uses its own scope choices, base year timing, and mix of device types and end users. Differences also show up when some estimates lean on shipment assumptions without reconciling them to the installed base and replacement behavior.
In this study, the bigger gap drivers are usually whether point of care systems are counted as part of the same device pool, whether refurbished sales are included, and how price changes are handled when higher end systems gain share. Currency conversion timing and the refresh cadence also matter, especially in years when hospital capex cycles or supply conditions shift, which can push year specific values up or down.
Benchmark comparison
| Source | Market Size | Gaps in Research Methodology |
|---|---|---|
| Mordor Intelligence | USD 178.44 M (2025) | |
| Industry Data Publisher A | USD 202.00 M (2022) | Uses an earlier base year and a faster growth path, and the scope appears to be broader on product coverage, which can pull in adjacent therapeutic or non core device revenue in some interpretations. |
| Newswire Summary B | USD 358.70 M (2024) | Covers Australia and New Zealand together and is presented as a headline figure without clear validation against Australian demand signals, so the combined geography and limited scope notes can inflate the Australia only value. |
The spread in values is mainly explained by geography coverage, year alignment, and what gets counted as a device sale versus adjacent revenue, and those differences are kept under control by tying the estimate to installed base logic and replacement driven demand, a modeling choice applied by Mordor Intelligence.
Key Questions Answered in the Report
How large is the Australia ultrasound devices market in 2026?
The Australia ultrasound devices market size is USD 186.26 million in 2026.
What CAGR is expected for ultrasound devices in Australia through 2031?
The market is projected to grow at a 4.38% CAGR between 2026 and 2031.
Which application segment leads the country’s ultrasound demand?
Obstetrics and gynecology leads with a 21.95% revenue share in 2025.
How fast are handheld ultrasound devices growing?
Handheld units are advancing at a 7.01% CAGR, the fastest among portability categories.
What is the main barrier to faster ultrasound adoption in rural Australia?
A shortage of accredited sonographers and unclear handheld reimbursement pathways slow adoption.
Which technology is gaining momentum beyond diagnostics?
High-intensity focused ultrasound is expanding at 5.19% CAGR for therapeutic uses such as fibroid ablation.