
Market Overview
| Study Period | 2020 - 2031 |
|---|---|
| Forecast Data Period | 2026 - 2031 |
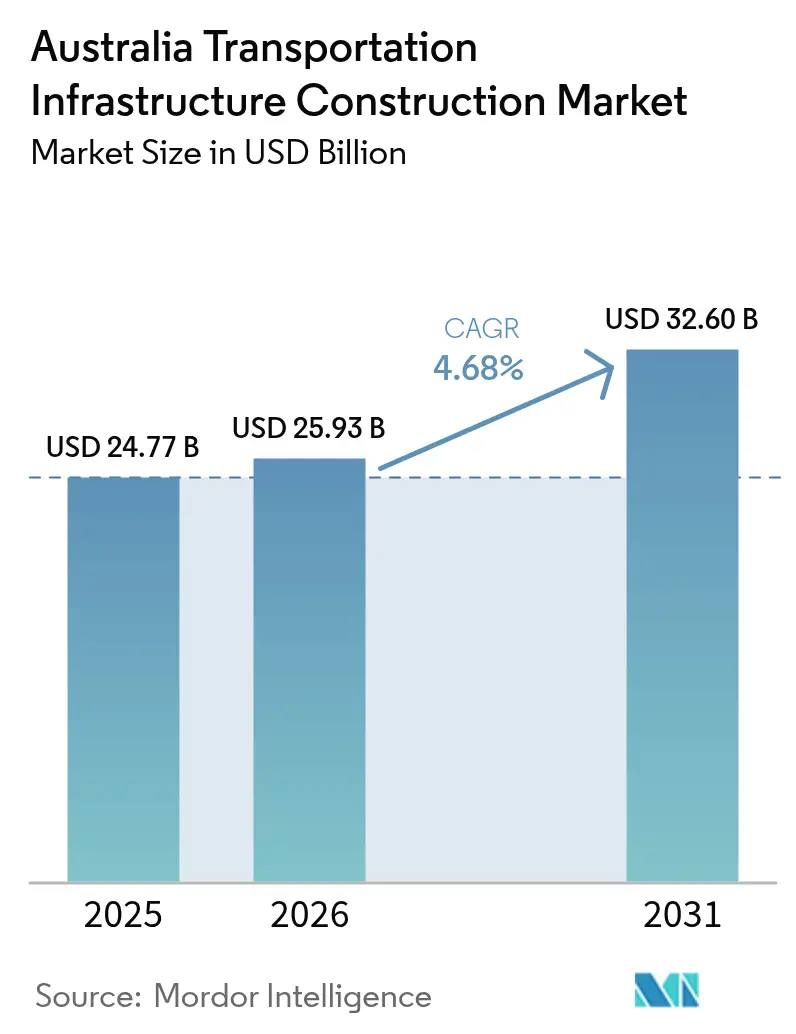
| Base Year Market Size (2025) | USD 24.77 Billion |
| Market Size (2026) | USD 25.93 Billion |
| Market Size (2031) | USD 32.6 Billion |
| Growth Rate (2026 - 2031) | 4.68% CAGR |
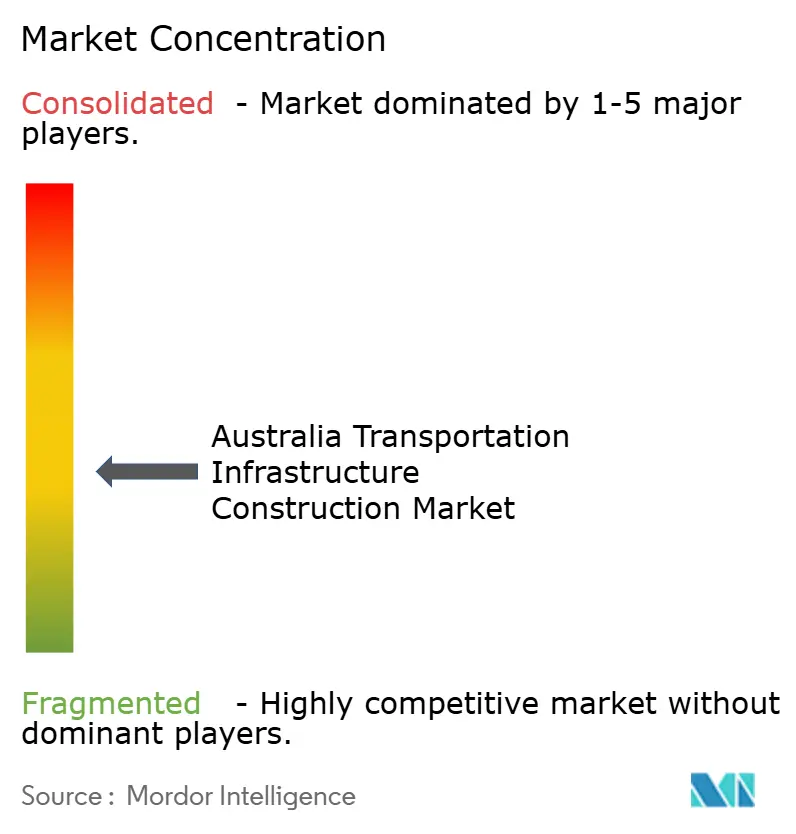
| Market Concentration | Medium |
Major Players
*Disclaimer: Major Players sorted in no particular order Image © Mordor Intelligence. Reuse requires attribution under CC BY 4.0. |
|
Australia Transportation Infrastructure Construction Market Analysis by Mordor Intelligence
The Australia Transportation Infrastructure Construction Market size in 2026 is estimated at USD 25.93 billion, growing from 2025 value of USD 24.77 billion with 2031 projections showing USD 32.6 billion, growing at 4.68% CAGR over 2026-2031.
Government budget certainty, intermodal freight integration, decarbonization imperatives, and defense-driven northern upgrades collectively underpin this steady expansion.[1]Australian Government, "Infrastructure Investment Program 2025-26," Department of Infrastructure, Transport, Regional Development, Communications and the Arts, infrastructure.gov.au Rail electrification programs, higher-capacity port interfaces, and the adoption of digital twins continue to attract capital, even as labor shortages push wage agreements to record levels. Private investors accelerate their participation through sophisticated public-private partnership structures that mitigate construction risk while expanding long-term yield opportunities. At the same time, megaproject cost management and insurance premiums for climate-exposed assets remain material constraints, prompting stronger governance frameworks and expanded contingency allowances across new and renovation projects.
Key Report Takeaways
- By type, roadways led with 51.05% revenue share in 2025; railways are projected to expand at a 5.43% CAGR through 2031.
- By construction type, new construction held a 64.12% share in 2025, while renovation is advancing at a 5.18% CAGR to 2031.
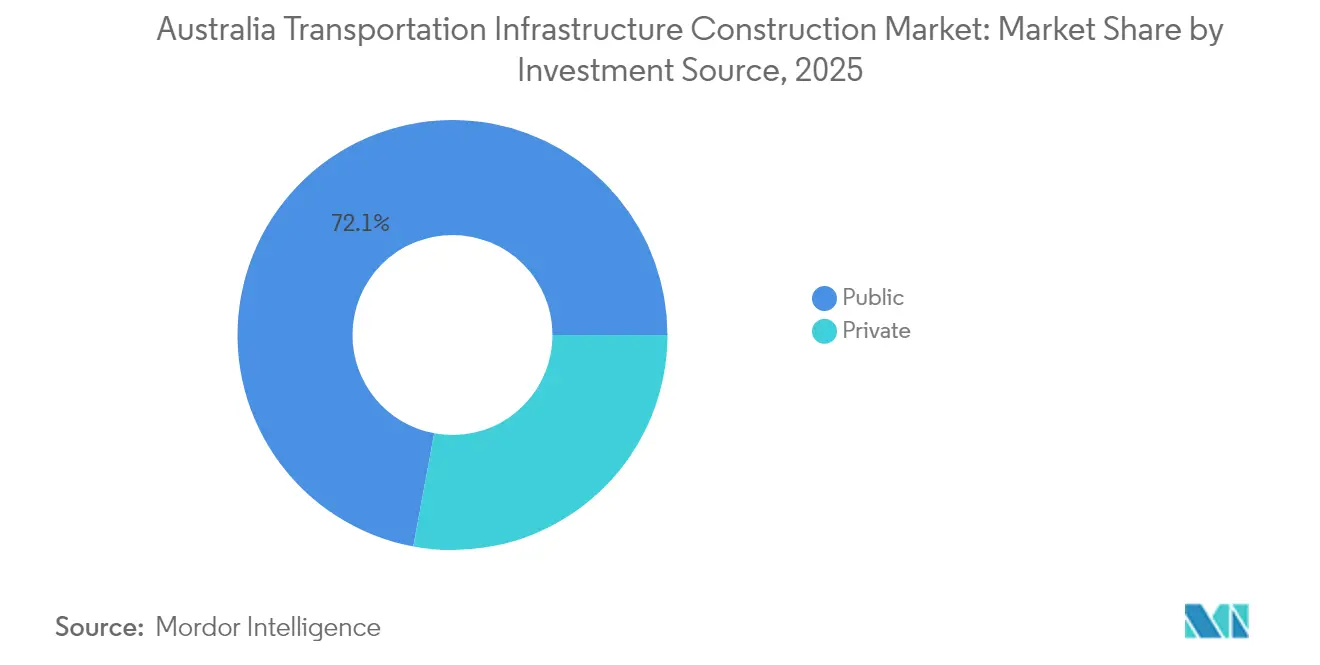
- By investment source, public funding accounted for 72.08% of the Australian transportation infrastructure construction market share in 2025, whereas private investment is predicted to expand at a 5.78% CAGR through 2031.
- By geography, New South Wales led with 29.45% revenue share in 2025; Queensland is forecast to grow at a 5.94% CAGR between 2026 and 2031.
Note: Market size and forecast figures in this report are generated using Mordor Intelligence’s proprietary estimation framework, updated with the latest available data and insights as of 2026.
Australia Transportation Infrastructure Construction Market Trends and Insights
Drivers Impact Analysis*
| Driver | % Impact on CAGR Forecast | Geographic Relevance | Impact Timeline |
|---|---|---|---|
| Robust Federal & State Budget Allocations | +1.2% | National, with a concentration in NSW and Queensland | Medium term (2-4 years) |
| Fast-tracking of Inland Rail and Western Sydney projects | +0.8% | NSW, Queensland, Victoria corridors | Long term (≥ 4 years) |
| Surge in inter-modal freight demand | +0.6% | National freight corridors, port connectivity zones | Medium term (2-4 years) |
| Decarbonisation mandates driving rail electrification | +0.5% | Urban centers and interstate corridors | Long term (≥ 4 years) |
| Digital twins & BIM mandates improving cost certainty | +0.4% | Major metropolitan projects, government contracts | Medium term (2-4 years) |
| Defence-led northern road upgrades (DAR Initiative) | +0.3% | Northern Territory, Far North Queensland | Short term (≤ 2 years) |
| Source: Mordor Intelligence | |||
Robust Federal & State Budget Allocations Drive Infrastructure Pipeline Acceleration
Federal and state allocations of USD 17.1 billion for road and rail in the 2025-26 cycle anchor a USD 120 billion rolling pipeline that shifts spending toward proactive capacity creation[2]Infrastructure Australia, “Market Capacity Report 2024,” Infrastructure Australia, infrastructureaustralia.gov.au. Western Australia’s METRONET uses a USD 6 billion four-year commitment to synchronize rail, road, and station precinct upgrades. Queensland’s Transport and Roads Investment Program applies a similar whole-of-network philosophy, coordinating federal Infrastructure Investment Program funds with state delivery mechanisms. Tier-1 contractors’ share of awarded work rose to 59% in 2025 as governments bundled large, complex packages that favor companies capable of digital design integration and full-life asset management.
Fast-tracking of Inland Rail and Western Sydney Projects Creates Integrated Transport Corridors
The Inland Rail’s 1,700-kilometer freight spine and the Sydney Metro Western Sydney Airport line exemplify corridor-level planning that merges rail, road, and airport interfaces. Inland Rail seeks to shift significant freight from truck to rail and cut transit times under 24 hours while supporting decarbonization goals. The Western Sydney program layers a USD 5.25 billion rail package with USD 2.3 billion in complementary road works to serve a future 2 million-resident catchment. Early delivery of Perth’s Forrestfield-Airport Link demonstrates the economic multiplier effect of such integrated models.
Surge in Inter-modal Freight Demand Reshapes Infrastructure Investment Priorities
Domestic freight volumes are projected to rise 26% from 2020 to 2050, with road freight up 77% and rail freight up 5.7%, compelling investment in integrated terminals and port linkages. The Moorebank Logistics Park and the Port of Brisbane’s USD 3.5 billion channel upgrade highlight how combined rail-road-port interfaces reduce landside congestion and boost freight efficiency. Cruise-enabled wharf enhancements such as Brisbane’s Luggage Point terminal reinforce the trend toward multi-use port precincts.
Decarbonization Mandates Accelerate Rail Electrification and Clean Transport Infrastructure
Transport contributes 21% of national greenhouse emissions; a net-zero target for 2050 positions electrified rail, EV charging corridors, and hydrogen distribution assets as construction priorities[3]Department of Climate Change, Energy, the Environment and Water, “Rewiring the Nation Program Overview,” DCCEEW, dcceew.gov.au. Aurizon’s USD 50 million Future Fleet Fund supports battery and hydrogen locomotive pilots. The Rewiring the Nation program allocates USD 20 billion for transmission lines vital to rail electrification and EV charger rollout, though community opposition to new corridors presents schedule risk.
Restraints Impact Analysis*
| Restraint | % Impact on CAGR Forecast | Geographic Relevance | Impact Timeline |
|---|---|---|---|
| Skilled-labour shortage & wage inflation | -1.1% | National, acute in NSW and Victoria | Short term (≤ 2 years) |
| Cost blow-outs in megaproject tunnelling | -0.7% | Major metropolitan areas with tunnelling projects | Medium term (2-4 years) |
| Community opposition to green-field corridor acquisition | -0.4% | Rural and peri-urban areas, transmission corridors | Medium term (2-4 years) |
| Rising insurance premiums for climate-exposed assets | -0.3% | Northern Australia, coastal infrastructure zones | Long term (≥ 4 years) |
| Source: Mordor Intelligence | |||
Skilled-Labour Shortage and Wage Inflation Constrain Project Delivery Capacity
Infrastructure build-out needs an extra 90,000 workers, yet construction trades face an aging workforce, limited migration inflows, and competing demand from the housing sector[4]Department of Employment and Workplace Relations, “National Skills Priority List 2025,” DEWR, dewr.gov.au. Three-year union agreements in NSW lift wages 26%, pushing base compensation for level-three trades to USD 237,000, while Queensland’s comparable deal raises hourly carpenter rates above AUD 65 by 2027. Government apprenticeship incentives and industry-linked training programs aim to address pipeline gaps but will support medium-term rather than immediate labor supply.
Cost Blow-outs in Megaproject Tunneling Threaten Investment Returns and Future Funding
Projects over USD 1 billion have averaged 30% overruns since 2001, adding USD 34 billion to taxpayer exposure. Sydney Metro’s City and Southwest line jumped from USD 11.5 billion to over USD 20 billion due to ground conditions and safety upgrades, while Metro West shows a similar escalation. Inland Rail costs followed a comparable trajectory from USD 4.4 billion to USD 31.4 billion, underscoring the need for stronger demand forecasting and stage-gated approvals.
*Our forecasts treat driver/restraint impacts as directional, not additive. The impact forecasts reflect baseline growth, mix effects, and variable interactions.
Segment Analysis
By Type: Railways Acceleration Challenges Roadways Dominance
Roadways generated more than half of 2025 revenue, yet railways display the strongest growth pulse at 5.43% CAGR. The Inland Rail program alone underpins a transition toward modal balance by targeting a doubling of Melbourne-Brisbane rail freight by 2050. Western Sydney Airport’s airfield and apron packages elevate requirements for high-capacity access roads and metro spurs, while port and inland waterway investment concentrates on deeper channels and quay upgrades to handle larger vessels. Digital design techniques and predictive maintenance embed cost control, positioning rail and port assets for sustained share gains within the Australian transportation infrastructure construction market.
The Australian transportation infrastructure construction market size for railways is projected to expand faster than roadways, thanks to emissions targets, integrated freight corridors, and a national rail manufacturing plan that raises local content thresholds. By contrast, the Australian transportation infrastructure construction industry’s roadway segment pursues asset safety and resilience upgrades rather than pure capacity expansion. Ports and inland waterways secure a niche by modernizing cruise and container infrastructure, and the airways segment sees steady spending tied to Western Sydney International Airport’s phased roll-out and parallel runway rehabilitation programs at major east-coast gateways.


By Construction Type: Renovation Gains Momentum Despite New Construction Leadership
New construction captured a 64.12% share in 2025 as governments favored headline projects such as Inland Rail and Sydney Metro over incremental upgrades. Renovation, however, posts a 5.18% CAGR through 2031 as asset managers prioritize safety barriers, flood resilience, and digital condition monitoring to stretch lifecycle performance. The Bruce Highway safety series exemplifies this shift, channeling USD 7.2 billion into lane widening, bridge strengthening, and intelligent transport systems.
Within the Australian transportation infrastructure construction market, renovation spending also escalates due to climate resilience requirements and the rise of performance-based maintenance contracts that bundle renewal works with operation. New construction remains essential for emerging growth corridors in Queensland and northern Australia, yet faces tighter cost scrutiny. The Australian transportation infrastructure construction market size for renovation assets thus narrows the gap with greenfield spending over the forecast horizon.
By Investment Source: Private Sector Momentum Challenges Public Dominance
Public entities contributed 72.08% of the 2025 value as the federal Infrastructure Investment Program and state budgets continued to dominate. Nevertheless, private capital accelerates at a 5.78% CAGR driven by pension funds and global builders pursuing inflation-linked returns. The Melbourne Metro Tunnel, North East Link, and Western Ridge Crusher illustrate a robust appetite for availability-based or demand-risk concession models that allocate geotechnical and interface risk between parties.
Hybrid funding models nurture depth in the Australian transportation infrastructure construction market by leveraging private delivery expertise while maintaining public policy oversight. The Australian transportation infrastructure construction market share of PPP transactions widens as governments cap direct balance-sheet exposure. Risk-sharing provisions around cost escalation and carbon abatement become standard clauses, enabling timelier financial close and construction mobilization despite persistent macro-volatility.
Geography Analysis
New South Wales holds 29.45% of the 2025 value thanks to the USD 63 billion Sydney Metro portfolio, port rail shuttles, and Western Sydney International Airport precinct alignment. Integrated planning between Transport for NSW and federal agencies streamlines approvals, yet cumulative cost overruns temper future funding flexibility. The state also trialed digital twins at Gadigal Station to improve asset commissioning and maintenance.
Queensland records the highest growth path at 5.94% CAGR through 2031, spurred by Bruce Highway upgrades, Olympic corridor preparations, and the Logan-Gold Coast Faster Rail program. The state deploys freight-oriented upgrades to boost supply-chain efficiency while investing in climate-resilient roads across cyclone-prone northern zones. Port of Brisbane’s channel deepening and rail-road interface packages further secure trade competitiveness.
Victoria focuses on metropolitan de-bottlenecking via the USD 15.8 billion North East Link and Suburban Rail Loop early works, while Western Australia emphasizes resource-sector connectivity under METRONET and the Pilbara haulage initiative. Northern Territory exploits defense investment through DAR corridors, and Tasmania leverages the Marinus underwater interconnector to support renewable export ambitions. Collectively, these projects embed regional specialization and underpin the Australian transportation infrastructure construction market’s diversified growth profile.
Regulatory Landscape
Australia's transport infrastructure project governance is anchored by the National Land Transport Act 2014 and the 2024-2029 Federation Funding Agreement Schedule on Land Transport Infrastructure Projects, which set eligibility and reporting expectations for federally supported road and rail works. Infrastructure Australia reinforces delivery discipline through its two-pass assessment approach and gateway assurance for significant proposals, while the Australian Government's Infrastructure Policy Statement (November 2023) frames investment alignment around productivity, resilience, liveability, and sustainability.
From 2025, the 2024-2029 FFAS also adds reporting expectations such as recycled content uptake on applicable projects, increasing compliance visibility across jurisdictions and major contractors. In 2026, a National Competition Policy review agenda has been used to support standard harmonisation, including recognition of international and trusted overseas standards, with the stated aim of reducing regulatory barriers and compliance costs across states while maintaining assurance requirements for major transport programs.
Value Chain Analysis
The value chain covers project origination (federal and state pipeline selection and business case development), planning and assurance (Infrastructure Australia assessments and jurisdictional approvals), financing and procurement (public funding dominance supported by PPPs and collaborative commercial models), and delivery through tier-1 contractors and specialist subcontractors for tunnelling, rail systems, marine works, and civil packages. Procurement settings increasingly embed Australian Industry Participation requirements for government-funded procurements and grants above AUD 20 million, and federal funding for road and rail projects from AUD 7.5 million includes Indigenous Participation Plan requirements, extending compliance and reporting into contractor and supplier tiers.
Upstream inputs include aggregates, asphalt, steel, precast, rail components, rolling stock interface works, plant and equipment, and professional services such as design, geotechnical, and digital engineering. Skilled labour availability and material lead times are the most visible constraints, shaping sequencing, packaging, and risk allocation, and supporting wider use of incentivised target cost, pain share/gain share, and early contractor involvement approaches. The rail and corridor pipeline, including Inland Rail packages and large metro programs, continues to influence demand for digital engineering, interoperability capability, and locally engaged supply networks under AIP and related participation frameworks.
Competitive Landscape
The market remains moderately fragmented, scoring 6 on a 10-point concentration scale, as the top five players command roughly 60% of aggregate value. Tier-1 contractors such as CPB Contractors, John Holland, and Lendlease Engineering consolidate shares by integrating design, delivery, and operations capabilities that satisfy government preferences for single-interface contracting. Webuild’s acquisition of Clough introduces additional tunneling and hydro expertise, aligning with sustainable mobility mandates.
Specialist firms excel in marine works, rail systems, and high-voltage transmission, enabling joint ventures that blend complementary scope and risk profiles. Digital twin technology and BIM proficiency become pivotal selection criteria, rewarding bidders able to deliver transparent cost forecasting and construction sequencing. Workforce development partnerships with vocational institutes mitigate labor shortfalls, while modular construction and automated tunneling machines help offset wage inflation.
Elevation of climate resilience and emissions reduction in tender assessments encourages contractors to retrofit equipment fleets with low-emission plant and to pilot hydrogen or renewable-diesel powered machinery. Insurance carriers’ tighter underwriting for flood and fire exposure heightens emphasis on adaptive design, opening advisory opportunities for engineering consultancies embedded within consortia. Overall, executives adopt balanced portfolios spanning high-profile megaprojects and smaller renovation frameworks to de-risk backlog volatility within the Australian transportation infrastructure construction market.
Australia Transportation Infrastructure Construction Industry Leaders
-
CPB Contractors
-
Lendlease
-
Hutchinson Builders
-
John Holland
-
Fulton Hogan
- *Disclaimer: Major Players sorted in no particular order

Market Opportunities and Future Outlook
Opportunities cluster around government-backed, high-value programs where funding and prioritisation are reaffirmed through national processes. Infrastructure Australia released its 2026 Infrastructure Priority List (68 high-priority proposals), emphasizing high-capacity urban transport and freight resilience, alongside national rail interoperability and modern train control priorities. The 2026-27 Federal Budget allocation for transport infrastructure (AUD 10.3 billion) and the dedicated allocation for freight rail network improvements (AUD 1.75 billion) provide near-term visibility for contractors and supply partners positioned for corridor works, stations and precinct interfaces, and enabling upgrades.
Freight-led corridor integration and scope redefinition create openings for contractors focused on interface management and constructability. In May 2026, the Inland Rail program was consolidated to concentrate construction on the Beveridge to Parkes section for completion by end-2027, after a material cost reassessment, shifting workload toward defined segments and enhancement sites rather than delivering the full end-to-end scope at once. Megaproject delivery continues to pull through early works and systems packages, including Sydney Metro West linewide and stations early works reported in April 2026, while South Australia's River Torrens to Darlington program advanced TBM readiness with tunnel lining installation scheduled for the second half of 2026, supporting demand for tunnelling supply chains, specialist plant, and packaged work scopes.
Recent Industry Developments
- July 2026: CPB Contractors and Nacap (JV) were selected by Seqwater to deliver Stage 1 of the Toowoomba to Warwick Pipeline in Queensland, covering a 47 km package. The award adds contracted workload for a tier-1 civil contractor and supports continuity of resources and subcontractor capacity across Queensland infrastructure programs.
- June 2026: UGL and CPB Contractors were awarded an Early Contractor Involvement (ECI) contract for the Swanbank Steel Mill project in Queensland, developed by Future Forgeworks. The ECI scope strengthens front-end constructability and delivery planning capability that can be applied to complex transport-adjacent civil and utilities interfaces often bundled into major corridor packages.
- August 2025: CIMIC Group companies opened the city section of Sydney Metro, delivering 21 stations on an automated service and engaging more than 1,000 local suppliers. Completion of a major operational segment reinforces the role of large integrated consortia in delivering high-complexity rail infrastructure and supports continued procurement of systems, stations, and precinct works across metro expansions.


Research Methodology Framework and Report Scope
Market Definition and Coverage
This market covers the value of construction activity linked to transportation infrastructure in Australia, including building, extending, refurbishing, and, where part of project delivery, demolition work for roads, rail, airports, and ports or waterways.
Scope exclusions: It excludes routine operations and maintenance that do not materially change an asset, and it also excludes transport equipment purchases that sit outside civil works.
Segmentation Overview
-
By Type
- Roadways
- Railways
- Airways
- Ports and Inland Waterways
-
By Construction Type
- New Construction
- Renovation
-
By Investment Source
- Public
- Private
-
By Geography
- New South Wales
- Victoria
- Queensland
- Western Australia
- Rest Of Australia
Data Sources, Market Sizing, and Validation
Desk Research
Desk work started with mapping what gets counted as transportation infrastructure construction in Australia and how it is recorded in public statistics and budgets. For this, we used sources such as the Australian Bureau of Statistics (construction activity and government finance series), the Department of Infrastructure, Transport, Regional Development, Communications and the Arts, and state budget papers and infrastructure pipelines.
To cross-check timing and size of funded work, we also referred to sources such as Infrastructure Australia publications, procurement and tender notices, and audited project updates in public agencies. Where project exposure was described more clearly, we also reviewed company annual reports and investor presentations for direction on project mix and delivery profiles. In a few places, we used paid subscriptions for company financials and intelligence, and for news and financials, mainly to standardize contractor revenue splits and track major award announcements. These desk sources are illustrative, and many additional public documents and databases were used for validation and clarification during the study.
Primary Interviews and Surveys
Primary work focused on confirming how project values convert into annual construction output, and how renovation cycles differ from new builds across road, rail, ports, and airport works. We spoke with contractors, engineering and project management firms, materials and equipment suppliers, and public-sector project stakeholders across Australia to test assumptions on award-to-revenue lags, cost inflation pass-through, and the share of work actually delivered each year.
Distribution of primary research fieldwork respondents
| Company type | Respondent position | Region |
|---|---|---|
| Top tier: 25% | CXOs: 13% | |
| Mid tier: 61% | Functional/Unit leaders: 34% | |
| Smaller Players: 14% | Managers: 53% |
Market-Sizing & Forecasting
For sizing, the main build was done using top-down and bottom-up logic together. The top-down view reconstructed annual construction value using Australia-specific capital works signals, and then we reconciled those results with selective bottom-up checks. In practice, we started from funded transport programs and construction activity series, and then allocated the addressable value into roads, rail, airports, and ports or waterways based on project mix and execution schedules.
A few market fingerprints were used to keep the model realistic, such as the split of new construction versus renovation, typical multi-year delivery patterns (so award values are not treated as same-year revenue), state-level pipeline weighting, and input cost movement that affects contract values. Where public information was incomplete, gaps were handled by using proxy ratios from similar projects and then rechecked through channel inputs, such as sampled average contract values by asset type and estimated annual work done.
Forecasts were prepared using scenario analysis supported by variable-level trends, since infrastructure markets shift with policy timing and project approvals. Key variables that were forecasted and then applied include public and private capital allocation to transport assets, pipeline conversion rates, construction cost inflation expectations, and the share of renewal work within the active base of assets.
Data Validation & Update Cycle
Validation was done through cross-checks between model outputs and independent signals, such as announced pipelines, budgeted spend patterns, and observed award activity, followed by variance reviews at segment and total levels. Outliers were investigated by checking if timing had been misread, if a large one-off project was double counted, or if renovation activity was being mixed with routine maintenance.
Before sign-off, the numbers go through multi-step analyst reviews so assumptions are consistent across years and segments, and interview notes are reflected in the final build. Reports are refreshed annually, and interim updates are triggered when a material event changes the pipeline, delivery schedules, or cost assumptions. Right before delivery, a final refresh pass is completed so the latest public releases are reflected in the outputs.
Mordor Intelligence's Australia Transportation Infrastructure Construction Market Size Compared With Other Published Estimates
Published market values for transportation infrastructure construction in Australia often do not match because the boundary can shift in small but important ways, and timing is treated differently across studies. Differences usually come from what is included as construction output versus pipeline value, how renovation is handled, and whether public and private investment are combined consistently.
By tracking award-to-spend lags, refreshing inflation assumptions, and separating renovation from routine upkeep, Mordor Intelligence keeps the total tied to annual construction output. This can differ from estimates that lean on headline pipeline totals or that blend maintenance-heavy budgets into construction.
Benchmark comparison
| Source | Market Size | Gaps in Research Methodology |
|---|---|---|
| Mordor Intelligence | USD 24.77 B (2025) | |
| Industry Association A | USD 29.10 B (2025) | Often closer to an investment pipeline view, where large program announcements and forward allocations can be counted at face value without fully converting them into annual delivered construction activity. |
| Global Consultancy B | USD 22.40 B (2025) | May apply a narrower boundary that undercounts airport and port-side civil works, or it may use conservative delivery assumptions that reduce the recognized in-year construction value for multi-year projects. |
The spread in the table is mostly explained by timing and scope choices, not by a single right or wrong data point. When scope is fixed to transport civil works and project values are translated into in-year delivery using realistic lags and cost progression, the result becomes easier to reproduce and compare across years.


Key Questions Answered in the Report
How large will the Australian transportation infrastructure construction market be by 2031?
The market is forecast to reach USD 32.6 billion by 2031, expanding at a 4.68% CAGR from 2026.
Which state is growing fastest in transport infrastructure construction?
Queensland records the highest forecast CAGR of 5.94% through 2031, driven by Bruce Highway upgrades and Olympic preparations.
What is the main challenge facing project delivery over the next two years?
Acute skilled-labor shortages combined with wage inflation reduce delivery capacity, subtracting an estimated 1.1% from forecast CAGR.
How are digital twins influencing project outcomes?
Government BIM mandates and digital twin pilots on metro and highway projects improve cost certainty and commissioning speed, positioning early adopters for competitive advantage.
Page last updated on:






