
Market Overview
| Study Period | 2020 - 2031 |
|---|---|
| Forecast Data Period | 2026 - 2031 |
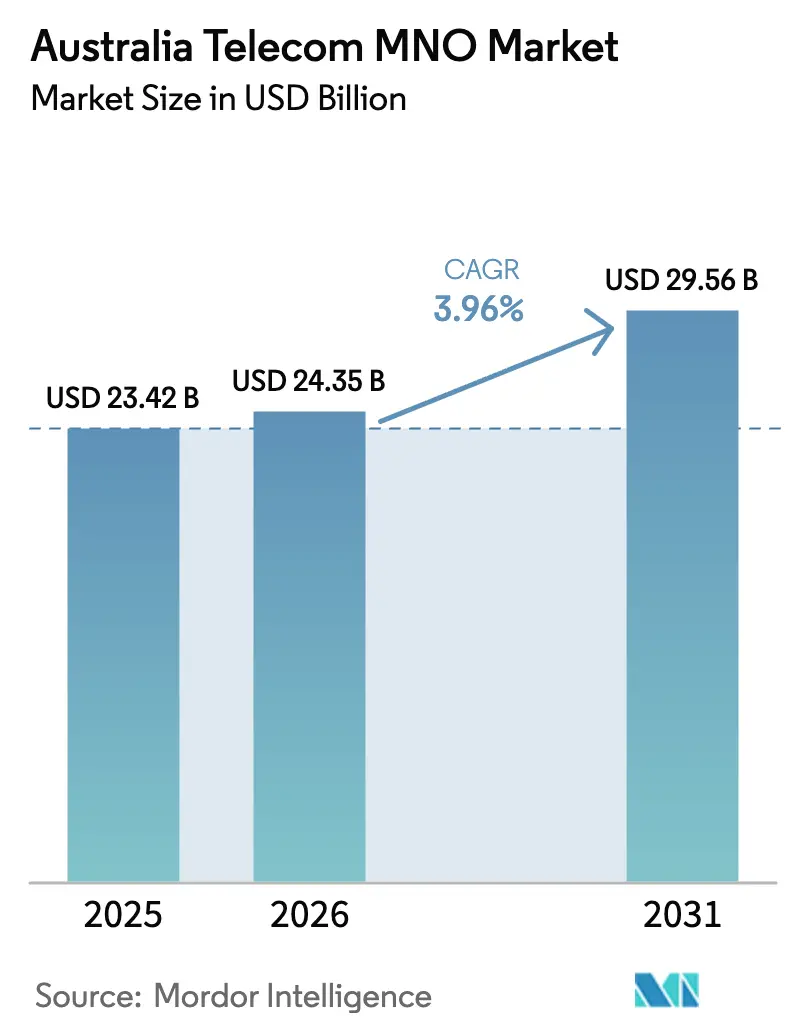
| Base Year Market Size (2025) | USD 23.42 Billion |
| Market Size (2026) | USD 24.35 Billion |
| Market Size (2031) | USD 29.56 Billion |
| Growth Rate (2026 - 2031) | 3.96 % |
| Market Concentration | High |
Major Players *Disclaimer: Major Players sorted in no particular order Image © Mordor Intelligence. Reuse requires attribution under CC BY 4.0. | |
Australia Telecom MNO Market Analysis by Mordor Intelligence
The Australia Telecom MNO Market size is expected to grow from USD 23.42 billion in 2025 to USD 24.35 billion in 2026 and is forecast to reach USD 29.56 billion by 2031 at 3.96% CAGR over 2026-2031. In terms of subscriber volume, the market is expected to grow from 34.65million subscribers in 2025 to 41.42million subscribers by 2030, at a CAGR of 3.63% during the forecast period (2025-2030). In terms of subscriber volume, the market is expected to grow from 34.65million subscribers in 2025 to 41.42million subscribers by 2030, at a CAGR of 3.63% during the forecast period (2025-2030). This outlook reflects a resilient growth trajectory powered by nationwide 5G coverage gains, fiber-to-the-premises (FTTP) upgrades, and rising enterprise demand for managed ICT and cloud connectivity. At present, data services secure the largest revenue share of 47% while voice services retain 25%, underscoring the structural shift toward bandwidth-intensive applications. Competitive intensity continues to rise as TPG finalizes network-sharing with Optus, Vocus absorbs TPG’s fixed assets, and Telstra invests USD 800 million in AI-enabled network automation. Meanwhile, daily mobile traffic has climbed to 9 million GB and average monthly usage is projected to double to 28.7 GB by 2028, sustaining capacity monetization opportunities even as higher NBN wholesale charges and retail price increases squeeze household budgets.
Key Report Takeaways
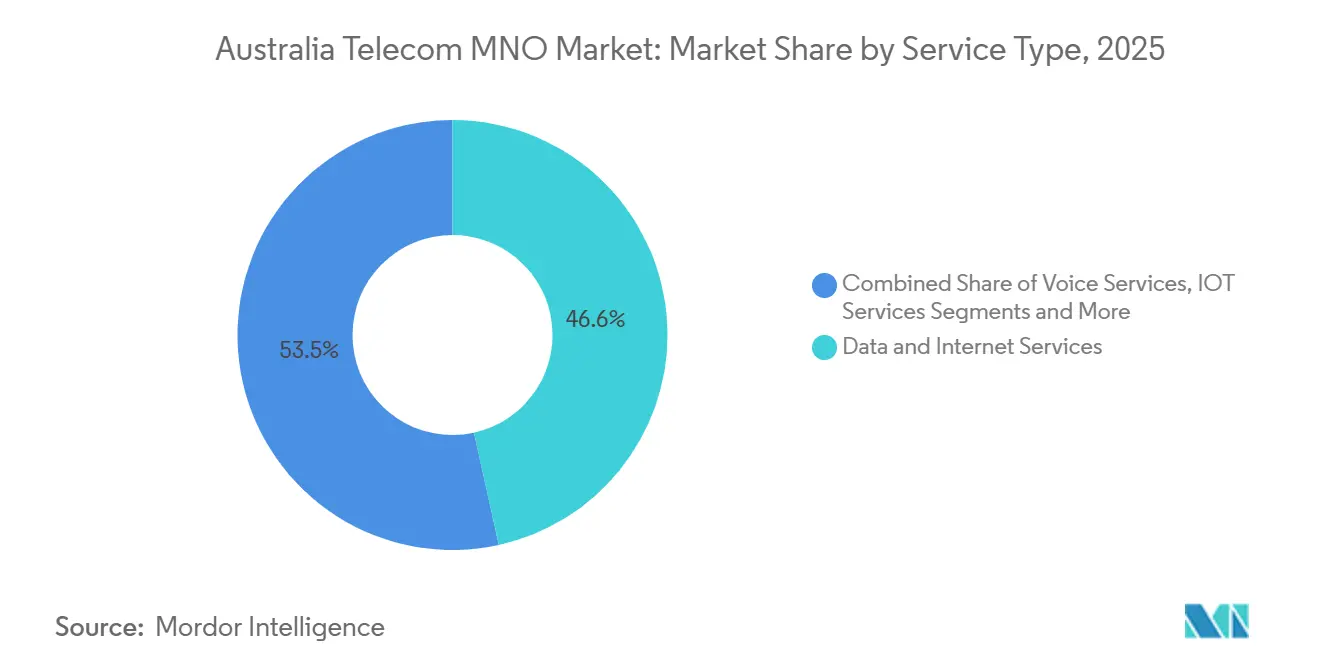
- By service type, data services captured 46.55% of Australian telecom MNO market share in 2025 and are pacing at a 3.99% CAGR through 2031.
- By end-user, the enterprise segment held 31.15% share of the Australian telecom MNO market size in 2025 and is expanding at a 4.18% CAGR to 2031.
Note: Market size and forecast figures in this report are generated using Mordor Intelligence’s proprietary estimation framework, updated with the latest available data and insights as of 2026.
Australia Telecom MNO Market Trends and Insights
Drivers Impact Analysis*
| Driver | (~) % Impact on CAGR Forecast | Geographic Relevance | Impact Timeline |
|---|---|---|---|
| 5G coverage expansion and premium monetization | +1.2% | National, high impact in Sydney, Melbourne, Brisbane | Medium term (2-4 years) |
| Fibre-to-the-premises upgrades boosting ARPU | +0.8% | National NBN footprint, priority metro areas | Long term (≥ 4 years) |
| Surging enterprise demand for managed ICT and cloud connectivity | +1.0% | National, major business centers | Short term (≤ 2 years) |
| Mobile-data growth from streaming and gaming services | +0.9% | National, higher in urban areas | Short term (≤ 2 years) |
| Direct-to-device LEO satellite partnerships for rural reach | +0.4% | Regional and remote Australia | Long term (≥ 4 years) |
| Private 5G networks adoption in mining and heavy industry | +0.3% | Western Australia, Queensland mines | Medium term (2-4 years) |
| Source: Mordor Intelligence | |||
5G Coverage Expansion Driving Premium Service Monetization
Australia’s 5G rollout has passed the early-adopter phase and is now the primary engine of revenue uplift. Telstra reaches 91% population coverage and Optus exceeds 80%, underpinned by a USD 800 million multiyear capex plan that embeds Ericsson’s AI-based network management to unlock differentiated speed tiers. Customers migrating to premium 5G plans lifted mobile service revenue 3.7% year-over-year in 2024, counterbalancing price fatigue in lower tiers. Enterprise interest is likewise robust: Newmont’s Cadia mine reported 80% improvement in underground communications after pilot 5G deployment, validating advanced use cases in autonomous haulage. Spectrum availability in the 26 GHz and 28 GHz bands, allocated under ACMA’s apparatus licensing framework, further accelerates metropolitan small-cell densification.[1]Australian Communications and Media Authority, “26 GHz and 28 GHz Bands,” acma.gov.au
FTTP Network Upgrades Accelerating ARPU Recovery
The federal government’s USD 3 billion infusion and NBN Co’s USD 800 million co-investment will upgrade 622,000 premises to gigabit capability by 2030, lifting the share of ultrafast connections to 94% of households. Average household data consumption has risen ten-fold in the past decade, and gigabit tiers position service providers to reclaim ARPU lost to discount plans. NBN Co projects a USD 10.4 billion GDP contribution from productivity gains linked to FTTP, yet annual wholesale increases aligned to CPI—4.1% for FY25—continue to squeeze retailer margins.[2]Australian Financial Review, “Labor Invests USD 3 Billion in NBN,” afr.com Operators are mitigating cost pressure by nudging customers to NBN 100 and NBN 250 plans, where usage-based overage fees and bundling create incremental margin headroom.
Enterprise ICT Demand Fueling Managed Services Growth
Enterprise outlays on secure connectivity, private cloud on-ramps, and managed services are rising faster than consumer spend. Optus signed a seven-year USD 1.6 billion deal with Suncorp that spans voice, contact center, and data networks, signalling confidence in long-term contract economics. The enterprise segment’s 4.35% CAGR eclipses consumer expansion due to higher ARPU, network-level service-level agreements, and cybersecurity certifications such as ISO-27001 that tilt demand toward Tier-1 carriers. Consolidation is reshaping supply: Vocus’ USD 5.25 billion acquisition of TPG’s wholesale and government arm brings 50,000 km of fiber under a single challenger brand, strengthening buyer choice in data-center interconnect and dark-fiber leasing. Telstra’s Cloud Connector platform reports double-digit client growth as enterprises bypass public internet to reach Microsoft Azure and AWS with deterministic latency.
Mobile Data Surge from Streaming and Gaming Applications
Mobile traffic keeps setting records as video streaming adoption broadens. Telstra now carries 9 million GB daily, and national average monthly usage is forecast to jump from 14.4 GB in 2023 to 28.7 GB in 2028. Subscription video-on-demand (SVOD) services reached 49.9 million active subscriptions in 2024, generating USD 2.7 billion revenue while driving a 47% increase in downstream data over the fixed and mobile networks. Unlimited mobile plans are rapidly replacing metered tiers, accounting for 57% of active services versus 6% a decade earlier. Gaming intensifies bandwidth demand: low-latency titles such as Call of Duty Mobile spur further traffic while pushing carriers to unlock edge-compute resources near population centers to manage jitter.
Restraints Impact Analysis*
| Restraint | (~) % Impact on CAGR Forecast | Geographic Relevance | Impact Timeline |
|---|---|---|---|
| Intensifying price competition eroding mobile ARPU | -0.7% | National, acute in metro markets | Short term (≤ 2 years) |
| Regulatory price-setting and NBN wholesale cost pressures | -0.5% | National NBN areas | Medium term (2-4 years) |
| Rising fixed-wireless and LEO satellite substitution risk | -0.3% | Regional and remote Australia | Long term (≥ 4 years) |
| Talent shortage in advanced network engineering and AI | -0.4% | National, major cities | Medium term (2-4 years) |
| Source: Mordor Intelligence | |||
NBN Wholesale Cost Pressures Constraining Operator Margins
Retail providers face widening cost-revenue gaps because NBN Co’s wholesale pricing has increased 4.1% annually, with higher-speed tiers absorbing the largest absolute jumps. The ACCC flagged NBN’s proposed special access undertaking as a “potential price shock,” adding oversight risk should indexation outpace CPI. Telstra warns that 25% of copper disconnections have not migrated to NBN due to affordability issues and argues that sustained wholesale rises threaten broadband penetration targets. Retailers increasingly upsell higher speed tiers and bundle entertainment to buffer gross margins, but headroom is limited as households tighten discretionary spend amid cost-of-living pressures.
Price Competition Intensifying Across Mobile Services
Telstra raised postpaid prices 4% in August 2024 to offset inflationary costs while Optus lifted prepaid tariffs by USD 4 in April 2025; TPG strategically responded with 50% promotional discounts, igniting churn in value-oriented customer segments. The ACCC’s 2024 market report notes retail mobile prices climbed an average 3.5% year-over-year but ARPU fell 2% as users shifted to lower cost plans or deferred handset upgrades.[3]Australian Competition and Consumer Commission, “Downloads Soar as Australians Binge on Streaming,” accc.gov.au TPG’s network-sharing with Optus extends coverage to 98.4% of the population, intensifying urban competition and restraining premium pricing power. Bundled offers—pairing mobile with NBN or streaming—are now core to loyalty strategies as carriers defend subscriber bases in saturated metro corridors.
*Our forecasts treat driver/restraint impacts as directional, not additive. The impact forecasts reflect baseline growth, mix effects, and variable interactions.
Segment Analysis
By Service Type: Data Services Command Market Leadership
Data services generated USD 10.9 billion in 2025, equating to 46.55% of Australian telecom MNO market share and growing at 3.99% CAGR through 2031. The rise of OTT video, cloud gaming, and enterprise VPN traffic positions data revenues to exceed USD 13.8 billion by the end of the period, sustaining their dominance within the Australian telecom MNO market. Voice services delivered USD 5.81 billion and hold 24.80% share but trail other categories with 3.74% CAGR as users pivot to over-the-top calling. IoT and M2M services contributed USD 1.87 billion, supported by projections that cellular IoT connections will climb to 6.4 billion globally by 2029. OTT and PayTV fetched USD 2.59 billion, while value-added and roaming services collectively accounted for USD 2.25 billion.
Data traffic grew threefold in five years, and average monthly consumption is poised to double through 2028, confirming the structural shift in user behavior. SVOD revenue expanded 14% year-over-year to USD 2.7 billion as subscription counts neared 50 million, explaining why data ARPU growth outstrips voice. ACMA performance codes now require carriers to publish peak-time packet-loss metrics, raising service-quality benchmarks that favor providers with dense backhaul and caching resources.


By End-user: Enterprise Segment Outpacing Consumer Growth
Enterprises contributed USD 7.3 billion in 2025, or 31.15% of Australian telecom MNO market size, and are set to widen their weight as 4.18% CAGR eclipses consumer growth. Large contracts such as Optus-Suncorp validate the premium enterprises pay for managed SD-WAN, secure cloud on-ramps, and unified communications. Government initiatives mandating Essential Eight cyber controls drive agencies toward certified telcos with Tier-IV data centers and ISO-27001 compliance.
Consumers still represent USD 16.12 billion of revenue, yet growth slows to 3.70% CAGR amid price fatigue and saturation. YouGov polling found 28% of Australians struggled to pay mobile bills in 2024, pushing carriers to extend hardship programs and low-income concessions. Small-business clients occupy a middle ground, demanding elastic bandwidth and zero-touch provisioning. Telstra’s Adaptive Networks suite bundles 4G/5G backup links and management portals, capturing SME wallet share while feeding cross-sell to cyber and UCaaS.

Geography Analysis
Metropolitan hubs exert disproportionate influence on traffic and revenues. Sydney posts the fastest median fixed download speed at 67.29 Mbps while Adelaide tops mobile at 125.79 Mbps, reflecting operator densification strategies. The National Broadband Network reaches more than 8.6 million premises, and 78% of its fixed-line footprint supports ultrafast tiers.
Rural Australia encounters persistent coverage gaps that direct-to-device LEO satellites now begin to bridge. Telstra’s June 2025 launch of Starlink-powered messaging covers thousands of blackspots and will add voice in 2027, aligning with government plans to embed LEO within the universal mobile service obligation framework. Optus targets 2028 for its counterpart service, with spectrum coordination rules under ACMA review to forestall interference.
Industrial regions in Western Australia and Queensland accelerate private 5G adoption, catalyzed by mining automation. Newmont’s Cadia mine demonstrated an 80% boost in communication reliability, and BHP trials edge-linked drones for real-time ore assessment. Tasmania and South Australia benefit from network-sharing accords that inject fresh capacity without duplicative towers, and dark-fiber backhaul routes through Adelaide’s data-center cluster ease interstate congestion. Ongoing ACMA spectrum auctions plus state-level co-investment grants under the Regional Connectivity Program ensure continued capex allocation outside big cities.
Regulatory Landscape
Australia's mobile and broadband services operate under a dual-regulator framework. The Australian Communications and Media Authority (ACMA) oversees spectrum, service standards, and industry rules, while the Australian Competition and Consumer Commission (ACCC) supervises competition and access pricing, including National Broadband Network (NBN) access regulation. A key near-term anchor is the ACCC's NBN regulatory cycle commencing 1 July 2026, where the replacement module to NBN Co's Special Access Undertaking (SAU) is being set. This is expected to shape wholesale pricing and service-quality obligations for retail service providers.
Spectrum and coverage policy also remain active. In March 2026, ACMA consulted on its draft Five-Year Spectrum Outlook 2026-31, including priorities relevant to evolving mobile and satellite use cases. Broader government telecom reform discussions have included measures aimed at infrastructure deployment efficiency and consumer safeguards. Regulators have also focused on emergency calling reliability (Triple Zero) and transparency, with tighter expectations on service-quality reporting and consumer protections as networks become more software-defined and rely more on shared infrastructure models.
Competitive Landscape
Australia remains an oligopoly dominated by Telstra (44% share), Optus (31%), and TPG (17%). Their combined 92% revenue share underscores high, though gradually loosening, concentration. Telstra continues to invest USD 800 million over four years in AI-enabled self-optimizing networks, leveraging Microsoft Azure to cut outage incidence and shorten mean-time-to-repair. Optus differentiates on speed, achieving 230.5 Mbps median 5G downloads, and stakes growth on customer-experience refinements. TPG doubled coverage to 98.4% via network-sharing with Optus, positioning itself as price leader.
Infrastructure sharing is now strategic orthodoxy. The ACCC endorsed the Optus-TPG pact in 2024 but previously blocked a Telstra-TPG deal, citing undue market power. Vocus emerged as a formidable challenger after its USD 5.25 billion purchase of TPG’s enterprise fixed network, forming Australia’s largest independent fiber operator. Disruptors include LEO satellite entrants and IoT specialists such as M2M One that lease Telstra wholesale SIMs yet deliver full-stack device management.
Regulatory oversight anchors market openness. ACMA enforces spectrum-sharing conditions in the millimeter-wave bands, while the ACCC’s merger guidelines deter asset swaps that would entrench dominance. Privacy reforms and cybersecurity directives are adding compliance costs, but also level the field for mid-tier ISPs able to certify zero-trust architectures.
Australia Telecom MNO Industry Leaders
Telstra Corporation Limited
TPG Telecom Limited
Singtel Optus Pty Limited
- *Disclaimer: Major Players sorted in no particular order


Market Opportunities and Future Outlook
Regional and remote connectivity is a clear whitespace where policy, technology, and commercial models intersect. The Universal Outdoor Mobile Obligation (UOMO), introduced in November 2025, provides a concrete pathway for blending terrestrial mobile coverage with direct-to-device low earth orbit (LEO) satellite services, with government framing the obligation around covering large outdoor areas across Australia. Carrier activity is already visible in satellite-enabled mobile services, including Telstra's direct-to-satellite text capability launched in June 2025, which creates an avenue for MNOs and partners to package safety, messaging, and enterprise field connectivity alongside conventional plans.
A second opportunity area comes from the next NBN regulatory cycle from 1 July 2026. With NBN wholesale price and service-quality parameters set under ACCC determination, carriers and ISPs can differentiate through higher-reliability business-grade broadband, managed connectivity, and cloud on-ramps rather than competing only on headline speeds. Enterprise demand signals in the current market, including Optus' long-term managed services contract with Suncorp, also support bundled connectivity and cybersecurity-aligned services, plus private-network extensions in sectors such as mining where private 5G pilots have already demonstrated operational benefits.
Recent Industry Developments
- June 2026: TPG Telecom Limited and Optus sign 11-year regional MOCN agreement to expand regional mobile coverage using shared Optus infrastructure. The launch expands network reach in non-urban Australia and strengthens competitive parity through shared assets.
- June 2026: ACMA directed publishing of standardized mobile coverage maps by Telstra, Optus, and TPG using consistent predictive modelling. The requirement increases regulatory transparency and could affect investment pacing and pricing across MNOs.
- May 2026: Australian Government (Regulatory/Policy) imposes a collective spectrum levy of USD 7.3 billion on Telstra, Optus, and TPG for spectrum use. The levy raises sector wide cost pressures and could influence capex allocation and service pricing.


Research Methodology Framework and Report Scope
Market Definition and Coverage
For this methodology, the Australia telecom market is defined as retail and wholesale telecom service revenues earned in Australia from providing connectivity and related services to consumers and enterprises, across mobile and fixed networks.
Scope exclusions: We exclude handset and device sales, pure IT services, and media content revenues that are not billed as part of telecom service plans.
Segmentation Overview
- Overall Telecom Revenue and ARPU
- Service Type
- Voice Services
- Data and Internet Services
- Messaging Services
- IoT and M2M Services
- OTT and PayTV Services
- Other Services (VAS, Roaming and International Services, Enterprise and Wholesale Services, etc.)
- End-user
- Enterprises
- Consumer
Data Sources, Market Sizing, and Validation
Desk Research
Desk research is used to build a clean fact base for demand, pricing, and industry structure before any modeling starts. We mainly rely on public regulator and government publications, such as ACMA telecommunications trend reports, ACCC communications market reporting, and the Australian Bureau of Statistics series that indicate household and business connectivity adoption.
We also pull supporting context from sources such as operator annual reports and investor presentations, NBN Co updates, and telecom standards and technology references published by bodies such as ITU and GSMA, where relevant to service definitions. For cross-checks on company financial splits and MNO versus MVNO positioning, we use paid subscriptions focused on company financials and news, plus a patent database for technology direction checks. The desk research sources listed above are illustrative, and many other public documents and datasets were also referred to for data collection, validation, and clarification.
Primary Interviews and Surveys
Primary work is used to confirm what is actually being monetized in Australia telecom and how pricing and usage are changing by customer type. We speak with a mix of operators, wholesalers, channel partners, enterprise buyers, and industry experts so assumptions on ARPU, speed tier mix, and plan migration can be corrected when desk sources are silent. Since this is a country market, coverage is built around national network footprints and key customer cohorts rather than splitting by global regions.
Distribution of primary research fieldwork respondents
| Company type | Respondent position |
|---|---|
| Top tier: 36% | CXOs: 15% |
| Mid tier: 49% | Functional/Unit leaders: 40% |
| Smaller Players: 15% | Managers: 45% |
Market-Sizing & Forecasting
Sizing starts with a top-down build where operator reported service revenues, regulator-led telecom indicators, and household and business connectivity adoption are used to reconstruct the addressable service pool for Australia. That view is then tested using selective bottom-up approximations, such as sampled plan pricing by tier multiplied by active services, plus channel checks on wholesale versus retail shares, which helps adjust totals when one dataset looks lagged.
Key inputs used in the model include mobile services in operation, broadband service mix and speed tier movement, data consumption growth patterns, postpaid versus prepaid mix changes, and advertised price movements tracked in public monitoring. We also watch for step-change events that can distort a single year, such as the 3G shutdown and plan refresh cycles, because they impact churn, usage, and how revenue is recognized across voice and data.
For forecasting, we use scenario analysis supported by trend smoothing, where base case volumes and ARPU paths are projected separately and then recombined into revenue. When a bottom-up check cannot be completed for a niche revenue pocket, it is handled through proportional allocation from validated totals and then re-tested with interview feedback until variances fall into a reasonable range.
Data Validation & Update Cycle
Outputs are validated through multiple passes so obvious gaps do not slip through. We compare the model totals against independent signals, such as regulator trends, major operator revenue direction, and service count movements, and then investigate any mismatch that is larger than what pricing or usage shifts can explain.
Anomaly checks are done at several levels, including year over year growth by service type, implied ARPU ranges, and whether the split between consumer and enterprise aligns with what interviewees describe. If a variance is still open, we re-contact selected experts and update assumptions, followed by an internal review before final sign-off. Reports are refreshed annually, and interim updates are done when material events occur, with a final pre-delivery pass so the client receives the latest updated view.
Mordor Intelligence's Australia Telecom Market Size Compared With Other Published Estimates
Published market sizes for Australia telecom can vary even when the topic sounds the same, since firms do not always count the same revenue streams or use the same timing and currency assumptions. Differences also come from whether the model is anchored to services and pricing signals, or if it is mainly extrapolated from a single revenue snapshot.
In this study, the largest gap driver is usually scope, where some figures fold pay-TV or broader digital services into telecom, and others treat MVNO activity as fully incremental rather than revenue that is shared with host networks, which is treated more conservatively in the final roll up used by Mordor Intelligence.
Benchmark comparison
| Source | Market Size | Gaps in Research Methodology |
|---|---|---|
| Mordor Intelligence | USD 23.42 B (2025) | |
| Industry Research Publisher A | USD 18.63 B (2023) | Uses an earlier base year and a narrower revenue capture that can undercount newer monetization, such as higher-value data plans and premium broadband tiers, and it may not fully normalize one-time plan migrations. |
| Media Syndication Summary B | USD 21.12 B (2024) | Often relies on headline revenue trajectories and a single growth path, which can blur the split between telecom service revenue and adjacent content bundles, and it can apply different exchange-rate timing versus June-year financial reporting cycles. |
The comparison shows that year choice and what gets counted as telecom services explain most of the spread, not a single disagreement on growth. By tying the build to service counts, plan price movements, and reasonableness checks on implied ARPU, the resulting estimate remains traceable to practical inputs that can be re-tested as the market changes.


Key Questions Answered in the Report
How fast is the shift from 4G to 5G connections in Australia?
5G already accounts for 41% of mobile subscriptions and is expected to hit 86% by 2031 on the back of a 15.90% CAGR in connections.
What is driving revenue growth in enterprise telecom services across Australia?
Rising demand for managed ICT, secure cloud connectivity, and private 5G networks is pushing enterprise revenue up at a 4.18% CAGR.
How much government funding is directed to fiber-to-the-premises upgrades?
The federal government has pledged USD 3 billion, matched by NBN Co’s USD 800 million, to extend gigabit access to 622,000 more premises by 2031.
Which player offers the fastest median 5G download speed?
Optus leads with a 230.5 Mbps median download rate, although Telstra retains the widest geographic 5G reach.
Page last updated on:


 Your data is secure and never sold or shared.


