
Market Overview
| Study Period | 2021 - 2031 |
|---|---|
| Forecast Data Period | 2026 - 2031 |
| Base Year Market Size (2025) | USD 0.82 Billion |
| Market Size (2026) | USD 0.87 Billion |
| Market Size (2031) | USD 1.2 Billion |
| Growth Rate (2026 - 2031) | 6.62 % |
| Market Concentration | Medium |
Major Players *Disclaimer: Major Players sorted in no particular order Image © Mordor Intelligence. Reuse requires attribution under CC BY 4.0. | |
Australia Snack Bar Market Analysis by Mordor Intelligence
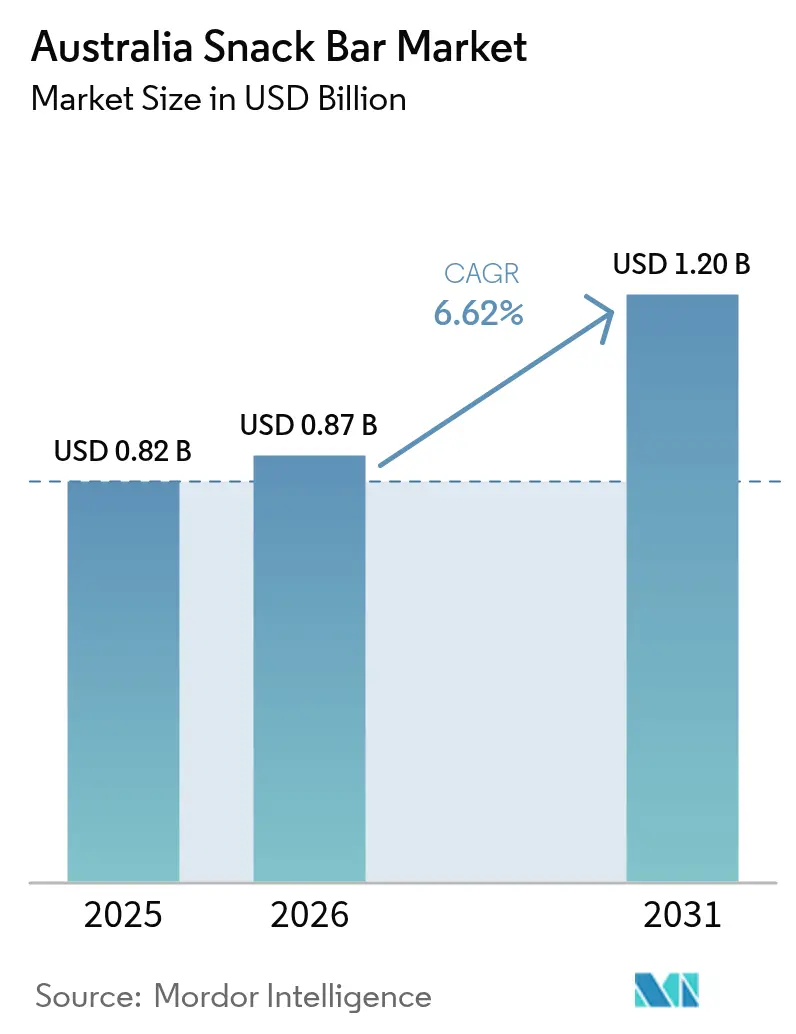
The Australian snack bars market size was valued at USD 0.82 billion in 2025 and estimated to grow from USD 0.87 billion in 2026 to reach USD 1.2 billion by 2031, at a CAGR of 6.62% during the forecast period (2026-2031). This growth is driven by consumer demand for convenient, nutritious, and portable food options. The market expansion is supported by increased health awareness, busy lifestyles requiring on-the-go snacking, and demand for functional foods with added protein, fiber, or vitamins. Consumers, particularly health-conscious individuals, fitness enthusiasts, and young professionals, are increasingly using snack bars as meal supplements or replacements. The market is expanding through product innovations, including plant-based proteins, low-sugar formulations, and allergen-free options. Various packaging formats, from individual packs to eco-friendly pouches, address consumer needs for portion control, portability, and sustainability, while widespread retail distribution ensures market accessibility.
Key Report Takeaways
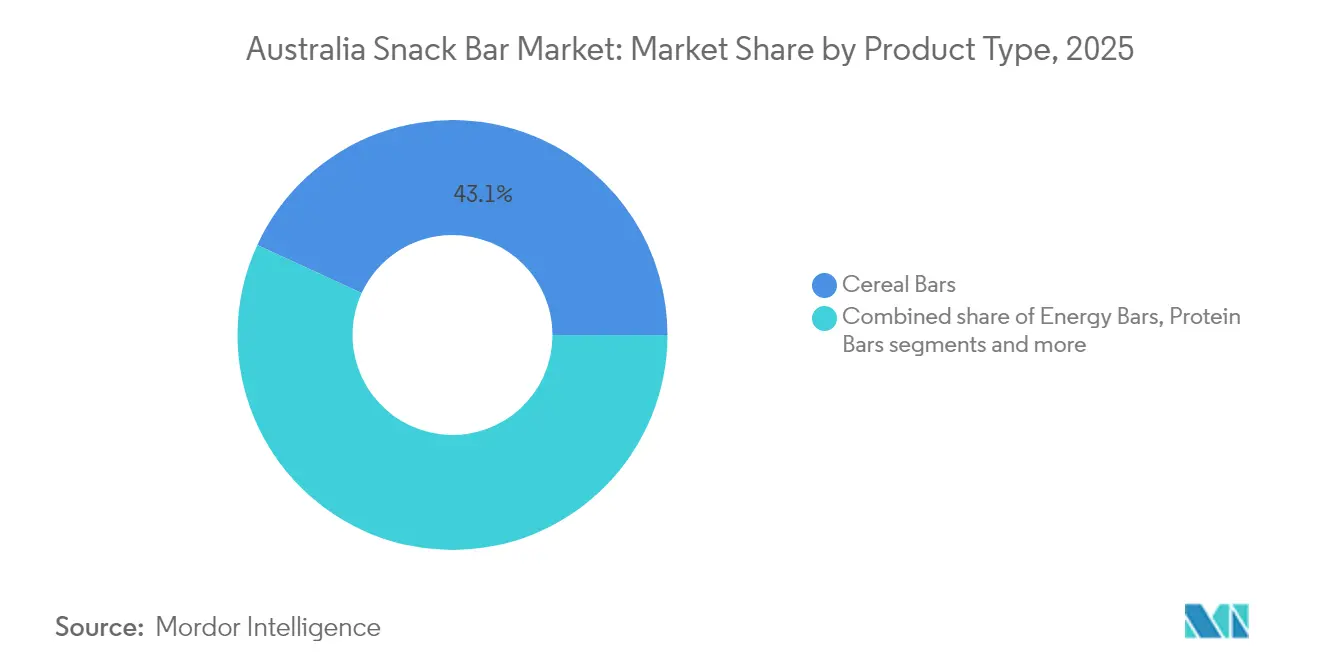
- By product type, cereal bars held 43.12% of the Australian snack bars market share in 2025, while protein bars are poised for the fastest 8.13% CAGR through 2031.
- By packaging, individual packs commanded 64.98% share of the Australian snack bars market size in 2025; single-serving pouches are forecast to expand at a 7.41% CAGR to 2031.
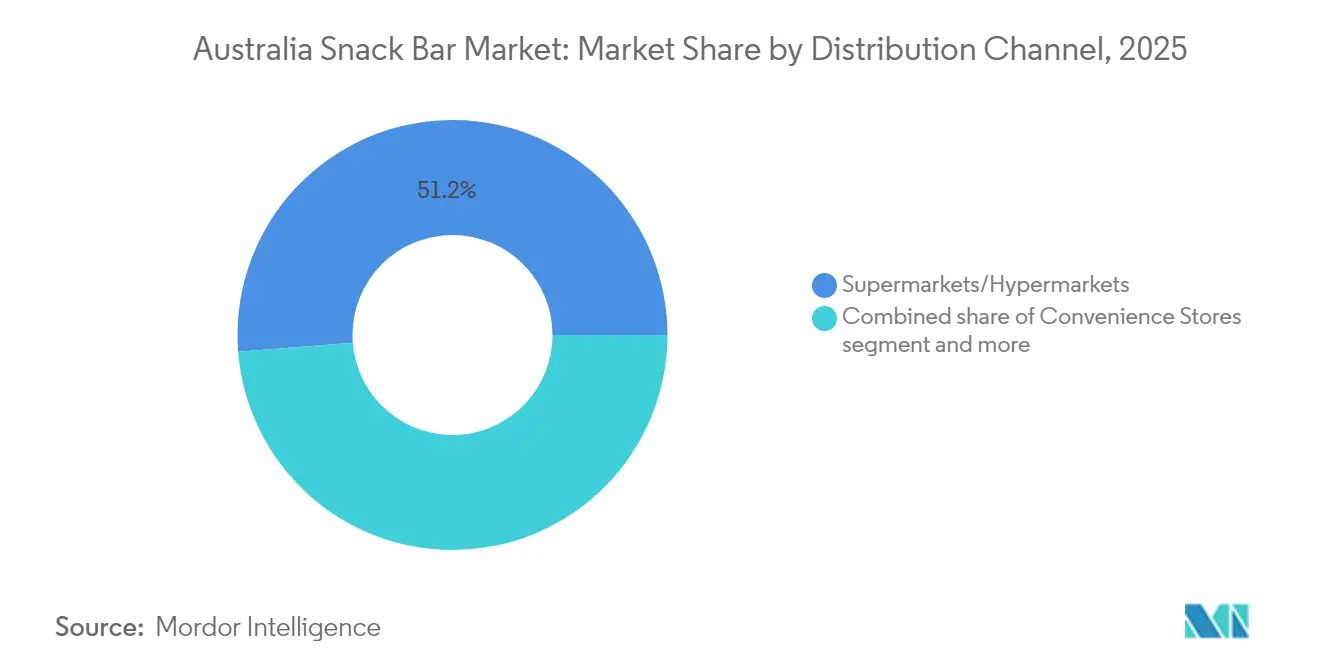
- By distribution channel, hypermarkets and supermarkets accounted for 51.25% of the Australian snack bars market share in 2025, whereas online stores are set to post an 10.55% CAGR during the same period.
Note: Market size and forecast figures in this report are generated using Mordor Intelligence’s proprietary estimation framework, updated with the latest available data and insights as of 2026.
Australia Snack Bar Market Trends and Insights
Drivers Impact Analysis*
| Driver | (~) % Impact on CAGR Forecast | Geographic Relevance | Impact Timeline |
|---|---|---|---|
| Rising health and wellness awareness | +1.8% | National, urban centers | Medium term (2-4 years) |
| Popularity of fitness and sports culture | +1.2% | National, metropolitan areas | Long term (≥ 4 years) |
| On-the-go convenience and portability | +1.5% | National, business districts | Short term (≤ 2 years) |
| Preference for clean label and ingredient clarity | +0.9% | National, premium segments | Medium term (2-4 years) |
| Innovation in flavors and textures | +0.7% | National, major retail chains | Short term (≤ 2 years) |
| Rising interest in plant-based diets | +1.1% | National, coastal urban areas | Long term (≥ 4 years) |
| Source: Mordor Intelligence | |||
Rising Health and Wellness Awareness
Health and wellness awareness is driving changes in the Australian snack bar market by influencing consumer preferences and product innovation. Australians increasingly understand the connection between diet and long-term health, leading to more deliberate food choices that support nutritional goals, disease prevention, and overall well-being. This change is evident in the increased demand for functional snack bars. Public health experts, government agencies, and professional organizations contribute to this trend through education and advocacy. For instance, according to Dietitians Australia, 27,500 Australians die from preventable deaths annually due to unhealthy eating habits, highlighting the need for better dietary choices [1]. This data has increased consumer focus on ingredient quality, portion control, and nutrient-dense snacking options. As a result, consumers in Australia seek snack bars that provide both satiety and functional benefits for energy, digestion, immunity, and weight management.
Popularity of Fitness and Sports Culture
The increasing adoption of fitness and sports culture significantly influences the Australian snack bar market, shaping consumer preferences and product development. The growing emphasis on fitness-conscious lifestyles has increased demand for convenient, functional, and nutritionally enhanced on-the-go snacks that complement active routines. Snack bars, particularly those containing protein, energy-boosting ingredients, and essential micronutrients, have become essential for fitness enthusiasts seeking nutrition before, during, or after workouts. The correlation between sports participation and snack bar consumption is particularly evident among young adults. According to the Australian Sports Commission (AUS), in 2023, the 25-34 age group constituted the largest segment in the nation's fitness and gym industry, with over 1.9 million individuals actively participating in fitness or gym activities [2]. This high level of engagement in fitness programs and organized sports drives the demand for portable, nutrient-rich snacks that support performance, health improvement, and physical well-being.
On-the-Go Convenience and Portability
Convenience and portability drive growth in the Australian snack bar market, influencing product development and consumer preferences. Modern urban lifestyles, characterized by long work hours, daily commutes, and busy family schedules, create demand for nutritious, easily transportable snacks. Snack bars meet these requirements through their compact, individually wrapped format, allowing consumers to incorporate healthy snacking into their daily routines at work, during exercise, at school, or during outdoor activities. This consumer need prompts manufacturers to improve product accessibility through packaging innovations that maintain freshness while enhancing convenience. For instance, in June 2023, BC Snacks launched protein bars in multi-pack formats, addressing the preferences of time-conscious Australian consumers. Their new product line, including Raspberry Truffle, Chocolate Brownie Crunch, and Dark Chocolate Almond flavors, demonstrates the industry's focus on variety and portion control. This development aligns with the market's shift toward multi-pack and single-serve options, meeting the needs of commuters, students, athletes, and parents preparing school lunches.
Preference for Clean Label and Ingredient Transparency
The demand for clean labels and ingredient transparency has become a significant driver in the Australian snack bar market, influencing consumer purchasing decisions and product formulation strategies. Australian consumers carefully examine food labels for information about additives, preservatives, sugar content, allergens, and ingredient quality. This focus on transparency has evolved into a fundamental consumer requirement, where clear information about sourcing, processing, and nutritional value directly correlates with product trust and quality. Regulatory standards and consumer protection measures strengthen this emphasis on transparency. According to Food Standards Australia New Zealand (FSANZ), in 2023, 70% of Australians expressed trust in mandatory back-of-pack food labeling, including the nutrition information panel and ingredients list. This trust level indicates consumers' reliance on these labels for making informed food choices and demonstrates the widespread demand for clear ingredient and nutrition information. Snack bar manufacturers that provide transparent communication and align their products with clear ingredient claims experience increased customer loyalty and repeat purchases.
Restraints Impact Analysis*
| Restraint | (~) % Impact on CAGR Forecast | Geographic Relevance | Impact Timeline |
|---|---|---|---|
| Intense market competition | -1.4% | National, major retail chains | Short term (≤ 2 years) |
| Strict food labeling compliance | -0.8% | National, uniform implementation | Medium term (2-4 years) |
| Fluctuating raw-material prices | -1.1% | National, supply chain dependent | Short term (≤ 2 years) |
| Allergen risk and liability | -0.6% | National, processed-food category | Long term (≥ 4 years) |
| Source: Mordor Intelligence | |||
Intense Market Competition from Other Snacks
The Australian snack bar market faces strong competition from alternative snack categories, which constrains its growth potential. While snack bars maintain advantages in convenience and health positioning, they compete with various snacking options, including protein yogurts, nut mixes, trail mixes, and fresh and dried fruits. These alternatives offer similar health benefits, such as high protein, fiber content, and natural ingredients, which creates category overlap and provides consumers with multiple options for their dietary needs. The competitive environment has intensified with new product launches from established companies and emerging start-ups. Australian consumers' expanding expectations for taste, texture, and variety require snack bar manufacturers to focus on maintaining customer loyalty and market penetration. This competitive landscape requires snack bar brands to innovate continuously while demonstrating their value in an expanding health-focused snack market.
Fluctuating Raw Material Prices
Raw material price volatility constrains the Australian snack bar market by affecting manufacturer operations and consumer purchasing decisions. The prices of key ingredients - grains, nuts, dried fruits, and sugar - have experienced significant fluctuations due to global supply chain disruptions, weather events, currency movements, and geopolitical issues affecting major exporters. The Australian Food and Grocery Council reports that rising input costs threaten the entire supply chain's sustainability, forcing manufacturers and distributors to make critical operational decisions. Sugar prices have increased by 46% since 2023, particularly affecting margins for manufacturers of low-sugar and health-focused snack bars. These rising ingredient costs create a challenging situation for manufacturers, who must either absorb the higher costs and accept reduced margins or increase retail prices, risking the loss of price-sensitive consumers to cheaper alternatives.
*Our forecasts treat driver/restraint impacts as directional, not additive. The impact forecasts reflect baseline growth, mix effects, and variable interactions.
Segment Analysis
By Product Type: Protein Bars Challenge Cereal Dominance
Cereal bars constitute a significant market force in the Australian snack bar category, commanding a substantial 43.12% share in 2025. The segment's growth is primarily driven by increasing consumer demand for convenient options, as Australian consumers navigate demanding schedules and require efficient breakfast and snack solutions. The market has established a strong competitive position by differentiating products as nutritionally superior alternatives to traditional sugary snacks, incorporating essential components such as whole grains, natural sweeteners, and fortified nutritional elements, including vitamins, minerals, and fiber.
Protein bars, despite their smaller market share, are growing at a CAGR of 8.13%, exceeding the overall snack bar market growth rate. This expansion stems from increased health consciousness, fitness-focused lifestyles, and the growing importance of protein in daily nutrition, as both athletic and general consumer segments seek satiety and muscle support. In Australia, the Australian Bureau of Statistics (ABS) reports that in 2024, snack foods accounted for approximately 1.5% of total protein intake . While this percentage is modest, it indicates a significant change in dietary patterns, especially considering the concurrent increase in snack food consumption.

By Packaging Type: Single-Serving Innovation Drives Growth
Individual packs constitute 64.98% of the Australian snack bar market in 2025, functioning as a fundamental market driver through strategic alignment with consumer requirements for portion control and convenience. This packaging configuration serves as a critical market determinant by addressing the operational requirements of Australian consumers who necessitate efficient, portable snack solutions for systematic integration into daily consumption patterns. The format's instrumental role in facilitating precise portion management and caloric regulation, while ensuring product integrity and adherence to safety protocols, functions as a primary catalyst for market expansion.
The single-serving pouch segment demonstrates substantial market advancement, recording a 7.41% compound annual growth rate (CAGR). The segment's expansion is primarily attributed to enhanced portability features and sustainability initiatives. Manufacturing entities are implementing recyclable, biodegradable, and reduced-plastic material solutions in response to environmental considerations. The strategic combination of operational efficiency and environmental sustainability positions single-serving pouches as a key market driver, functioning in parallel with the established individual pack format in the Australian market.
By Distribution Channel: Online Acceleration Reshapes Retail
Supermarkets and Hypermarkets dominated the Australian snack bar market in 2025, accounting for 51.25% of total sales. These retail formats serve as primary distribution channels through their extensive geographic coverage, comprehensive product selections, and established consumer purchasing patterns. Australian consumers demonstrate a strong preference for these retail environments, driven by the ability to conduct physical product evaluations, execute immediate transactions, and engage in volume purchasing. The strategic positioning of established brands, implementation of systematic promotional activities, and sophisticated merchandising techniques continue to strengthen the market position of these retail channels.
Online stores represent the fastest-growing distribution channel, demonstrating an 10.55% compound annual growth rate (CAGR). This growth signifies a fundamental transformation in consumer purchasing patterns, as digital retail continues to drive market expansion through enhanced convenience, personalized shopping experiences, and efficient product comparison capabilities. According to the Interactive Advertising Bureau (IAB), convenience emerged as the dominant factor for Australian digital shoppers in 2024, with 68% of respondents identifying it as their primary motivation for online purchases during the survey period.
Geography Analysis
The Australian snack bar market demonstrates distinct geographical consumption patterns, with metropolitan regions exhibiting concentrated demand due to higher disposable income levels and health-oriented consumer preferences. The coastal urban centers, particularly in New South Wales and Victoria, show pronounced demand for plant-based and premium products, while inland territories maintain traditional cereal-based consumption patterns. The established retail infrastructure, dominated by Woolworths and Coles, facilitates comprehensive product distribution across diverse geographical segments.
The geographical expanse of Australia necessitates sophisticated interstate logistics networks, influencing supply chain operations and cost structures. Manufacturers implement strategic distribution systems to address varying regional demands while maintaining product integrity across different climate zones. This geographical consideration is evidenced by Ferndale Foods Australia's USD 13.1 million investment in August 2023 for a new manufacturing facility, strategically positioned to serve the growing demand for healthier snack bars.
The market's geographical scope remains predominantly domestic, with limited international expansion due to regulatory priorities focused on local compliance. The Food Standards Australia New Zealand framework implements uniform regulations across all geographical jurisdictions, enabling consistent national brand development through standardized safety and labeling requirements across states and territories.
Regulatory Landscape
Snack bars sold in Australia must comply with the Australia New Zealand Food Standards Code administered by Food Standards Australia New Zealand (FSANZ), covering food safety, composition, allergens, and mandatory labeling requirements (including a Nutrition Information Panel and responsible business details for the manufacturer, supplier, packer, or importer). The compliance baseline is periodically consolidated, with FSANZ releasing updated Code compilations (e.g., June 2025 and March 2026), which manufacturers and private-label retailers use to maintain label accuracy across claims such as protein, fiber, or reduced sugar.
A major policy signal for packaged snack manufacturers is FSANZ Proposal P1067, which moved into a first call for submissions in 2026 to consider mandating the Health Star Rating (HSR) on most packaged foods, shifting a widely used front-of-pack scheme toward formal Code requirements. For imported snack bars and ingredients, the Department of Agriculture, Fisheries and Forestry (DAFF) enforces biosecurity and food safety through the Imported Food Inspection Scheme (IFIS), using risk-based inspection and testing; importers may need a Full Import Declaration and can face holds pending a Food Control Certificate outcome, making documentation, traceability, and label compliance operational priorities.
Competitive Landscape
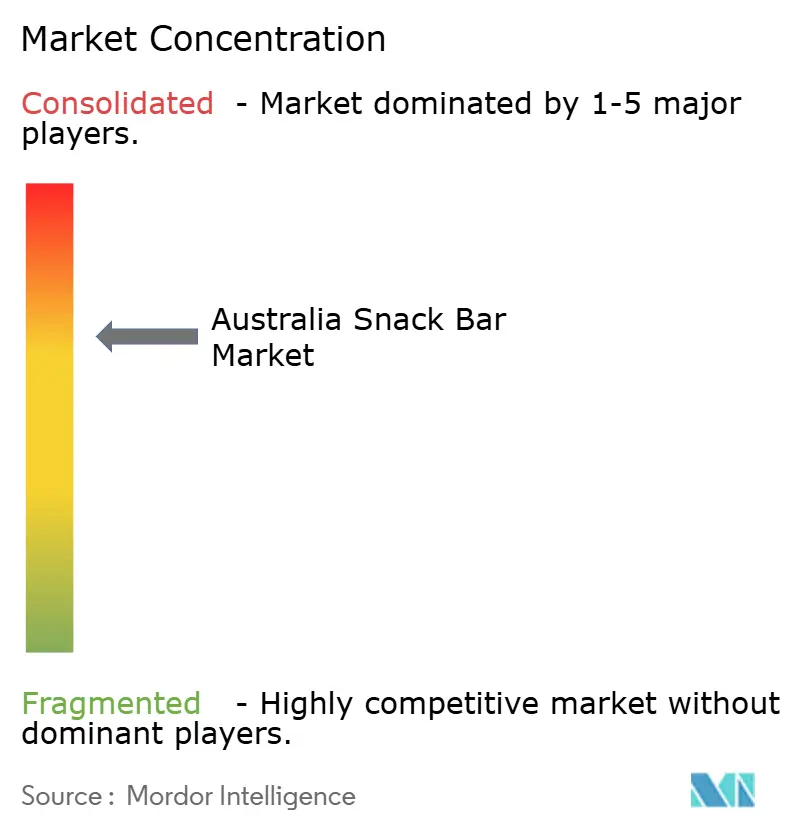
The Australian snack bars market demonstrates moderate consolidation, with increasing competition between regional and international players. Key market participants include Nestlé S.A., Mondelēz International, Inc., Mars, Incorporated, The Simply Good Foods Company, and others. Companies focus on vertical integration, technology adoption, and sustainability initiatives to differentiate their products while meeting regulatory standards. Market opportunities exist in plant-based protein formulations, functional nutrition for specific health conditions, and premium products that command higher margins through ingredient transparency and local sourcing.
International companies enter the market with substantial Research and Development resources and comprehensive marketing strategies. This drives domestic companies to enhance product quality, packaging innovation, sustainability practices, and digital marketing efforts. The market landscape continues to evolve as local companies maintain their position through regional expertise, while international corporations establish new standards in branding, supply chain efficiency, and product variety.
The regulatory framework established by the Australian Packaging Covenant Organisation creates significant operational implications for market participants. Companies that implement sustainable packaging solutions ahead of mandatory compliance deadlines gain strategic advantages in market positioning. This regulatory environment fundamentally transforms the competitive landscape, as environmental performance becomes equally important as traditional product attributes in determining market success.
Australia Snack Bar Industry Leaders
-
Nestlé S.A.
-
Mars, Incorporated
-
Mondelēz International, Inc.
-
The Simply Good Foods Company
-
The Sanitarium Health and Wellbeing Company
- *Disclaimer: Major Players sorted in no particular order
Market Opportunities and Future Outlook
Opportunities center on functional nutrition and cleaner formulations that align with how Australians use bars as portable meal supplements (protein-forward, high-fiber, and lower-sugar lines), supported by growing trust in mandatory back-of-pack labeling and active engagement in fitness. Ingredient and formulation whitespace is opening through local capability build-out: in February 2026, Plenty Foods opened Australia’s first high-protein nut powder processing facility in regional Queensland (supported by Australian and Queensland Government funding), creating a domestic input stream for protein-enriched and functional snack formats and reducing reliance on imported specialty ingredients.
Manufacturing and packaging automation is another visible pathway to improve speed-to-shelf and SKU variety while managing labor and throughput constraints. In 2026, Mars announced a AUD 200 million investment program in Australian manufacturing, including factory upgrades that incorporate robotics and artificial intelligence, while Mondelez invested in an automated packaging line at its Scoresby site to lift packaging capability. For snack-bar players, these moves reinforce a market direction toward higher-frequency innovation cycles, more complex multipacks and portion formats, and stronger in-country supply resilience that can support expansion across supermarket dominance and fast-growing online channels.
Recent Industry Developments
- May 2026: Mars announced a AUD 200 million investment to upgrade Australian manufacturing operations, including the use of robotics and artificial intelligence. The program signals continued modernization of domestic production footprints that supply convenience-led, impulse-friendly formats, supporting faster changeovers and broader SKU strategies across bars and adjacent snacking.
- July 2025: Mars Wrigley launched Snickers Loaded in Australia, featuring increased peanuts and caramel, and produced the product at its Ballarat facility. The local manufacturing emphasis supports quicker distribution cycles and reinforces the role of domestic plants in servicing high-velocity convenience and supermarket channels.
- October 2024: Ferndale Foods Australia launched Team Nutrition protein snack bars in four flavors (Choc Crunch, Salted Caramel Crunch, Mint Crisp, and Strawberry Cream). The rollout added competitive intensity in protein-led segments, expanding choice for fitness-oriented consumers and increasing shelf contention in modern trade.
Research Methodology Framework and Report Scope
Market Definition and Coverage
For this study, the market covers the value of snack bars sold in Australia through retail and online channels, where products are bought as ready-to-eat bars for snacking, convenience, or nutrition.
Scope exclusions: We exclude homemade bars and most fresh bakery items sold loose, and we also exclude broader confectionery and biscuit categories that are not positioned and sold as snack bars.
Segmentation Overview
- By Product type
- Cereal Bars
- Granola / Muesli Bars
- Other Cereal Bars
- Energy Bars
- Protein Bars
- Fruit and Nut Bars
- Other Snack Bars
- Cereal Bars
- By Packaging Type
- Individual Packs
- Multi-Packs
- Single-Serving Pouches
- Others
- By Distribution Channel
- Hypermarkets / Supermarkets
- Convenience Stores
- Specialty Stores
- Online Stores
- Others
Data Sources, Market Sizing, and Validation
Desk Research
Desk work starts by building a clean fact base for Australia, so pricing, trade, and consumption signals can be compared year on year. We reference public sources such as the Australian Bureau of Statistics releases, Australian Government food and health guidance, Food Standards Australia New Zealand updates, and border trade statistics from the Australian Border Force and UN Comtrade (where relevant for packaged foods).
To keep assumptions grounded, we also review company annual reports, investor presentations, and product nutrition panels published on brand websites, along with coverage in reputed business press for pack size and price movement. In a few places, a paid company financials and intelligence subscription and an import and export shipment-level database are used to cross-check manufacturer exposure and ingredient flow direction. The sources listed here are illustrative only, and many other public documents and datasets are used for clarification, cross-checking, and validation.
Primary Interviews and Surveys
Interviews and short surveys are done with a mix of manufacturers, ingredient suppliers, distributors, and retail and category professionals so we can confirm what is actually selling and at what price points. Because this is an Australia-only market, the focus stays on local retail dynamics, promo intensity, and channel mix shifts, and then the findings are used to tighten assumptions that were first built from desk work.
Distribution of primary research fieldwork respondents
| Company type | Respondent position |
|---|---|
| Top tier: 35% | CXOs: 15% |
| Mid tier: 50% | Functional/Unit leaders: 32% |
| Smaller Players: 15% | Managers: 53% |
Market-Sizing & Forecasting
Sizing is built using a top-down and bottom-up approach, where national demand and retail value signals are reconstructed first and then checked using supplier and channel-level approximations. The top-down build uses Australia-focused indicators such as category consumption patterns, channel share splits across supermarkets, convenience, and online retail, observed price architecture by bar type, and promo depth and frequency that can swing value even when volumes are steady.
To validate totals, we run selective bottom-up checks by applying sampled average selling prices to estimated volumes in key channels, then comparing those outcomes with what manufacturers and retailers describe as realistic growth ranges. Where a bottom-up view has gaps (for example, smaller online-only brands and seasonal limited runs), the missing portion is handled through bounded uplift factors tied back to observed shelf presence and interview feedback. Forecasting is mainly done through scenario analysis supported by near-term input tracking, so changes in raw material pressure, private label expansion, health-positioning launches, and channel shifts are carried forward in a way that can be explained and repeated.
Data Validation & Update Cycle
Validation is done by cross-checking the modeled value trend against independent signals such as retail pricing movement, visible promotion cycles, and expected channel growth in Australia. Outliers are flagged and reviewed, and when a variance cannot be explained by mix or pricing, we recheck assumptions and, if needed, reconnect with industry participants to close the gap.
Before sign-off, the numbers go through more than one analyst review so calculation steps, conversions, and year labels stay consistent. The report is refreshed annually, and interim updates are made when material events occur that can shift pricing or demand. Right before delivery, we do a final pass so the latest information is reflected in the market view.
Mordor Intelligence's Australia Snack Bar Market Estimate Compared With Other Published Estimates
Published market numbers for snack bars in Australia can look far apart even when they cover the same end use, because the timing of currency conversion, the way prices are averaged across promotions, and how quickly each provider refreshes its underlying input data can change the final value.
A common gap driver is how average selling price is treated. A model that uses list prices or mixes in broader snack categories will typically land higher than one that adjusts for promo-heavy periods and keeps the product boundary tight. Another driver is refresh cadence, because late-year retail price resets and ingredient-driven price changes can shift the run-rate quickly, and those swings are captured differently depending on when assumptions are locked and validated. This is why the update and currency timing checks applied in Mordor Intelligence can shift the current-year value versus slower-refreshed estimates.
Benchmark comparison
| Source | Market Size | Gaps in Research Methodology |
|---|---|---|
| Mordor Intelligence | USD 0.87 B (2026) | |
| Industry Publisher A | USD 0.59 B (2025) | Uses a different base year and appears to apply a lower value build that can be influenced by AUD to USD conversion timing and a narrower pricing capture for modern channels, which can compress the reported USD value. |
| Industry Publisher B | USD 1.82 B (2024) | Likely expands scope through adjacent bar types and application-led buckets, and may rely on broader price assumptions that do not fully adjust for promotion intensity, which can lift the headline market value. |
The spread across sources is mainly explained by year alignment and how pricing and scope boundaries are applied, rather than a single difference in growth expectations. By keeping the definition consistent, checking ASPs against real-world promo behavior, and revalidating key assumptions before finalization, we end up with a figure that is easier to trace back to clear inputs and repeatable steps.
Key Questions Answered in the Report
What is the current value of the Australia snack bars market?
The Australia snack bars market stands at USD 0.87 billion in 2026 and is projected to reach USD 1.2 billion by 2031.
Which snack-bar category is growing fastest?
Protein bars are expanding at an 8.13% CAGR, outpacing all other product types.
How big is the online channel for snack-bar sales in Australia?
Online stores are forecast to post an 10.55% CAGR through 2031, steadily gaining share from supermarkets.
Why are single-serving pouches important in the category’s future?
They combine portability with recyclability, driving a 7.41% CAGR as brands align with 2025 national packaging targets.