
Market Overview
| Study Period | 2020 - 2031 |
|---|---|
| Forecast Data Period | 2026 - 2031 |
| Base Year Market Size (2025) | USD 8.35 Billion |
| Market Size (2026) | USD 9.01 Billion |
| Market Size (2031) | USD 13.17 Billion |
| Growth Rate (2026 - 2031) | 7.88 % |
| Market Concentration | Low |
Major Players *Disclaimer: Major Players sorted in no particular order Image © Mordor Intelligence. Reuse requires attribution under CC BY 4.0. | |
Australia Prefabricated Construction Market Analysis by Mordor Intelligence
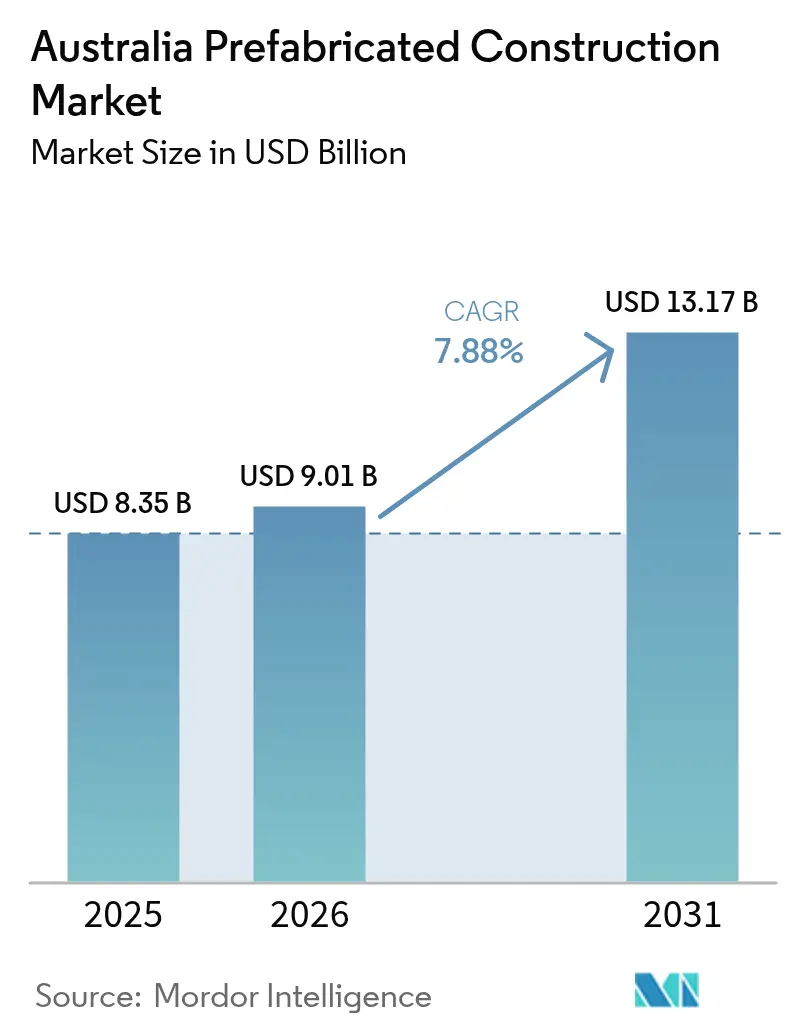
The Australia Prefabricated Construction Market size was valued at USD 8.35 billion in 2025 and estimated to grow from USD 9.01 billion in 2026 to reach USD 13.17 billion by 2031, at a CAGR of 7.88% during the forecast period (2026-2031). Tight housing supply, persistent skilled-labour shortages, and stricter energy-performance rules under the National Construction Code 2022 are steering developers toward factory-based production lines that compress schedules and curb cost overruns. Federal and state programs, including the Housing Australia Future Fund and National Housing Accord, guarantee multi-year volume, while institutional capital is flowing into build-to-rent pipelines that demand repeatable, quality-assured modules. Productivity losses in traditional construction deepen the shift; dwellings completed per hour worked have dropped 53% since the mid-1990s, making industrialized methods a structural necessity. At the same time, modern prefabrication aligns with rising ESG mandates, because controlled assembly minimizes site waste and supports low-carbon materials such as cross-laminated timber.[1]https://www.housingaustralia.gov.au/
Key Report Takeaways
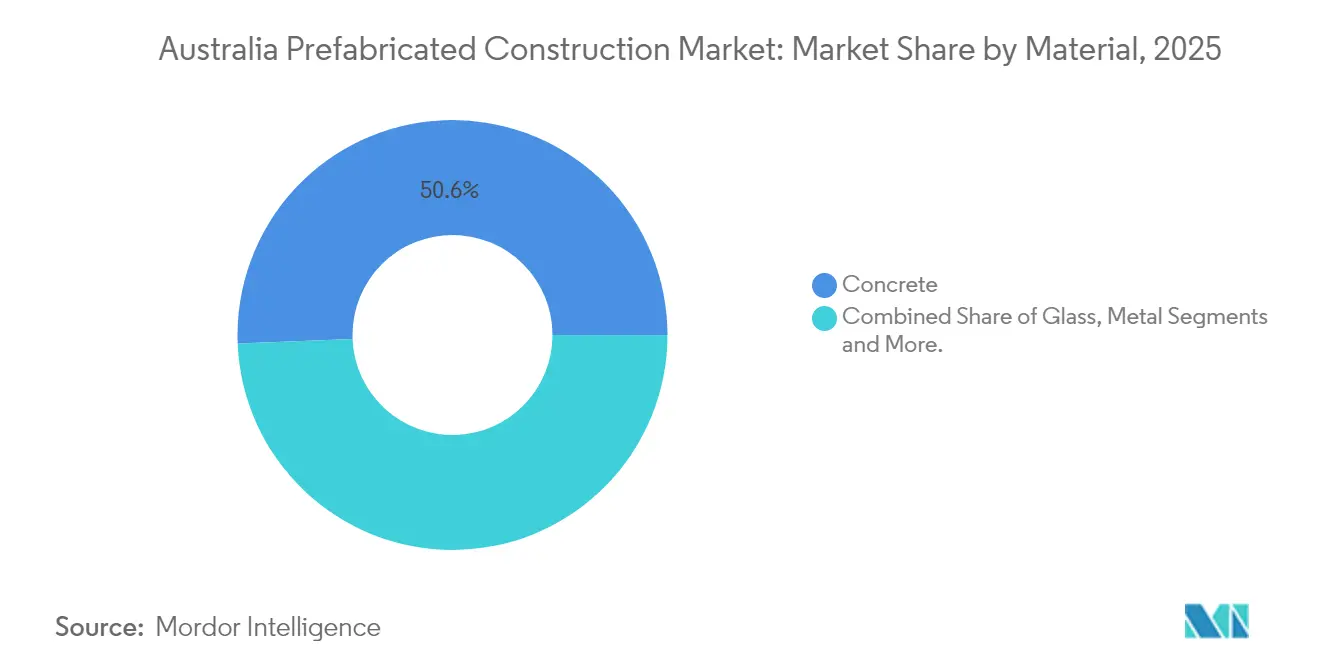
- By material, concrete led with a 50.63% revenue share of the Australia prefabricated buildings market in 2025, whereas engineered cross-laminated timber is poised for the fastest 8.15% CAGR through 2031.
- By application, residential construction held 56.92% of the Australia prefabricated buildings market share in 2025, while commercial schemes are projected to register an 8.29% CAGR to 2031.
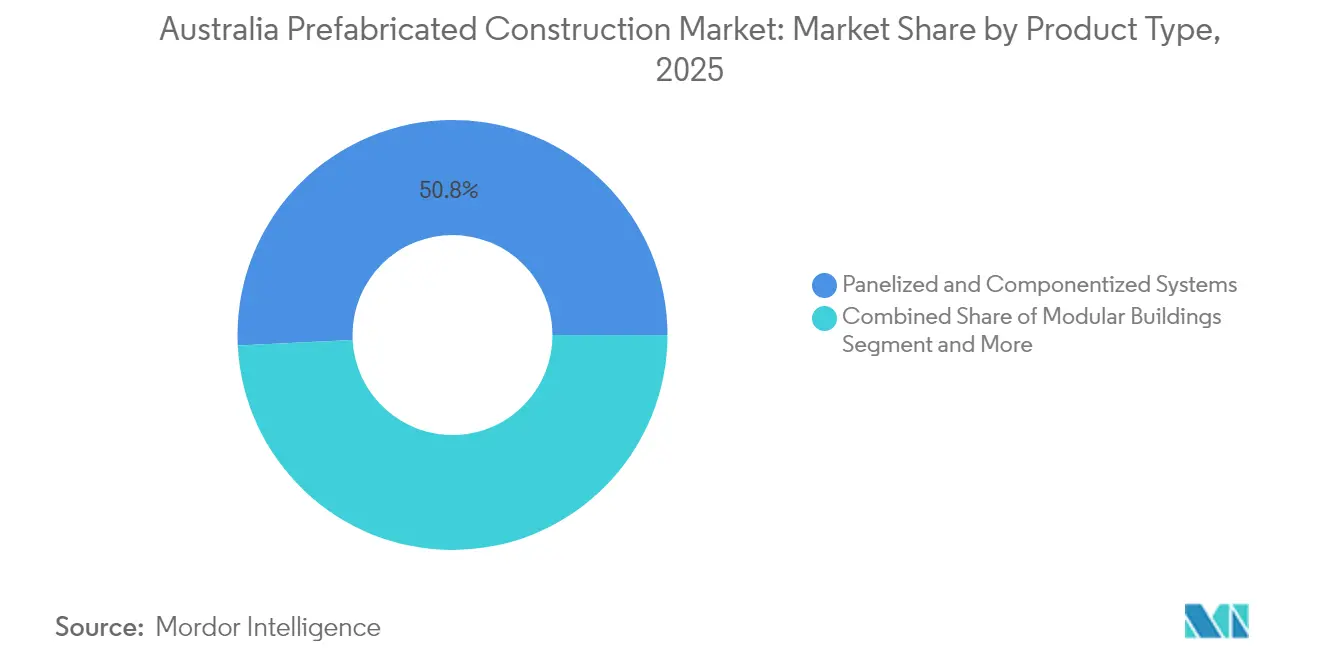
- By product type, panelized and componentized systems captured 50.78% of the Australia prefabricated buildings market size in 2025 and are forecast to grow at an 8.52% CAGR during 2026-2031.
- By city, Sydney accounted for 23.66% of 2025 demand, whereas Perth is forecast to expand at an 8.46% CAGR through 2031, the quickest among major cities.
Note: Market size and forecast figures in this report are generated using Mordor Intelligence’s proprietary estimation framework, updated with the latest available data and insights as of 2026.
Australia Prefabricated Construction Market Trends and Insights
Drivers Impact Analysis*
| Drivers | (~) % Impact on CAGR Forecast | Geographic Relevance | Impact Timeline |
|---|---|---|---|
| Acute housing undersupply and government-backed social/affordable programs favor faster offsite delivery | +2.1% | National, with early gains in NSW, Victoria, Queensland, Western Australia | Medium term (2-4 years) |
| Skilled-labor shortages and high site wages make factory fabrication more cost-predictable | +1.8% | National, acute in Sydney, Melbourne, Brisbane metro construction zones | Short term (≤ 2 years) |
| NCC 2022 energy standards and net-zero goals driving demand for high-performance modular envelopes | +1.4% | National, strongest in Victoria and ACT with aggressive net-zero timelines | Medium term (2-4 years) |
| Rapid-delivery needs in education, healthcare, defense, and disaster recovery suit modular rollouts | +1.2% | National, concentrated in regional Queensland, Northern Territory, and disaster-prone NSW coastal zones | Short term (≤ 2 years) |
| CLT/GLT timber and steel modular growth for mid-rise, BTR, and student housing in major cities | +1.0% | Sydney, Melbourne, Brisbane, Perth CBD and inner-ring suburbs with mid-rise zoning | Long term (≥ 4 years) |
| Source: Mordor Intelligence | |||
Acute Housing Undersupply and Government-Backed Social/Affordable Programs Favor Faster Offsite Delivery
Australia’s National Housing Accord sets a 1.2-million-unit goal by 2030, a scale impossible for site-built techniques to match under present labour constraints. New South Wales has committed to 90 modular dwellings by mid-2026, and Victoria reports 40-50% faster build times plus 60% lower in-process energy when prefabrication is used. Queensland’s 600-unit modular pledge for 2024 underscores statewide momentum. Large-scale funds funnelling capital into social housing now score bidders on ISO 9001 accreditation, automated lines, and delivery track record, limiting access for small, site-only builders. The guaranteed volume enables manufacturers to invest in robotics and lean workflows that push unit costs below conventional builds.
Skilled-Labor Shortages and High Site Wages Make Factory Fabrication More Cost-Predictable
The Housing Industry Association calculates a shortfall of 83,348 tradespeople, inflating wages yet failing to lift output. Centralizing labour in factories lifts productivity through repetitive tasks and optimized tooling; Lendlease Podium installed 137 hospital modules in eight weeks, a pace unattainable on open sites. Automation is advancing: the QUENDA-BOT robot achieved ±5 mm accuracy on mass-timber screws and could trim schedules by 20%. Prefabrication also curbs remote-site costs, because worker travel and accommodation are captured once in plant overhead rather than repeated daily on site.
NCC 2022 Energy Standards And Net-Zero Goals Driving Demand For High-Performance Modular Envelopes
Seven-star residential energy ratings and mandatory photovoltaics now apply nationally, forcing airtight assemblies and robust insulation that factory settings deliver reliably. The Legacy Living Lab in Perth showed 58% of materials can be reused, cutting waste to 1% at end-of-life. Developers such as Mirvac embed modular timber to satisfy embodied-carbon targets without elongating schedules. Standards Australia highlights digital twins as a route to halve design cycles, letting teams validate compliance virtually before cutting a single panel.
Rapid-Delivery Needs in Education, Healthcare, Defence, And Disaster Recovery Suit Modular Rollouts
Modular classrooms at Bellbird Park Secondary were delivered in 32 weeks for AUD 14 million, letting the school open on schedule for the new academic year. Modscape expanded Waverley Private Hospital without shutting sensitive wards. Defense tenders now specify relocatable units so bases scale quickly, and pandemic centres added 2,000 beds across three capitals using volumetric blocks. In disaster-prone NSW zones, 12,000 eligible property buybacks signal rising demand for temporary modular housing.
Restraints Impact Analysis*
| Restraints | (~) % Impact on CAGR Forecast | Geographic Relevance | Impact Timeline |
|---|---|---|---|
| Fragmented state permitting/certification and limited standardization slowing approvals | -1.3% | National, most acute in NSW, Victoria, Queensland due to differing state building codes | Medium term (2-4 years) |
| Transport/cranage over long distances and urban last-mile constraints raising delivered costs | -0.9% | National, concentrated in remote Western Australia, Northern Territory, and dense Sydney/Melbourne CBD zones | Short term (≤ 2 years) |
| Financing pressures and developer insolvencies creating pipeline volatility for manufacturers | -0.7% | National, most severe in NSW and Victoria where developer insolvencies peaked in 2024 | Short term (≤ 2 years) |
| Source: Mordor Intelligence | |||
Fragmented State Permitting/Certification And Limited Standardization Slowing Approvals
Each state enforces unique inspection and paperwork sequences, forcing manufacturers to tweak identical modules for separate approvals. The Victorian Building Authority is researching unified pathways, but adoption remains voluntary. A University of Melbourne digital-twin eApprovals pilot that began in 2025 aspires to auto-check compliance, yet full rollout depends on multi-state cooperation. Until a national system mirrors Europe’s ETA model, prefabricators carry duplicated engineering and legal costs that blunt scale advantages.
Transport/Cranage Over Long Distances And Urban Last-Mile Constraints Raising Delivered Costs
The National Heavy Vehicle Regulator caps modules at 2.5 m width and 4.3 m height, compelling some designs to split for haulage then reassemble on site. Remote mine deliveries can exceed AUD 50,000 per module in escorts and road-user charges. Dense CBD precincts face night-lift fees of AUD 20,000–40,000 per crane pick, with narrow windows that push labor to overtime rates. Regional micro-factories and flat-pack geometries ease costs but cannot yet offset all distance penalties.
*Our forecasts treat driver/restraint impacts as directional, not additive. The impact forecasts reflect baseline growth, mix effects, and variable interactions.
Segment Analysis
By Material: Concrete Leads While Timber Accelerates
Concrete accounted for 50.63% of 2025 revenue, underscoring its fire resistance and structural capacity in mid- and high-rise shells. Automation in batching plants and steel-cage prefabrication enables tight tolerances and rapid curing, giving concrete a reliability edge for podiums and industrial warehouses. The Australia prefabricated buildings market size attributed to precast concrete is further supported by long-term service records in harsh climates. However, embodied-carbon penalties spur developers to evaluate lighter alternatives when design codes permit.
Engineered cross-laminated timber is projected to grow at an 8.15% CAGR, the strongest rate among materials. Cedar Pacific and Sumitomo Forestry are scaling CLT output, while builders leverage the material’s carbon-sequestration benefit to meet ESG commitments. Mass-timber panels allow mid-rise frames to top out weeks earlier than steel or concrete, supporting faster cash flow for build-to-rent investors. Robotics such as QUENDA-BOT improve precision to ±5 mm, lowering rework and positioning timber as a prime beneficiary of digital fabrication. Glass curtain-wall panels and steel-framed modules preserve niche roles for premium façades and rugged mining camps, ensuring the Australia prefabricated buildings market remains multipolar rather than converging on a single dominant material.


By Application: Residential Dominates, Commercial Picks Up Pace
Residential projects held 56.92% of the Australia prefabricated buildings market in 2025, a position anchored by social-housing mandates and the steep supply gap. Catalogue-style modular homes let buyers select finishes without triggering new engineering, shortening approvals and holding costs. The National Housing Accord pipeline secures volume for at least five years, enhancing factory utilization and price stability. Developers like Mirvac channel modular design into a USD 1.8 billion build-to-rent vehicle, expanding the residential addressable base.
Commercial prefabrication is forecast to post an 8.29% CAGR to 2031, buoyed by office fit-outs and mixed-use podiums where faster lease-up boosts investor returns. Lendlease’s 127-module Northern Hospital wing, installed in five weeks, illustrates the throughput edge, which feeds into tenant income sooner. Retail expansions deploy panelized shells to avoid multi-month shutdowns, while logistics operators retrofit distribution centres with modular mezzanines. The Australia prefabricated buildings industry also finds traction in education, healthcare, and defense where repeatable room sizes optimize volumetric layouts. Disaster-recovery housing rounds out demand, anchored by state buyback schemes in flood-prone corridors.
By Product Type: Panelized Systems Maintain Lead and Growth
Residential projects held 56.92% of the Australia prefabricated buildings market in 2025, a position anchored by social-housing mandates and the steep supply gap. Catalogue-style modular homes let buyers select finishes without triggering new engineering, shortening approvals and holding costs. The National Housing Accord pipeline secures volume for at least five years, enhancing factory utilization and price stability. Developers like Mirvac channel modular design into a USD 1.8 billion build-to-rent vehicle, expanding the residential addressable base.
Commercial prefabrication is forecast to post an 8.29% CAGR to 2031, buoyed by office fit-outs and mixed-use podiums where faster lease-up boosts investor returns. Lendlease’s 127-module Northern Hospital wing, installed in five weeks, illustrates the throughput edge, which feeds into tenant income sooner. Retail expansions deploy panelized shells to avoid multi-month shutdowns, while logistics operators retrofit distribution centres with modular mezzanines. The Australia prefabricated buildings industry also finds traction in education, healthcare, and defense where repeatable room sizes optimize volumetric layouts. Disaster-recovery housing rounds out demand, anchored by state buyback schemes in flood-prone corridors.
Geography Analysis
Sydney’s 23.66% slice of Australia's prefabricated buildings market in 2025 rests on high-rise infill and a social-housing drive that mandates rapid delivery. The Building Homes for NSW program finances 90 modular dwellings before mid-2026, and flood-buyback zones add demand for both temporary and permanent units. Wild Modular handed over the state’s first factory-built social homes in Smithfield, indicating official comfort with prefabrication at scale. Yet crane-time premiums of AUD 20,000–40,000 per lift constrain adoption in the tight CBD core, pushing developers to order lighter panel sets that fit smaller rigs.
Perth is set for the highest growth thanks to mining workforce accommodation and state-backed social housing efforts. Long-haul freight charges remain stiff, but major resource clients accept premiums to avoid scarce site labor. The city’s less congested grid simplifies cranage, and low-cost land invites larger automated factories that feed Western Australia and export paths to Asia. Circular-design pilots such as Legacy Living Lab elevate Perth’s ESG narrative, aiding capital raising for green bonds linked to modular assets.
Melbourne secures the second-largest share through institutional pipelines, including Mirvac’s USD 1.8 billion build-to-rent fund and AustralianSuper’s rent-to-own model, both committed to modular rollouts. The Victorian Building Authority’s reform project, expected to finish in 2025, should harmonize certification for industrialized construction, smoothing approvals and encouraging further plant investment. Brisbane benefits from Queensland’s 600-unit modular target and modular classrooms, while remote regions leverage prefabrication for defense expansions and cyclone-recovery housing despite transport mark-ups. Consolidation through Stockland-Supalai’s 2024 purchase of Lendlease’s master-planned communities spreads demand across capitals, giving factories long-range order visibility.
Regulatory Landscape
Australia’s prefabricated construction activity is set within the National Construction Code (NCC 2022) framework. Enforcement and adoption are administered by states and territories, which has kept approvals and certification pathways fragmented for modular manufacturers operating nationally. To reduce interpretation gaps, the Australian Building Codes Board (ABCB) released its Prefabricated, Modular and Offsite Construction Handbook in late 2024, providing guidance on how NCC provisions apply to modern methods of construction (MMC) projects and supporting more consistent inspection approaches.
The regulatory trajectory is moving toward clearer MMC recognition and manufacturer assurance. The NCC 2025 was published for preview on 1 February 2026, with potential adoption by jurisdictions from 1 May 2026, and the ABCB has opened consultation on a National Voluntary Certification Scheme for Manufacturers of MMC, with commencement targeted for mid-2028. Alongside this, the Victorian Building Authority has been researching regulatory reform for industrialised construction, highlighting inconsistent classification and compliance pathways as barriers. Building ministers have also elevated MMC as a delivery lever tied to the national housing target of 1.2 million homes over five years.
Value Chain Analysis
The value chain in Australia’s prefabricated construction market starts with design and engineering (increasingly BIM-led), followed by procurement of structural inputs such as precast concrete and steel framing, with growing use of mass timber including CLT/GLT. This is followed by factory fabrication and QA, logistics (linehaul, escorts where required, and last-mile delivery), and then on-site cranage, installation, and commissioning. Manufacturers and specialist builders such as Ausco Modular, Fleetwood, Modscape, and Hickory typically integrate or tightly coordinate design-for-manufacture, MEP fit-out, and finishing in controlled environments to reduce wet-trade exposure and improve repeatability across residential, social housing, education, healthcare, and resources accommodation.
Bottlenecks sit at two pinch points: (i) certification and approvals and (ii) transport and cranage. Regulatory inconsistencies across states force re-documentation and re-validation of similar modules, and current product certification pathways have limited coverage for whole modular assemblies. That coverage gap drives reliance on performance solutions and additional third-party checks. On the physical flow side, heavy vehicle dimensional constraints and crane-window scarcity in dense metros increase delivered costs, while regional and remote deliveries compound costs through escorts and road-user charges. These constraints are pushing more panelized or flat-pack strategies, regional staging yards, and renewed focus on national initiatives such as the ABCB’s developing voluntary manufacturer certification scheme, alongside NSW government-led MMC programs to streamline repeatable delivery.
Competitive Landscape
Australia's prefabricated buildings market remains fragmented, yet strategic moves signal accelerating consolidation. Incumbents such as Lendlease Podium, Fleetwood, Ausco Modular, and Hickory Group scale via ISO 9001 plants, extensive project logs, and proprietary BIM toolkits. Mirvac confirmed modular adoption across a USD 29 billion pipeline, indicating top-tier developers now internalize offsite capacity to hedge subcontractor risk. Emerging entrants deploy robotic screw-fixing, digital twins, and patent-protected connection nodes. Construction Systems Australia holds US Patent 8151539 for a panel link, showing IP as a defensive moat.
Strategic patterns include vertical integration of design studios and MEP engineers, guaranteeing end-to-end control and de-risking interfaces. Manufacturers form 10-year offtake pacts with superannuation funds to supply build-to-rent apartments, trading volume certainty for price rebates. Meanwhile, credit tightening after high-profile insolvencies (Nicheliving, Roberts Co, Cubitt’s Granny Flats) raises counterparty risk; plants now demand larger deposits, squeezing small developers from the order book. Technology is the new differentiator: firms using automated compliance checking halve design cycles and cut RFIs, lifting bid-win rates on state tenders.
White-space opportunities persist in regional micro-factories that slice haul distances and in circular logistics models that refurbish and redeploy modules instead of scrapping them. Robotic fabrication lines for timber panels can lower unit costs as material offcuts shrink and accuracy rises. Policy support is reinforcing advantages for quality-focused players; the December 2024 ABCB handbook standardizes inspection pathways, shrinking approval variance across states. Over the next five years, expect tier-one contractors to deepen alliances with module specialists while private equity scouts’ margin-rich specialty niches such as healthcare pods and defense barracks.
Australia Prefabricated Construction Industry Leaders
Ausco Modular Construction Pty Ltd
Fleetwood Australia
Modscape
Hickory Group (TBS)
Archiblox Pty Ltd
- *Disclaimer: Major Players sorted in no particular order


Market Opportunities and Future Outlook
An emerging opportunity is regulatory and approvals reform translating into faster, more bankable delivery programs for modular and panelized suppliers. In NSW, the Building (Approvals and Practitioners) Bill 2026 formally recognises prefabricated buildings in law, and the NSW Government has also committed funding to modernise approvals. This includes support for a new regulatory framework and a national certification system for MMC. These shifts create room for manufacturers that can demonstrate consistent factory QA, maintain traceability across digital models and production, and provide certifier-ready documentation packages that reduce rework across jurisdictions.
Project pipelines in student accommodation, affordable and social housing, and institutional programs are expanding the addressable market for standardized volumetric elements and repeatable kits, particularly bathroom pods, room modules, and panelized envelopes that remove wet-trade bottlenecks. Industry evidence in 2026 includes Freecity commencing module installation for a 20-storey student housing project at Macquarie Park, and Hickory and MaxCap starting a major PBSA tower in Melbourne using prefabricated bathroom pods. Both cases highlight demand for scalable offsite packages in high-density assets. Manufacturing capacity and automation investments, such as Modscape and Modbotics committing to a large Queensland facility under a long-term lease, further open opportunities for suppliers of robotic fabrication, component standardization, and logistics services that can support multi-site government housing programs and institutional portfolios.
Recent Industry Developments
- June 2026: Modscape and Modbotics committed to a new 20,918 sqm manufacturing facility at Vantage Yatala in Queensland under a 15-year lease with Frasers Property Industrial. The move expands industrialised construction capacity and strengthens the company’s ability to serve multi-site housing and institutional pipelines from an eastern seaboard base.
- December 2025: Fleetwood Australia reported a $157 million building solutions order book and $215 million order intake for H1 FY2026. The disclosed backlog and intake signaled sustained demand visibility for modular accommodation across resources, infrastructure, and government-aligned projects, supporting planning for plant utilization and procurement.
- December 2024: The Australian Building Codes Board released a national prefabrication handbook to help practitioners apply NCC 2022 requirements to prefabricated, modular and offsite construction. This provided a practical reference to reduce interpretation variability during design, inspection, and compliance, improving execution confidence for manufacturers and certifiers across states.


Research Methodology Framework and Report Scope
Market Definition and Coverage
For this study, the Australia prefabricated buildings market is defined as the value of building structures and major building modules that are manufactured off-site in a controlled facility and then transported for on-site assembly and installation.
Scope exclusions: We exclude conventional on-site construction that does not use factory-made building modules, along with stand-alone raw materials that are not sold as prefabricated building systems.
Segmentation Overview
- By Material (Value)
- Concrete
- Glass
- Metal
- Timber
- Other Materials
- By Application (Value)
- Residential
- Commercial
- Others
- By Product Type (Value)
- Modular Buildings
- Panelized & Componentized Systems
- Other Prefab Types
- By Key City (Value)
- Sydney
- Melbourne
- Brisbane
- Perth
- Rest of Australia
Data Sources, Market Sizing, and Validation
Desk Research
Desk work was used to set the fact base for construction demand and prefab adoption before any market modeling was finalized. We relied on public statistics and official publications such as the Australian Bureau of Statistics building approvals and construction activity releases, infrastructure pipelines from government budget papers, and planning and procurement disclosures.
We also reviewed non-paywalled sources, including building and energy code references, state housing agency updates, trade body materials focused on modular and off-site construction, and peer-reviewed studies covering productivity and waste reduction in prefabrication. To keep company-level inputs realistic, public company filings, investor presentations, and reputable press coverage were used, and a paid subscription for company financials, patents, and shipment-level trade signals was applied selectively where it helped confirm direction and scale. These examples are not exhaustive, and many other sources were referenced for data collection, validation, and clarification.
Primary Interviews and Surveys
Primary interviews and short surveys were used to pressure-test the desk assumptions and then tune the market model to Australia-specific pricing and delivery practices. We spoke with stakeholders across off-site manufacturers, component suppliers, builders, developers, and buyers in residential and non-residential projects, and we also checked views with logistics and installation specialists to validate typical lead times and on-site labor substitution.
Distribution of primary research fieldwork respondents
| Company type | Respondent position |
|---|---|
| Top tier: 33% | CXOs: 16% |
| Mid tier: 46% | Functional/Unit leaders: 37% |
| Smaller Players: 21% | Managers: 47% |
Market-Sizing & Forecasting
Market size was estimated using top-down and bottom-up logic in one connected model, so totals stayed tied to real construction demand and also matched what suppliers can practically deliver. On the top-down side, construction activity and building approvals were used to reconstruct the addressable demand pool for prefab, and then an adoption-rate layer was applied by major application areas and project types.
To keep the sizing grounded, we cross-checked the totals with selective bottom-up approximations, such as sampled average selling prices for modular units and panelized systems multiplied by plausible volumes, followed by channel checks on typical project values. Key inputs that shaped the model included the mix of residential versus commercial activity, the share of projects using modular or panelized methods, typical module and panel pricing progression, transport and installation cost loads, and the timing of large public and private project starts.
For forecasting, scenario analysis was used because adoption and capacity ramp-up can change quickly when policies, labor availability, and project pipelines move. Assumptions on adoption, pricing, and capacity utilization were reviewed with interviewed experts, and gaps in the bottom-up checks were handled by using conservative ranges and then reconciling back to the demand-pool totals.
Data Validation & Update Cycle
Before sign-off, outputs were checked against independent signals such as construction approvals trends, announced project pipelines, and observed pricing movement in prefab modules and related services. Where the model produced sharp step-changes or unusual regional splits, the inputs were rechecked, and follow-up calls were triggered to confirm whether the change was real or caused by a data timing issue.
A multi-step internal review was applied so that assumptions, calculations, and unit conversions were verified by another analyst. Reports are refreshed annually, and interim updates are made when material events occur, such as major policy shifts, project deferrals, or sudden cost shocks. Right before delivery, a final pass is completed so clients receive the most current view based on newly released public data.
Mordor Intelligence's Australia Prefabricated Buildings Market Estimate Compared With Other Published Estimates
Published market values for Australia prefabricated buildings can look far apart because each publisher chooses different cutoffs for what counts as a prefabricated building and which parts of the project value are included. Differences also come from the chosen base year, the assumed pace of prefab adoption, and how price changes are carried forward in the forecast.
Some external estimates expand the scope to include broader construction value capture, which can pull in adjacent on-site works and supporting services and then lift the total. In Mordor Intelligence, the number is limited to prefabricated building structures and major off-site manufactured modules sold into Australia, and then checked against approvals, project starts, and realistic module pricing so double counting is avoided.
Benchmark comparison
| Source | Market Size | Gaps in Research Methodology |
|---|---|---|
| Mordor Intelligence | USD 8.35 B (2025) | |
| Industry Publisher A | USD 10.70 B (2024) | Uses a different base year and appears to include a wider value chain, which can capture more of the on-site build package and inflate the market compared with an off-site module-only lens. |
| Industry Publisher B | USD 5.30 B (2025) | Likely applies a narrower inclusion set or more conservative adoption and pricing assumptions for modular and panelized buildings, which reduces the counted value even when the same country coverage is used. |
The spread across sources mostly comes down to what is counted in the project value and how quickly prefab penetration is assumed to rise. By keeping inputs tied to approvals, project pipelines, and practical pricing checks, the approach here stays traceable to clear drivers that can be reviewed and repeated over time.


Key Questions Answered in the Report
How large is the Australia prefabricated buildings market in 2026?
It stands at USD 9.01 billion and is forecast to grow to USD 13.17 billion by 2031.
What growth rate is expected for prefabricated buildings in Australia?
The sector is projected to register a 7.88% CAGR between 2026 and 2031.
Which material segment is expanding the fastest?
Engineered cross-laminated timber is forecast to post an 8.15% CAGR through 2031.
Why are developers in Australia favoring factory-built modules?
They compress schedules, offset skilled-labor shortages, and meet stricter energy-performance codes.
Which city is forecast to record the highest growth through 2031?
Perth is expected to advance at an 8.46% CAGR, the quickest among major metros.
What policy steps support modular construction nationally?
The National Housing Accord, the Housing Australia Future Fund, and the ABCB’s prefabrication handbook all streamline demand and compliance.
Page last updated on:


 Your data is secure and never sold or shared.


