
Market Overview
| Study Period | 2021 - 2031 |
|---|---|
| Forecast Data Period | 2026 - 2031 |
| Base Year Market Size (2025) | 128.58 gigawatt |
| Market Volume (2026) | 139.60 gigawatt |
| Market Volume (2031) | 208.32 gigawatt |
| Growth Rate (2026 - 2031) | 8.34 % |
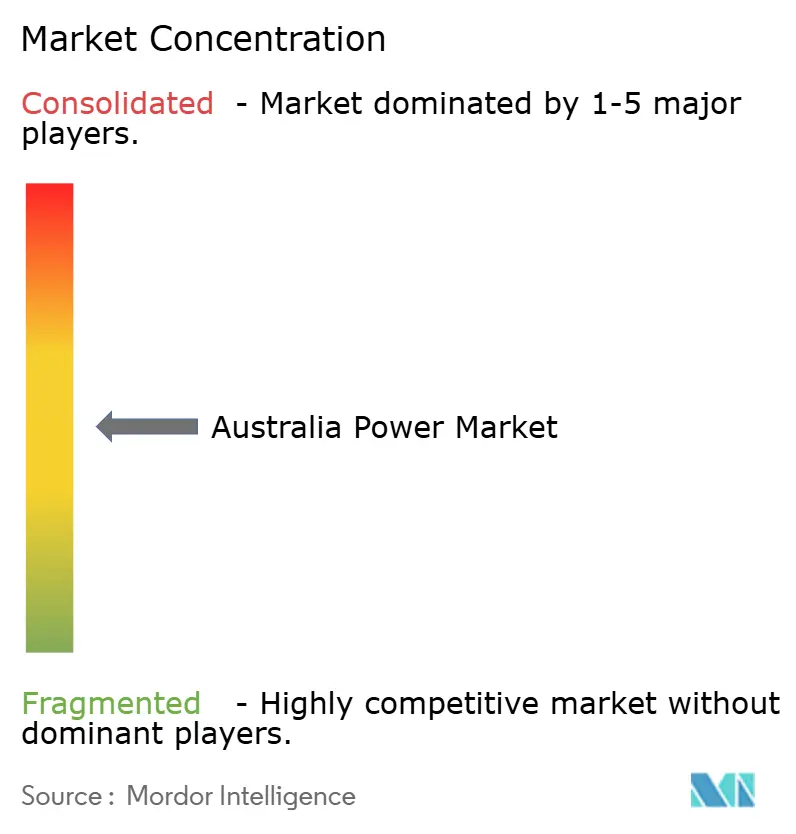
| Market Concentration | Medium |
Major Players *Disclaimer: Major Players sorted in no particular order Image © Mordor Intelligence. Reuse requires attribution under CC BY 4.0. | |
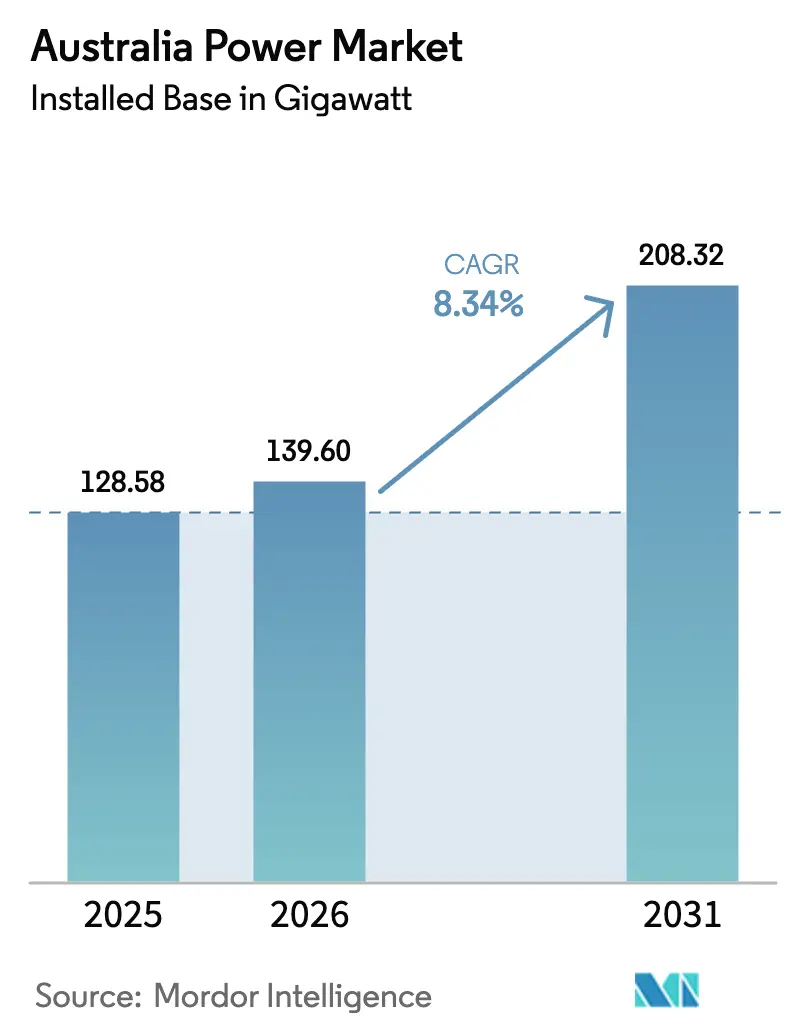
Australia Power Market Analysis by Mordor Intelligence
The Australia Power Market size in terms of installed base is expected to increase from 128.58 gigawatt in 2025 to 139.60 gigawatt in 2026 and reach 208.32 gigawatt by 2031, growing at a CAGR of 8.34% over 2026-2031.
Rapid utility-scale solar and wind additions, paired with 4-hour batteries tendered under the Capacity Investment Scheme, underpin the expansion while coal retires on an accelerated schedule. Corporate power-purchase agreements from miners and data-center operators are now underwriting more contracted capacity each year than the Large-scale Renewable Energy Target, shifting demand anchors toward industrial electrification. Transmission investment led by the AUD 20 billion Rewiring the Nation program supports renewable energy zones, although cost inflation of 25-55% for overhead lines threatens to exhaust funding before later-stage links reach financial close. Growing negative wholesale price intervals, especially the 40% share of spring 2024 midday trading periods in South Australia, create arbitrage room for batteries while eroding merchant revenues for solar and wind. Integrated generators are replacing coal baseload with grid-scale batteries and hydrogen-ready peakers to preserve market share and capture dispatchable margins.
Key Report Takeaways
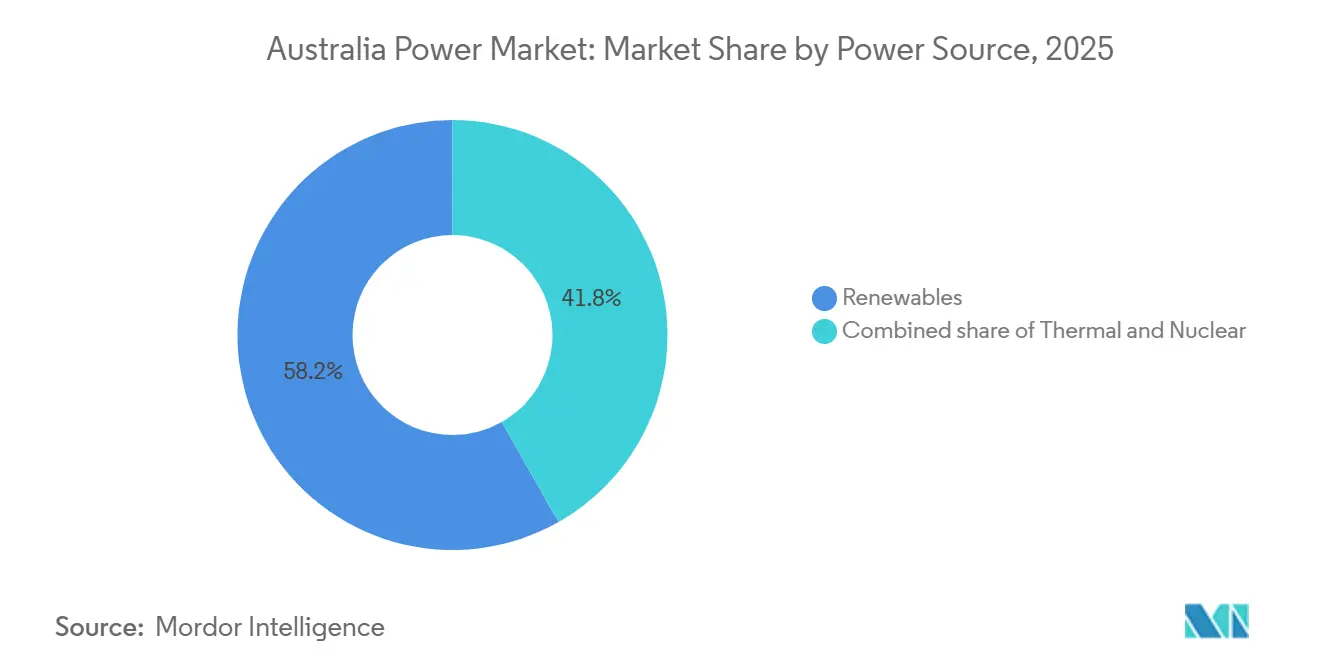
- By power source, renewables held a 58.2% share of the Australian power market size in 2025 and are forecast to expand at a 13.9% CAGR through 2031.
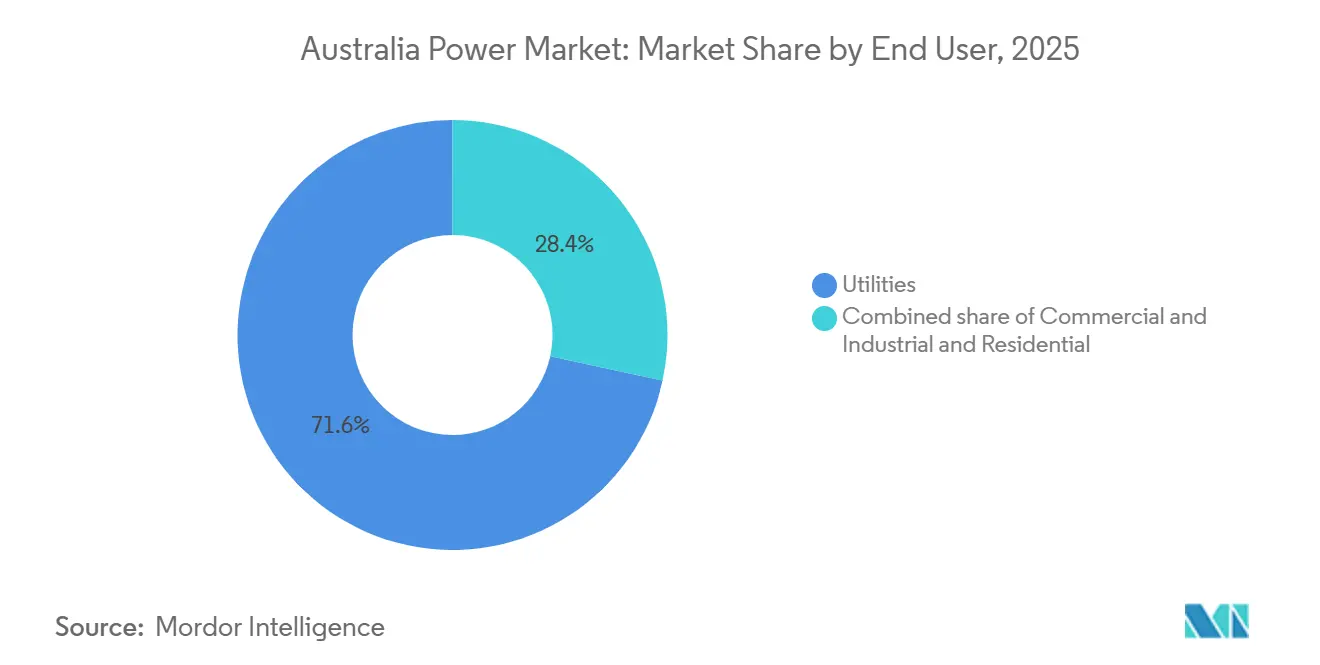
- By end user, utilities controlled 71.6% of Australia's power market share in 2025, yet the residential segment records the fastest growth at a 10.0% CAGR to 2031 as rooftop solar and home batteries proliferate.
Note: Market size and forecast figures in this report are generated using Mordor Intelligence’s proprietary estimation framework, updated with the latest available data and insights as of January 2026.
Australia Power Market Trends and Insights
Drivers Impact Analysis*
| Driver | (~) % Impact on CAGR Forecast | Geographic Relevance | Impact Timeline |
|---|---|---|---|
| Rapid Utility-scale Solar PV Deployment under Large-scale Renewable Energy Target | +2.1% | NSW Central-West Orana, QLD Darling Downs, VIC Murray River zones | Medium term (2-4 years) |
| Surge in Corporate PPAs from Mining & Data-Center Operators | +1.4% | WA Pilbara and Goldfields, spillover to QLD coal regions | Medium term (2-4 years) |
| Grid-scale Battery & Pumped-Hydro Investments Accelerated by CIS | +1.8% | NEM states NSW, VIC, QLD, SA | Short term (≤ 2 years) |
| Federal “Rewiring the Nation” Transmission Funding | +1.3% | Priority corridors NSW-VIC, TAS-VIC | Long term (≥ 4 years) |
| Hydrogen-ready Gas-Turbine Projects | +0.7% | NSW Hunter Valley, VIC Latrobe Valley, SA Port Augusta | Medium term (2-4 years) |
| Electrification of Homes & EV Uptake | +1.0% | Eastern states urban centers | Long term (≥ 4 years) |
| Source: Mordor Intelligence | |||
Rapid Utility-scale Solar PV Deployment under Large-scale Renewable Energy Target (LRET)
The LRET achieved its 33,000 GWh target in 2024, yet certificate oversupply pushed prices down to AUD 25-35/MWh, prompting developers to secure 10-15 year corporate PPAs for revenue certainty.[1]Clean Energy Regulator, “Large-scale Generation Certificates Quarterly Report Q4 2025,” cleanenergyregulator.gov.au Snowy Hydro’s 1,200 MW New South Wales solar portfolio illustrates integrated gentailer hedging that combines generation with retail load. Lightsource bp and ACEN Australia both closed 400 MW solar farms in 2025 after locking in industrial off-takers, a model now standard as wholesale price volatility rises. Eku Energy’s 1,000 MW Riverland Solar project includes co-located storage to monetize energy otherwise curtailed in high-congestion zones. Falling cost curves for bifacial modules and single-axis trackers sustain sub-AUD 50/MWh levelized costs, enabling solar to out-compete new thermal projects without subsidies.
Surge in Corporate PPAs from Mining & Data-Center Operators in Western Australia
BHP’s 100% renewable PPA covering Queensland coal operations from 2027 removes more than 1,000 GWh of annual grid demand and signals board-level alignment on climate targets.[2]BHP Group, “Climate Transition Action Plan 2025,” bhp.com Fortescue is building a 2-3 GW solar-wind-battery pipeline that will commission 500-700 MW each year to reach complete Scope 1 and 2 decarbonization by 2030. Western Australia’s isolated grid expedites renewable penetration because the state solves inertia and firming challenges locally, accelerating battery roll-outs. Hyperscale data-center operators, led by Microsoft and Equinix, signed 24/7 renewable contracts totaling 526 MW in 2025, reflecting AI-driven compute demand that requires continuous power quality. ACCC’s 2025 inquiry found corporate PPA strike prices AUD 10-20/MWh below wholesale averages when contract terms exceed 15 years, transferring volume risk to developers.[3]Australian Competition and Consumer Commission, “Inquiry into Corporate PPA Pricing Transparency 2025,” accc.gov.au
Federal “Rewiring The Nation” Funding For Super-Grid Transmission To Renewable Energy Zones
The AUD 20 billion Rewiring the Nation program has allocated AUD 3.5 billion so far, concentrating on the 360 km HumeLink 500 kV interconnector that will move Snowy Hydro output toward Sydney load centers. Cost inflation of 25-55% for overhead lines and 10-35% for substations relative to the 2024 Integrated System Plan baseline threatens to consume the fund before later-stage links, such as the AUD 7.6 billion VNI West and the Western Renewables Link, secure finance. TransGrid’s AUD 15 billion transmission pipeline for 2024-2034, which includes Central-West Orana renewable energy zone upgrades, is running about two years late on average across 11 projects, prolonging renewable curtailment while waiting for new circuits. Powerlink Queensland’s CopperString 2.0 line obtained AUD 5 billion in combined state and federal funding in 2025, opening North Queensland renewable resources to the National Electricity Market and underpinning new mining electrification demand. Australian Energy Regulator revenue rulings for 2024-2029 granted networks a 5.5-6.0% weighted average cost of capital, below the 6.5-7.0% they sought, signaling that additional concessional loans may be needed to close financing gaps for super-grid corridors.
Grid-scale Battery & Pumped-Hydro Investments Accelerated by Capacity Investment Scheme (CIS)
CIS Tender 3 awarded 4.13 GW of batteries and 15.37 GWh of storage across 16 projects, led by Origin’s 700 MW / 2.8 GWh Eraring unit that became the world’s largest battery in December 2025. Neoen’s 900 MW Collie Battery under construction for 2026 will anchor Western Australia’s coal exit despite its limited multi-day duration. AGL’s 250 MW Torrens Island battery, co-located with a gas plant, cut interconnection costs by 15-20%, illustrating brownfield advantages. Snowy 2.0’s 2,200 MW pumped-hydro slips to 2028-2029 but will offer 175 hours of discharge, tackling long-duration gaps that 4-hour lithium-ion systems cannot fill. AEMO analysis indicates grid-forming inverters add 15-20% capex but supply synthetic inertia comparable to synchronous condensers, supporting system security in a coal-free grid.
Restraints Impact Analysis*
| Restraint | (~) % Impact on CAGR Forecast | Geographic Relevance | Impact Timeline |
|---|---|---|---|
| Transmission bottlenecks causing curtailment in Queensland & New South Wales REZs | −0.9% | Queensland, New South Wales REZs | Short term (≤2 years) |
| Community opposition delaying wind farms & HV interconnector routes | −0.6% | Victoria, New South Wales, Tasmania | Medium term (2-4 years) |
| Rising natural-gas feedstock prices eroding peaker competitiveness | −0.6% | National, acute in South Australia, Victoria | Short term (≤2 years) |
| Policy uncertainty around 2030 coal-exit pathways deterring capital allocation | −1.1% | National, divergent signals across states | Medium term (2-4 years) |
| Source: Mordor Intelligence | |||
Transmission Bottlenecks Causing Curtailment in Queensland & NSW REZs
New South Wales produced 66% of the National Electricity Market congestion in 2024 as 7.15 GW of generation access was granted before network upgrades, forcing curtailment during high solar output. Molong Solar Farm recorded a 53.8% curtailment rate, highlighting the mismatch between 12-18 month generation builds and 3-5 year transmission timelines. Curtailment reached 33% in NSW and 27% in Victoria during spring 2024 when mild demand collided with peak renewable production. AEMO projects that 2-4 year delays could waste 214-456 TWh of renewable energy by 2040, costing up to AUD 20 billion. HumeLink, now targeting 2028-2029 after landholder disputes, extends congestion for southern NSW projects, prompting developers to add onsite batteries to time-shift output.[4]TransGrid, “HumeLink Project Update September 2025,” transgrid.com.au
Community Opposition Delaying Wind Farms & HV Interconnector Routes
VNI West’s 190 km route through Victoria’s Western District faces organized resistance over visual and land-use impacts, extending environmental approvals by 18 months. Western Renewables Link has slipped by 6 years as councils demand underground cabling that would triple project costs under current regulatory settings. HumeLink encountered disputes with 70 landholders, forcing compulsory acquisitions and legal challenges that added 12-18 months to schedules. The Clean Energy Council introduced a voluntary developer rating scheme in 2024, yet limited enforcement constrains its ability to resolve local opposition. AER’s 2025 cost review shows community conflict now adds 25-55% to overhead line budgets, making social licence costs comparable with commodity inflation.
*Our forecasts treat driver/restraint impacts as directional, not additive. The impact forecasts reflect baseline growth, mix effects, and variable interactions.
Segment Analysis
By Power Source: Renewables Capture 58% Share as Coal Retirements Accelerate
Renewables held 58.2% of Australia's power market share in 2025 and are expanding at a 13.9% CAGR, adding 3-4 GW of solar and 1-2 GW of wind annually, while grid-scale batteries reach 4 GW under CIS awards. Solar PV dominates additions through Snowy Hydro's 1,200 MW portfolio and Lightsource bp's 400 MW Riverina project, both secured by long-term corporate PPAs. Wind growth concentrates in Neoen's 460 MW Goyder South Stage 2, CleanCo's 1,026 MW MacIntyre precinct, and the proposed 2,200 MW Star of the South offshore wind farm, which will broaden resource diversity if port bottlenecks are resolved. Hydro remains steady near 8 GW, with Snowy 2.0's 2,200 MW pumped-hydro and Tasmania's Battery of the Nation representing the few large additions. Gas peakers such as Kurri Kurri and Tallawarra B supply flexibility but face fuel prices averaging AUD 10-14/GJ in 2024-2025, lowering dispatchability economics compared with batteries charging at negative midday prices.
Long-term emission policies continue to tilt investment toward zero-carbon technologies, yet firming requirements compel hybridization. The Australian power market size allocated to batteries is forecast to rise from 5 GW in 2026 to 27 GW by 2050, while coal capacity retires in 1-2 GW chunks as Eraring, Yallourn, and Collie exit. Hybrid solar-battery complexes like EkEnergy's Silverland project are becoming standard to manage curtailment and capture frequency control revenues. Offshore wind may add up to 10 GW post-2033, diversifying the generation mix once supply chain and transmission hurdles clear. Biomass, geothermal, and tidal remain below 1% of capacity due to limited resources and higher costs. Nuclear remains prohibited, and even if policy shifts, small modular reactors would not arrive before the late 2030s.


By End User: Utilities Dominate but Residential Segment Grows Fastest
Utilities commanded 71.6% of Australia's power market size in 2025 by virtue of owning large-scale generation and retail portfolios, with AGL, Origin, and EnergyAustralia capturing 70% of residential and small business customers. Integrated generators hedge positions by adding 500-700 MW batteries at retired coal sites to protect dispatchable market share. The residential segment expands at a 10.0% CAGR as rooftop solar climbs from 25 GW in 2025 toward 87 GW by 2050, supported by 1.4 GW home batteries that participate in virtual power plants targeting 1,000 MW by 2030. Commercial and industrial users deploy behind-the-meter assets through energy-as-a-service contracts from Zen Energy and Flow Power, lowering bills by 10-15% while avoiding capex outlay.
Mining companies are now significant self-generators; Fortescue’s 2-3 GW pipeline and BHP Nickel West’s solar-battery microgrid show how on-site renewables hedge against carbon and fuel price risk. Data centers drove 526 MW of new contracted load in 2025, a figure expected to triple by 2030 if AI workload forecasts hold. Utilities respond by aggregating distributed resources into VPPs that provide frequency response and wholesale demand reduction, blending centralized and distributed assets. AEMO’s Wholesale Demand Response Mechanism, with 200 MW enrolled, lets large cold-storage and manufacturing plants monetize flexibility in place of generation, reinforcing end-use diversification.
Geography Analysis
New South Wales hosts the largest slice of Australia's power market size at 35% in 2025 on the back of its legacy coal fleet and 7.15 GW renewable access rights, yet faces the highest curtailment until HumeLink and VNI West enter service. Victoria follows with a 24% share, leveraging abundant onshore wind and the planned 2,200 MW Star of the South offshore project that could supply 9% of the National Electricity Market generation by 2050 once built. Queensland commands 23% capacity and leads rooftop solar uptake, while the CopperString 2.0 transmission line connecting North Queensland resources to the NEM unlocks additional utility-scale solar and wind.
South Australia exemplifies high renewable penetration, sourcing 70% daytime demand from rooftop solar in 2024 and registering negative prices in 40% of spring midday intervals, encouraging 4-hour batteries and synchronous condensers to stabilize frequency. Western Australia operates an isolated grid where Synergy's coal retirement schedule and Neoen's 900 MW Collie Battery set a roadmap for rapid decarbonization. Tasmania, already hydro-dominant, positions as a battery of the nation through the Marinus Link and new pumped-hydro arrays, exporting firmed renewable power to mainland states.
Regional renewable energy zones concentrate investment: Central-West Orana in NSW, Darling Downs in Queensland, and Murray River in Victoria each award multi-GW access. However, transmission lags by 2-4 years, causing curtailment until super-grid corridors reach commissioning. Offshore wind areas off Gippsland and the Hunter are in feasibility, promising geographic diversification away from inland congestion. Overall, geographic decarbonization advances unevenly, with eastern states aligned on targets while Western Australia independently tackles firming challenges through large batteries and synchronous condensers.
Regulatory Landscape
Australia's electricity market governance is led by the Australian Energy Market Commission (AEMC) as the rule maker for the National Electricity Rules and by the Australian Energy Regulator (AER) as the economic regulator for networks and market compliance, with AEMO providing system planning and operational functions for the NEM. In June 2026, the AEMC initiated the Electricity Network Regulation Review to assess how future regulatory frameworks for network service providers can better fit a system with accelerating renewable connections, higher congestion, and rising community and delivery costs for transmission corridors.
Reliability and system security settings are being revised as the transition progresses. The Reliability Panel's 2026 Reliability Standard and Settings Review recommended a reliability standard of 0.003% expected unserved energy for 2028-2032, aligning market settings with tighter reliability management as coal units retire and firming requirements increase. At the state level, the AER published a draft guideline in April 2026 for South Australia's Firm Energy Reliability Mechanism (FERM) scheme regulator role, pointing to greater reliance on structured reliability mechanisms as intermittent supply grows and price volatility increases.
Competitive Landscape
The top three generators control roughly 60% of generation capacity and 70% of retail customers, placing Australia's power market concentration at a moderate level. Merchant renewable developers such as Neoen and Lightsource bp erode incumbent shares by signing long-term PPAs before construction, insulating returns from wholesale volatility. State-owned entities, including CleanCo Queensland and Snowy Hydro, expand renewable portfolios guided by policy rather than quarterly profit goals.
Strategic repositioning is evident. AGL retired Liddell coal in 2023 and installed a 500 MW battery on the site to arbitrage negative midday and positive evening prices. Origin’s AUD 18.7 billion acquisition by Brookfield aligns global infrastructure capital with a multi-decade transition, enabling accelerated battery investments outside public-market constraints. EnergyAustralia commissioned the 316 MW Tallawarra B hydrogen-ready peaker, demonstrating flexible backup while planning the 350 MW Wooreen battery to balance rising renewables.
Disruptors adopt asset-light models. Zen Energy bundles rooftop solar, batteries, and demand-response software for commercial customers, keeping capex off balance sheets and adding grid-service revenue. Flow Power enables real-time wholesale pass-through pricing matched with behind-the-meter assets, delivering 10-15% savings. White-space opportunities center on long-duration storage beyond 8 hours, offshore wind, and VPP aggregation. Investors eye 8-12 hour iron-flow and pumped-hydro projects to address multi-day calm periods that 4-hour lithium batteries cannot firm.
Australia Power Industry Leaders
AGL Energy Ltd.
Origin Energy Ltd.
EnergyAustralia Holdings
Snowy Hydro Ltd.
Alinta Energy Pty Ltd.
- *Disclaimer: Major Players sorted in no particular order

Market Opportunities and Future Outlook
Federal and market operator roadmaps are translating into bankable programs and large project pipelines, creating whitespace across dispatchable capacity, transmission-enabling assets, and hybridization at the project level. AEMO's final 2026 Integrated System Plan (published June 2026) lays out a 25-year development pathway with a total system roadmap cost of AUD 106 billion and highlights the transmission and firming needed to integrate renewable energy zones. Through the Capacity Investment Scheme, the Australian Government issued CIS Tender 10 guidelines (June 2026), targeting 4 GW and 16 GWh for the NEM, which supports grid-scale batteries and other firming technologies that can monetize intraday volatility and reduce renewable curtailment exposure.
Project execution is also showing where near-term investable work is concentrated, particularly co-located solar plus storage and the permitting required for new REZ-linked capacity. In May 2026, Edify Energy reached financial close for Smoky Creek and Guthrie's Gap in Central Queensland, combining 720 MWp of solar with 600 MW and 2,400 MWh of battery storage, reflecting how developers are building hybrid plants to shape output and capture dispatchable revenues. In July 2026, Spark Renewables received federal approval under the EPBC Act for the Dinawan solar and battery project in southwest New South Wales, reinforcing the development pipeline in congested regions where adding storage and securing approvals helps manage connection risk and curtailment. On flexible thermal supply, the Federal Government's AUD 35.5 million commitment (May 2026) to implement a Domestic Gas Reservation Mechanism from 1 July 2027 supports planning for gas as a complement to storage and demand response during system stress.
Recent Industry Developments
- July 2026: EnergyAustralia reported that the Orana Battery Energy Storage System (BESS) reached commercial operation. Bringing another grid-scale battery online supports firming capability during periods of negative daytime pricing and higher evening peaks, while strengthening the role of dispatchable storage alongside accelerated coal retirements.
- June 2026: Origin Energy announced a partnership with Landis+Gyr to deploy IoT modules across its gas metering network to enable remote readings and near real-time data insights. The rollout improves operational efficiency and data quality for retail and network processes, supporting more responsive customer energy services as electrification and distributed resources increase system complexity.
- December 2025: Samsung C&T and Australia's DT Infrastructure secured a contract worth about USD 635.7 million to construct high-voltage power transmission facilities in Australia. Large transmission packages help unlock renewable energy zones and reduce congestion-driven curtailment, directly influencing the pace at which new solar, wind, and storage capacity can connect to the grid.


Research Methodology Framework and Report Scope
Market Definition and Coverage
For this study, the Australia power market is defined as the total grid-connected electricity generation installed capacity operating in Australia, expressed in gigawatts, across all major generation sources.
Scope exclusions: We exclude stand-alone generators that supply isolated sites and do not export electricity to the public grid.
Segmentation Overview
- By Power Source
- Thermal (Coal, Natural Gas, Oil and Diesel)
- Nuclear
- Renewables (Solar, Wind, Hydro, Geothermal, Biomass & Waste, Tidal)
- By End User
- Utilities
- Commercial and Industrial
- Residential
- By T&D Voltage Level (Qualitative Analysis only)
- High-Voltage Transmission (Above 230 kV)
- Sub-Transmission (69 to 161 kV)
- Medium-Voltage Distribution (13.2 to 34.5 kV)
- Low-Voltage Distribution (Up to 1 kV)
Data Sources, Market Sizing, and Validation
Desk Research
Desk research started with the most consistent public time series, since capacity is best understood through plant registers and official reporting. We reviewed sources such as the Australian Energy Statistics (Department of Climate Change, Energy, the Environment and Water), AEMO publications, Clean Energy Regulator reporting, the Australian Energy Regulator market data, and the Australian Bureau of Statistics for macro context that affects demand planning.
To make the data usable in a single model, definitions were aligned across sources, and plant additions and retirements were checked year by year to avoid double counting. We also used company filings and investor presentations to confirm commissioning dates, unit ratings, and closure schedules for large assets, since these items are usually where the total changes fastest. In a few cases, paid database subscriptions for company financials and intelligence and patent databases were used to speed up cross-checks on ownership changes and technology trends. The desk research sources listed here are illustrative only, and many other public references were also used for data collection, validation, and clarification.
Primary Interviews and Surveys
Primary interviews focused on validating what the desk numbers do not fully explain, such as timing of grid connection, practical derates, and the probability of announced projects reaching commissioning. We spoke with a mix of developers, utilities, EPC and services participants, and large power buyers, and the discussions were used to confirm retirement assumptions, project slippage, and technology-specific capacity factor expectations that shape the forward view.
Distribution of primary research fieldwork respondents
| Company type | Respondent position |
|---|---|
| Top tier: 37% | CXOs: 17% |
| Mid tier: 45% | Functional/Unit leaders: 40% |
| Smaller Players: 18% | Managers: 43% |
Market-Sizing & Forecasting
The sizing starts with a top-down reconstruction of Australia's installed capacity by compiling the operating fleet, then layering in expected additions and planned retirements by year, which are reconciled to official system and market publications. To keep the model practical, we used a small set of repeatable inputs, such as annual commissioned capacity (GW), announced and committed project pipelines, known coal and gas closure schedules, grid connection and curtailment constraints that delay effective entry, and policy-led signals that impact build rates (for example renewable targets and connection reforms).
After the main build is complete, we corroborate totals using selective bottom-up approximations, including sampled project-level roll-ups in key states and sanity checks using typical unit sizes and observed build cadence. Where project data is incomplete, gaps are handled by applying probability weights by project maturity and by using conservative commissioning lags discussed in interviews, then rechecking against historical completion rates. For forecasting, we used scenario analysis alongside a time-series check, because build-outs can shift when closures accelerate or when connection queues tighten, and expert feedback was used to set realistic downside and upside cases.
Data Validation & Update Cycle
Validation is done in layers so that obvious errors are caught early and small definition issues do not carry into the forecast. Outputs are checked against independent signals such as official capacity tables, reported commissioning and retirement announcements, and the implied year-over-year change in the fleet, then exceptions are reviewed in a second analyst pass before sign-off.
If a large asset announcement, a major retirement change, or a policy decision materially shifts the expected build or closure path, we re-contact relevant respondents and refresh the assumptions. Reports are refreshed annually, and interim updates are made when material events occur. Before delivery, an analyst performs a final review so clients receive the latest updated view.
Mordor Intelligence's Australia Power Market Size Measured Against Other Published Estimates
Published market numbers for the Australia power market often differ because they do not always measure the same thing, even when the title looks similar. In practice, some figures describe installed capacity, others describe electricity generation, and others reflect revenue from electricity sales, so the units and the scope boundary can shift the result a lot.
Evidence like official installed-capacity registries, plant-level commissioning and retirement logs, and grid-connection status checks are what tie Mordor Intelligence's estimate to the real operating fleet in gigawatts, rather than to revenue or energy output.
Benchmark comparison
| Source | Market Size | Gaps in Research Methodology |
|---|---|---|
| Mordor Intelligence | USD 128.58 B (2025) | |
| Industry Publisher A | USD 41.60 B (2024) | This figure is value-based and reflects revenue or market value in USD, which can move with tariff settings and fuel prices, so it is not comparable to a capacity (GW) definition. |
| Industry Publisher B | USD 15.26 B (2023) | This estimate also uses USD value, and the implied scope can differ based on what is counted as power market revenue, which tends to understate capacity growth when prices are stable or regulated. |
The spread in the table mainly comes from mixing three different measurement choices, capacity in GW versus market value in USD and, in some cases, generation output. By keeping the market boundary tied to grid-connected installed capacity and by checking changes against commissioning and retirement events, the final sizing stays traceable to clear physical additions and removals that can be repeated and reviewed.


Key Questions Answered in the Report
How large is the Australia power market in 2026and what growth is expected by 2031?
How large is the Australia power market in 2026 and what growth is expected by 2031?
What share of generation does rooftop solar supply at midday in South Australia?
Rooftop systems met 70% of state demand during spring 2024 midday intervals.
Which storage technology fills multi-day firming gaps beyond 2030?
Pumped hydro such as the 2,200 MW Snowy 2.0 project offers 175 hours of discharge, surpassing 4 hour battery limits.
Why are corporate PPAs priced below wholesale averages?
Miners and data-centers lock in 15-20 year contracts, trading volume risk for AUD 10-20/MWh price discounts.
What is the outlook for coal capacity in Australia after 2029?
Major plants Eraring, Yallourn and Collie are scheduled to retire, reducing coal capacity by 1-2 GW each year.
How fast is utility-scale solar capacity expanding in the Australia power market?
Solar additions average 3-4 GW each year to 2031, driven by corporate PPAs and LRET incentives.
Page last updated on:


 Your data is secure and never sold or shared.


