
Market Overview
| Study Period | 2021 - 2031 |
|---|---|
| Forecast Data Period | 2026 - 2031 |
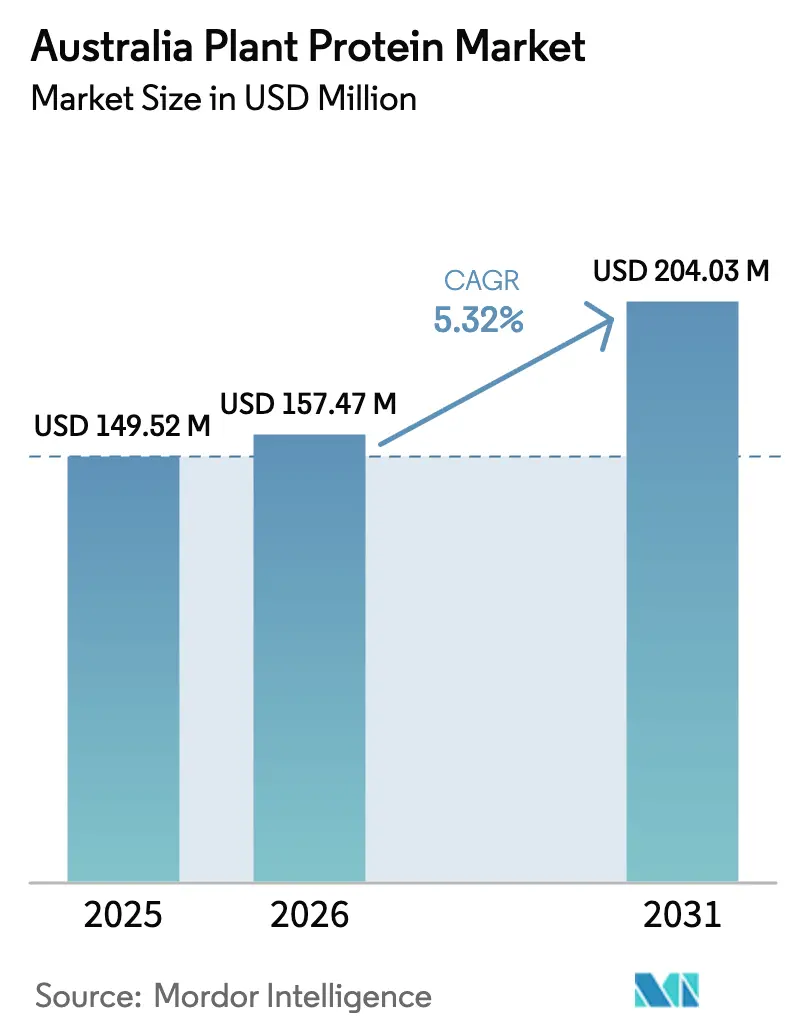
| Base Year Market Size (2025) | USD 149.52 Million |
| Market Size (2026) | USD 157.47 Million |
| Market Size (2031) | USD 204.03 Million |
| Growth Rate (2026 - 2031) | 5.32 % |
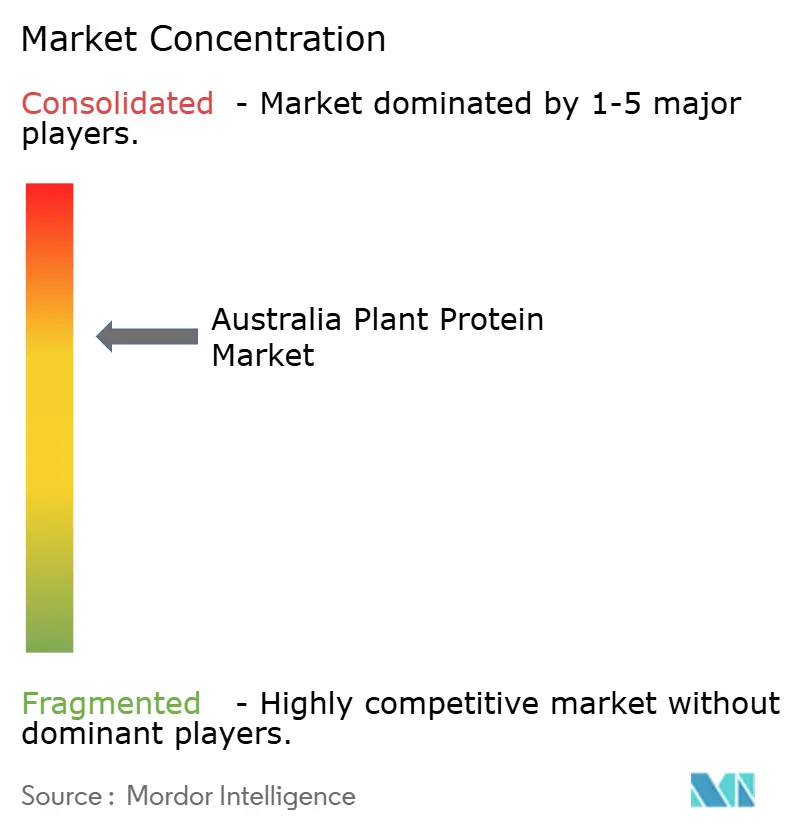
| Market Concentration | Medium |
Major Players *Disclaimer: Major Players sorted in no particular order Image © Mordor Intelligence. Reuse requires attribution under CC BY 4.0. | |
Australia Plant Protein Market Analysis by Mordor Intelligence
Australia plant protein market size in 2026 is estimated at USD 157.47 million, growing from 2025 value of USD 149.52 million with 2031 projections showing USD 204.03 million, growing at 5.32% CAGR over 2026-2031. This trajectory reflects a structural shift in food systems as manufacturers pivot toward ingredients that satisfy both flexitarian consumers and industrial buyers seeking cost-predictable alternatives to animal-derived proteins. Growth rests on three pillars: rising flexitarian consumption, corporate decarbonization targets that favor low-emission ingredients, and continuous processing upgrades that trim extraction costs. Soy continues to anchor supply chains, but allergen-free alternatives such as pea, rice, and faba bean are chipping away at incumbent volumes as beverage and bakery formulators seek neutral flavor profiles. Steady adoption in ready-to-drink (RTD) beverages and fortified bakery products is widening the plant protein market’s end-user base, while patent activity in enzymatic hydrolysis and membrane filtration signals an industry race to push production costs below the USD 4/kg parity line with commodity whey. Competitive dynamics feature vertically integrated oilseed processors extending downstream, precision-fermentation startups chasing functional parity with dairy, and flavor specialists masking legume off-notes to unlock mainstream shelf space.
Key Report Takeaways
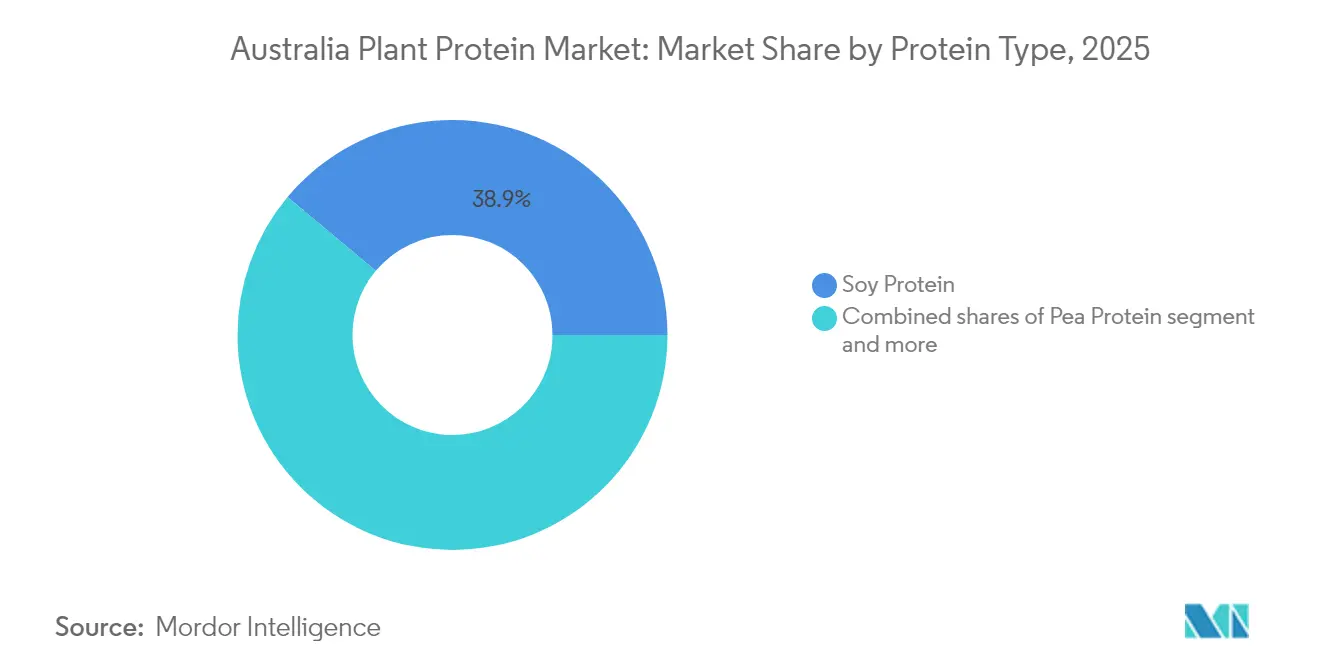
- By protein type, soy maintained the lead with 38.92% plant protein market share in 2025, whereas pea protein is advancing at a 5.97% CAGR to 2031.
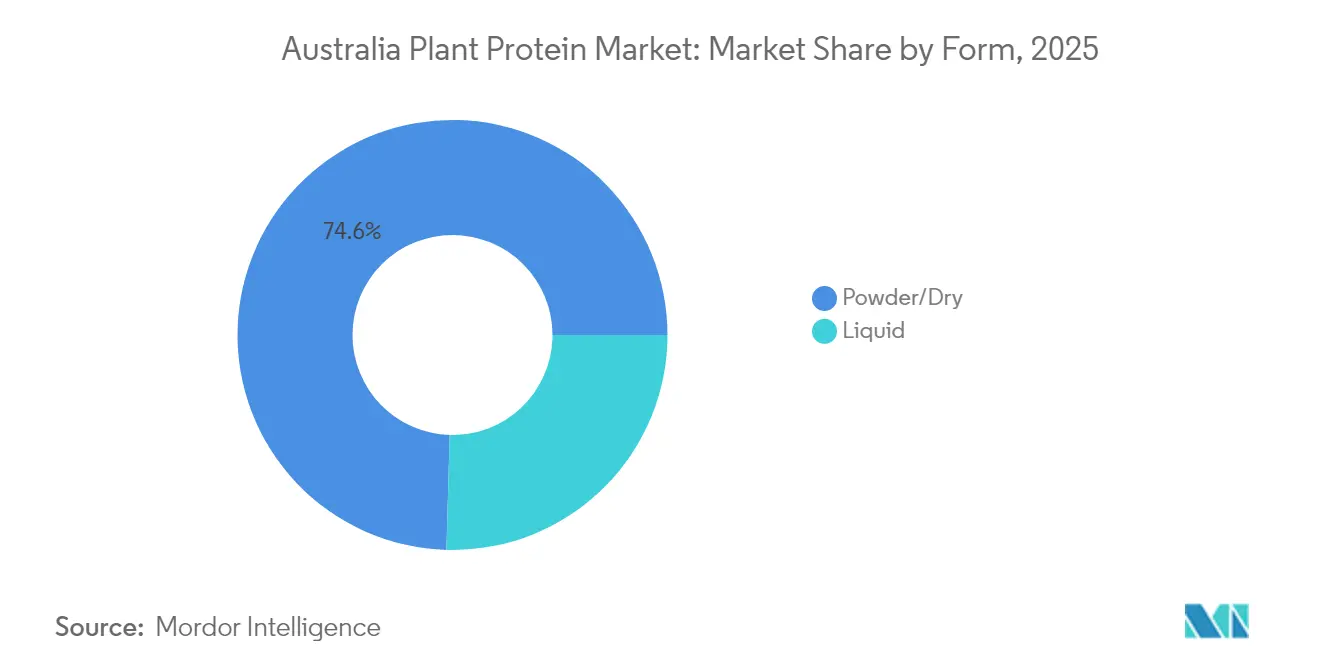
- By form, powders accounted for 74.55% of the plant protein market size in 2025, while liquid concentrates are expanding at a 6.61% CAGR through 2031.
- By end user, supplements logged the fastest growth, advancing at a 7.05% CAGR between 2026 and 2031, even as food and beverages controlled 66.84% revenue in 2025.
Note: Market size and forecast figures in this report are generated using Mordor Intelligence’s proprietary estimation framework, updated with the latest available data and insights as of 2026.
Australia Plant Protein Market Trends and Insights
Drivers Impact Analysis*
| Driver | (~) % Impact on CAGR Forecast | Geographic Relevance | Impact Timeline |
|---|---|---|---|
| Growing shift to plant-based and flexitarian diets | +1.2% | Sydney, Melbourne, Brisbane metro markets | Medium term (2–4 years) |
| Environmental sustainability and lower carbon footprint | +0.9% | National, the strongest retailer pressure in New South Wales and Victoria | Long term (≥ 4 years) |
| Advances in extraction and processing technology are improving the quality | +0.8% | Manufacturing hubs in Queensland and Victoria | Short term (≤ 2 years) |
| Growing plant-protein use in bakery, beverage, and snack lines | +1.0% | Major supermarket and food-service channels nationwide | Medium term (2–4 years) |
| Expansion of clean-label and non-GMO consumer preferences | +0.7% | Health-oriented grocery and e-commerce platforms across Australia | Medium term (2–4 years) |
| Rising adoption of supplements and sports nutrition | +0.6% | Urban fitness centers and online sports-nutrition retailers | Short term (≤ 2 years) |
| Source: Mordor Intelligence | |||
Growing Shift to Plant-Based and Flexitarian Diets
Flexitarian eating patterns, defined by occasional meat consumption rather than strict veganism, now account for roughly 30% of consumers in the United States and United Kingdom, creating sustained demand for hybrid products that blend plant and animal proteins. This cohort prioritizes convenience and taste over ideological purity, which explains why plant-protein penetration in frozen meals and ready-to-eat snacks outpaces that in dedicated meat-analog SKUs. Food manufacturers respond by reformulating existing lines to incorporate 20% to 40% plant protein, reducing ingredient costs while satisfying label claims that resonate with health-conscious buyers. The trend also benefits from institutional adoption: school-lunch programs in California and corporate cafeterias across Europe now mandate plant-forward menus, locking in multi-year purchase agreements that stabilize processor revenues. Regulatory tailwinds include updated USDA dietary guidelines that elevate plant proteins to parity with animal sources in recommended daily intake, a shift that legitimizes their use in federally funded nutrition programs[1].
Environmental Sustainability and Lower Carbon Footprint
Life-cycle assessments published by the EPA and peer-reviewed journals consistently show that pea and soy protein production generates 70% to 85% fewer greenhouse-gas emissions per kilogram than beef or dairy protein, a gap that widens when accounting for methane from ruminant digestion[2]. Corporate sustainability officers leverage these figures to meet Scope 3 emissions targets, particularly in Europe, where carbon border-adjustment mechanisms penalize high-footprint ingredients. Unilever and Nestlé disclosed in their 2024 annual reports that substituting 10% of dairy protein with plant alternatives reduced their product carbon footprints by an average of 12%, translating to quantifiable progress toward net-zero commitments. Beyond emissions, water-use efficiency favors plant proteins: producing 1 kilogram of pea isolate requires approximately 1,800 liters of water, compared to 15,000 liters for whey protein, a critical advantage in drought-prone regions like the U.S. Southwest and Mediterranean basin. This resource calculus drives ingredient buyers to dual-source animal and plant proteins, hedging against water-scarcity premiums that could inflate dairy costs by 20% to 30% over the forecast period.
Advances in Extraction and Processing Technology Improving Quality
Enzymatic hydrolysis and membrane-filtration techniques introduced in 2024 enable processors to isolate protein fractions with purities exceeding 90% while minimizing off-flavors traditionally associated with legumes. DSM-Firmenich's patent filing for a multi-enzyme cascade that cleaves phenolic compounds during extraction demonstrates how targeted biochemistry can eliminate bitterness without thermal denaturation, preserving functional properties such as emulsification and foaming. These innovations compress production timelines and reduce solvent use, lowering processing costs by an estimated 15% to 20% relative to legacy alkaline-extraction methods. Simultaneously, extrusion technology has evolved to produce texturized vegetable protein with fibrous structures that mimic whole-muscle meat, expanding applications beyond ground-meat analogs into deli slices and seafood substitutes. Ingredion's 2024 investor deck highlighted a new twin-screw extruder configuration that achieves moisture retention comparable to chicken breast, a breakthrough that attracted co-development contracts with major quick-service restaurant chains. Regulatory bodies such as the FDA have begun updating Generally Recognized as Safe (GRAS) notices to accommodate novel enzymes, accelerating commercialization cycles for next-generation isolates.
Expansion of Clean-Label and Non-GMO Consumer Preferences
Clean-label formulations, those free from synthetic additives, artificial flavors, and genetically modified organisms, command price premiums of 15% to 25% in North American and European retail channels, incentivizing ingredient suppliers to pursue non-GMO certification and organic crop sourcing. The non-GMO Project verified over 4,200 plant-protein products in 2024, an increase from the prior year, reflecting brand owners' calculus that certification unlocks shelf space in natural-foods retailers and e-commerce platforms targeting millennial and Gen-Z shoppers. This preference intersects with allergen-avoidance trends: pea and rice proteins are inherently gluten-free and hypoallergenic, positioning them as default choices for manufacturers reformulating to meet the FDA's voluntary allergen-labeling guidelines. Kerry Group's 2024 sustainability report noted that 60% of its new plant-protein launches carried both organic and non-GMO seals, a strategic response to buyer specifications from Whole Foods and Trader Joe's. Compliance costs, including identity-preserved supply chains and third-party audits, add USD 0.30 to USD 0.50 per kilogram, yet the resulting margin uplift justifies the investment for brands competing in premium tiers where ingredient transparency drives purchase intent.
Restraints Impact Analysis*
| Restraint | (~) % Impact on CAGR Forecast | Geographic Relevance | Impact Timeline |
|---|---|---|---|
| Higher production and processing costs versus animal proteins | –0.8% | National, with sharper effects in price-sensitive regional chains | Short term (≤ 2 years) |
| Sensory limitations: taste, texture, and off-flavors are common | –0.6% | Mass-market bakery and dairy-analog categories | Medium term (2–4 years) |
| Supply-chain volatility and raw-material availability issues | –0.5% | Pulse-growing belts in Western Australia, South Australia, Victoria | Short term (≤ 2 years) |
| Regulatory and labeling complexity across regions | –0.4% | State-to-state variation and FSANZ compliance | Long term (≥ 4 years) |
| Source: Mordor Intelligence | |||
Higher Production and Processing Costs Versus Animal Proteins
Plant-protein isolates currently cost USD 4.50 to USD 6.00 per kilogram at commercial scale, compared to USD 3.00 to USD 4.00 for whey protein concentrate, a gap that narrows margins for food manufacturers operating in price-competitive categories such as private-label nutrition bars and institutional foodservice. This premium stems from lower crop yields per hectare for specialty legumes like yellow peas, averaging 2.5 metric tons per hectare versus 8 metric tons for soybeans, and the energy-intensive drying and milling steps required to achieve food-grade purity. ADM's 2024 10-K filing disclosed that its plant-protein segment operated at gross margins 400 basis points below its animal-nutrition division, attributing the shortfall to underutilized extraction capacity and volatile natural-gas prices that inflate spray-drying costs [3]. Smaller processors face steeper hurdles: capital expenditures for a 10,000-metric-ton-per-year pea-protein line exceed USD 25 million, deterring new entrants and concentrating production among vertically integrated agribusinesses. Cost parity hinges on yield improvements through plant breeding and adoption of dry-fractionation methods that bypass wet extraction, technologies still in pilot phases as of 2025.
Sensory Limitations: Taste, Texture, Off-Flavors Common
Beany, grassy, and bitter notes inherent to legume proteins persist despite advances in deodorization, limiting their use in applications where flavor neutrality is non-negotiable, such as vanilla-flavored protein shakes and white-sauce pasta dishes. Sensory panels conducted by Kerry Group in 2024 found that untreated pea-protein isolates scored 4.2 out of 10 for acceptability in dairy-analog beverages, compared to 7.8 for whey protein, a gap that necessitates masking agents or flavor encapsulation, both of which add cost and compromise clean-label positioning. Texture challenges are equally pronounced: plant proteins lack the casein micelles that deliver creaminess in yogurt and cheese, forcing formulators to incorporate hydrocolloids or modified starches that dilute protein content and trigger additional ingredient disclosures. The FDA's forthcoming guidance on protein quality scores, expected to favor animal proteins with complete amino-acid profiles, may further constrain label claims for plant-based products, dampening consumer trial rates in mainstream channels. Overcoming these barriers requires continued investment in enzymatic modification and fermentation-derived flavor precursors, areas where patent activity surged 18% in 2024 but commercial rollouts remain 2 to 3 years away.
*Our forecasts treat driver/restraint impacts as directional, not additive. The impact forecasts reflect baseline growth, mix effects, and variable interactions.
Segment Analysis
By Protein Type: Pea Gains as Soy Holds Majority
Soy protein captured 38.92% of the market in 2025, underpinned by decades of supply-chain infrastructure and its status as a complete protein with a PDCAAS, making it the default choice for infant formula and clinical nutrition products where amino-acid adequacy is regulated. Pea protein, however, is expanding at 5.97% annually through 2031, driven by allergen-free positioning and neutral flavor profiles that suit bakery and beverage applications better than soy's residual beany notes. Ingredion's 2024 investor presentation highlighted year-over-year increase in pea-protein sales to European plant-based-meat manufacturers, who value its ability to bind water and fat without triggering soy-allergen labeling. Rice protein serves niche hypoallergenic segments, particularly in baby food and sports nutrition for consumers avoiding legumes, while potato protein is gaining traction in clean-label snacks due to its bland taste and high lysine content that complements grain-based formulations. Hemp protein remains subscale, constrained by regulatory uncertainty in markets like Japan and South Korea where THC-residue limits are stringent, though its omega-3 fatty-acid content appeals to functional-food developers targeting cardiovascular health claims F. Wheat protein, predominantly gluten, is largely excluded from plant-protein tallies due to its distinct functional role as a dough strengthener rather than a nutritional isolate, yet it retains relevance in meat analogs where gluten's viscoelastic properties replicate muscle fiber.
Emerging innovations include faba-bean protein, which ADM began commercializing in 2024 after securing non-GMO seed contracts with Canadian growers; faba offers higher yields per hectare than peas and a milder flavor, positioning it as a cost-competitive alternative in high-volume applications like extruded snacks. Patent filings for blended-protein systems, combining pea, rice, and chickpea isolates to achieve amino-acid profiles equivalent to whey, reflecting industry recognition that no single plant source satisfies all functional and nutritional requirements. Regulatory tailwinds include the USDA's 2024 update to the National Organic Program, which streamlined certification pathways for organic pea and hemp proteins, reducing compliance timelines from 18 months to 12 months and encouraging acreage expansion in Montana and North Dakota. These dynamics suggest that while soy will retain its plurality through 2031, its share will erode as diversified sourcing strategies mitigate allergen and sustainability concerns.

By Form: Liquid Concentrates Outpace Powder Despite Lower Base
Powder and dry forms held 74.55% of the market in 2025, reflecting their logistical advantages, lower shipping costs, ambient storage, and compatibility with existing blending equipment in bakeries and supplement manufacturers. Yet liquid concentrates are projected to grow at 6.61% annually, outstripping powder's rate, as ready-to-drink beverage brands prioritize pre-dispersed proteins that eliminate clumping and sedimentation issues plaguing shelf-stable shakes. Kerry Group's 2024 product launch of a pea-protein liquid concentrate targeted cold-chain distributors serving coffee shops and smoothie bars, where on-site reconstitution is impractical, and flavor consistency is paramount. Liquid formats also enable enzyme pre-treatment and pH adjustment during manufacturing, delivering superior solubility and mouthfeel that justify their 20% to 30% price premium over powders. Dairy-alternative producers, particularly those formulating barista-grade oat and almond milks, increasingly specify liquid protein concentrates to achieve the microfoam stability required for latte art, a sensory cue that drives repeat purchase in premium café channels.
The powder segment benefits from ongoing innovations in instantization, surface treatments that improve wettability, and reduce clumping when mixed with cold liquids. DSM-Firmenich's 2024 patent for a lecithin-coated pea-protein powder demonstrated 40% faster dispersion rates than conventional isolates, addressing a key pain point for single-serve protein-shake sachets sold in convenience stores. Regulatory factors also play a role: the FDA's proposed updates to nutrition-facts labeling, which would require separate disclosure of added sugars in flavored protein powders, may shift consumer preference toward unflavored concentrates that buyers can customize at home, a trend that favors bulk-powder formats. Conversely, liquid concentrates face cold-chain infrastructure gaps in emerging markets, limiting their penetration in APAC and Latin America, where ambient-stable powders dominate institutional and retail channels. This bifurcation implies that liquid growth will concentrate in developed markets with robust refrigerated logistics, while powders retain dominance in price-sensitive and infrastructure-constrained geographies.
By End User: Supplements Surge as Food and Beverages Mature
Food and beverage applications commanded 66.84% of the market in 2025, spanning bakery goods, plant-based meats, dairy alternatives, and snack bars, where protein fortification addresses consumer demand for satiety and clean-label nutrition. Within this segment, meat and poultry alternatives are the fastest-growing subsegment, with brands like Beyond Meat and Impossible Foods relying on pea and soy isolates to achieve the 20-gram-per-serving protein content that matches conventional beef patties. Bakery applications leverage rice and potato proteins to boost the nutritional profile of gluten-free breads and muffins without compromising crumb structure, a formulation challenge that ADM addressed through its 2024 launch of a pre-gelatinized potato-protein blend optimized for high-hydration doughs. Beverage applications, particularly ready-to-drink protein shakes and plant-based milks, prioritize neutral-flavor isolates and liquid concentrates that maintain homogeneity during shelf life, driving specification of enzymatically treated pea and rice proteins.
Supplements are expanding at 7.05% annually, the fastest rate among end-user segments, propelled by sports nutrition, infant formula, and elderly medical foods that require amino-acid completeness and digestibility scores comparable to whey. The sports-nutrition subsegment benefits from clean-label trends among millennial and Gen-Z athletes who perceive plant proteins as more sustainable and less processed than whey concentrates, despite lower leucine content that necessitates higher serving sizes to trigger muscle-protein synthesis. Personal care and cosmetics applications, though smaller in volume, are growing as formulators incorporate hydrolyzed plant proteins into shampoos, conditioners, and anti-aging creams for their film-forming and moisturizing properties. L'Oréal's 2024 patent for a rice-protein peptide complex targeting hair-strand repair illustrates how ingredient suppliers are diversifying revenue streams beyond food, leveraging the same extraction assets to serve beauty brands willing to pay USD 15 to USD 20 per kilogram for cosmetic-grade isolates. Animal feed remains a stable but low-margin outlet, with soy protein concentrates used in aquaculture and pet food to replace fishmeal, a shift driven by overfishing concerns and the aquaculture industry's push to reduce reliance on wild-caught inputs.
Regulatory Landscape
Plant protein ingredients and their food uses in Australia are governed primarily through Food Standards Australia New Zealand (FSANZ) and the Australia New Zealand Food Standards Code, including novel food and processing-aid pathways that require pre-market assessment and permissions where applicable. Novel foods and ingredients are assessed and listed (including via Schedule 25 permissions), and a relevant example is FSANZ Application A1279 (May 2025), which permitted a fermented preparation of Lentinula edodes mycelia as a processing aid for pea and rice protein, supporting wider use of enzyme- and fermentation-enabled processing approaches.
Labeling and claims also affect commercialization, with Commonwealth-level activity addressing plant-based and alternative product labeling through a DAFF-led working group funded in the 2024-25 Budget (AUD 1.5 million). Suppliers and brand owners still need to manage claim substantiation and compositional compliance, especially when ingredients support differentiated front-of-pack positioning for soy and other plant proteins.
Value Chain Analysis
The Australian plant protein value chain runs from upstream crop production (soybeans and pulses such as faba beans, peas, lentils, and mung beans) through primary handling and storage, ingredient processing (milling, fractionation, and wet or dry extraction), and downstream formulation (bakery, RTD beverages, snacks, meat alternatives, and supplements), before ending in distribution via food manufacturers, foodservice, and retail channels. Scale advantages cluster among large ingredient houses and vertically integrated operators, while formulation specialists provide masking, texture, and functionality systems that help processors manage off-flavor and application constraints.
Recent events point to how ownership, local processing capability, and regional manufacturing footprint influence resilience and lead times. Australian Plant Proteins returned to operations in May 2025 under new ownership by My Co after insolvency in 2024, reinforcing the role of capital backing and customer requalification in ingredient supply. In February 2026, Plenty Foods opened a defatted nut powder facility in Kingaroy, Queensland (AUD 20 million), adding domestic capacity for high-protein powders from locally sourced inputs, while collaborations such as the CSIRO, GrainCorp, and v2food initiative show how stakeholders are building local processing and manufacturing know-how to reduce reliance on imported ingredients.
Competitive Landscape
The plant-protein market exhibits a moderate concentration score, indicating that a handful of vertically integrated agribusiaries and specialty-ingredient houses control most of the production capacity and distribution networks. ADM, Ingredion, and Cargill leverage their oilseed-crushing and grain-milling operations to produce soy and pea proteins at scale, achieving cost advantages through shared infrastructure and procurement leverage that smaller pure-play processors cannot match.
Flavor and fragrance incumbents, DSM-Firmenich, Kerry, IFF, and Givaudan, compete on formulation expertise, offering turnkey protein systems that blend isolates with enzymes, emulsifiers, and flavor masking agents to meet customer specifications for taste, texture, and label claims. This dual-track competition creates white space for fermentation-based disruptors such as Perfect Day and Motif FoodWorks, which bypass crop inputs entirely by programming microbes to produce casein and myoglobin analogs, respectively, sidestepping allergen and sustainability concerns tied to agriculture. Strategic patterns reveal a bifurcation: established players pursue incremental innovation, enzyme optimization, extrusion refinements, and non-GMO sourcing, to defend existing customer relationships, while venture-backed startups target step-change technologies that promise cost or performance breakthroughs. Kerry Group's 2024 acquisition of a Canadian pea-protein fractionation facility exemplifies the former, securing supply-chain control to serve long-term contracts with North American food manufacturers.
Conversely, BASF's minority investment in a mycoprotein startup signals interest in fungal-based proteins that offer faster production cycles and lower water use than legume crops, hedging against climate volatility that threatens traditional sourcing regions. Regulatory complexity favors incumbents with the compliance infrastructure to navigate the EU's novel-food dossier process and the FDA's GRAS notification system, both of which require toxicology studies and allergenicity assessments that can cost USD 500,000 to USD 1 million per ingredient. This barrier to entry concentrates innovation among firms with dedicated regulatory-affairs teams, slowing market access for smaller innovators and reinforcing the oligopolistic structure that characterizes the sector.
Australia Plant Protein Industry Leaders
-
International Flavors & Fragrances Inc.
-
DSM-Firmenich AG
-
Givaudan SA
-
Symrise AG
-
Kerry Group plc
- *Disclaimer: Major Players sorted in no particular order
Market Opportunities and Future Outlook
A central opportunity is scaling domestic ingredient processing and widening the feedstock base beyond soy to pulses and other allergen-friendly crops. This can reduce exposure to imported isolates and improve lead times for Australian food and beverage manufacturers. CSIRO has described the domestic plant protein sector as a multi-billion-dollar opportunity by 2030, and active programs to strengthen processing capability, including CSIRO collaborations with GrainCorp and v2food, create a practical route for ingredient suppliers to develop locally tailored protein fractions for RTD beverages, fortified bakery, and supplement applications.
Manufacturing location strategy and regional capacity additions also create room for new entrants and expansions that integrate sourcing, processing, and application support. Regional New South Wales has been promoted for plant-based protein manufacturing sites with overnight access to 81% of the Australian consumer base, which supports distribution efficiency for both powder and chilled liquid formats. On the supply side, domestic assets such as the Plenty Foods Kingaroy facility show ongoing investment in value-added, high-protein powder production from local inputs, while the restart of Australian Plant Proteins under new ownership underscores the commercial value of stable, solvent-free fractionation capability for faba bean and pea isolates.
Recent Industry Developments
- April 2026: Australian Plant Proteins launched Nothing Else, a direct-to-consumer brand for faba bean and yellow pea protein isolates. The initiative extends consumer access to plant-based protein formats and expands brand reach in the AU plant-protein space. This strengthens downstream control over the value chain and reinforces the company’s direct-to-consumer capabilities.
- April 2026: DSM-Firmenich launched Vertis Textured Vegetable Proteins (TVPs) with integrated ModulaSense taste modulation technology. The product introduces a next-generation textured plant-protein system aimed at meats applications. The offering differentiates DSM-Firmenich and supports flavor masking in plant-based formulations, helping improve relevance for customer applications.
- March 2026: IFF (International Flavors & Fragrances Inc.) secured FSANZ heart health claim for isolated soy protein in Australia and New Zealand. The claim enables expanded marketing opportunities for soy protein in the region. This provides an advantage for soy protein-based products and broader claims in AU/NZ markets.
Research Methodology Framework and Report Scope
Market Definition and Coverage
This market covers plant-derived protein ingredients and concentrates sold in Australia, and it is measured in revenue earned from supplying these proteins into food, supplements, animal feed, and personal care uses.
Scope exclusions: We exclude finished plant-based foods where protein is not the primary ingredient sale, and we also exclude animal and microbial proteins.
Segmentation Overview
- Protein Type
- Hemp Protein
- Pea Protein
- Potato Protein
- Rice Protein
- Soy Protein
- Wheat Protein
- Other Plant Protein
- Form
- Powder/Dry
- Liquid
- End User
- Animal Feed
- Food and Beverages
- Bakery
- Beverages
- Breakfast Cereals
- Condiments/Sauces
- Confectionery
- Dairy and Dairy Alternative Products
- Meat/Poultry/Seafood and Meat‑Alternative Products
- RTE/RTC Food Products
- Snacks
- Personal Care and Cosmetics
- Supplements
- Baby Food and Infant Formula
- Elderly / Medical Nutrition
- Sport / Performance Nutrition
Data Sources, Market Sizing, and Validation
Desk Research
Desk research started with building a clean view of Australia demand and supply signals for plant proteins, then linking those signals back to ingredient usage. We relied on public statistics and reference tables for crop availability, imports, and processing activity, since plant proteins are closely tied to grains and pulses sourcing and conversion yields.
Key public inputs included sources such as the Australian Bureau of Statistics for agriculture and trade series, the Department of Agriculture, Fisheries and Forestry for commodity outlooks, Food Standards Australia New Zealand for ingredient and labeling context, and UN Comtrade for cross-checking import volumes and partner splits. We also reviewed peer-reviewed food science journals for typical protein content ranges and processing loss factors, and industry association releases for demand themes in sports nutrition and packaged foods. To keep company-level assumptions grounded, we supplemented this with company filings, investor decks, and trusted news coverage, and then checked against paid company financials and an intelligence subscription, along with an import or export shipment-level database for directional validation. These examples are not exhaustive, and many other sources were used during the work for data collection, validation, and clarification.
Primary Interviews and Surveys
Primary inputs were gathered from ingredient suppliers, contract manufacturers, brand-side procurement, and category managers in food and supplements, followed by distributors and selected retail-facing roles. We used these discussions to confirm typical inclusion rates in formulations, the pace of soy versus pea switching, and how pricing moves with crop-linked inputs and freight.
Because this is an Australia-only market, outreach focused on local production and import channels, and then we stress-tested assumptions through follow-up calls when desk signals and model outputs did not match.
Distribution of primary research fieldwork respondents
| Company type | Respondent position |
|---|---|
| Top tier: 25% | CXOs: 14% |
| Mid tier: 61% | Functional/Unit leaders: 35% |
| Smaller Players: 14% | Managers: 51% |
Market-Sizing & Forecasting
Sizing used a top-down and bottom-up approach. The top-down view was anchored on Australia demand pools reconstructed from ingredient usage in key end uses, then converted into value using observed price bands. For example, formulation inclusion rates for protein powders, fortified foods, and selected feed rations were applied to category volumes, followed by adjustments for import dependence and local processing yields.
The model was corroborated using selective bottom-up approximations, such as supplier and distributor revenue ranges, sampled average selling prices for isolates, concentrates, and textured forms, and channel checks on how much volume moves through industrial customers versus smaller specialty buyers. Where company reporting did not split plant protein cleanly, we handled gaps through product mix proxies and capacity utilization logic, then rechecked those assumptions with interview feedback.
Key inputs that mattered most included pulse and soy availability, import volumes of protein ingredients, average protein content and yield assumptions by source, price spreads between isolates and concentrates, and end-use adoption patterns in sports nutrition and packaged foods. Forecasting relied mainly on scenario analysis that linked price and volume outlooks to crop cycles, new product launches, and expected penetration changes, and then the final curve was aligned to the consensus range shared by primary respondents.
Data Validation & Update Cycle
Outputs are validated through multiple checks that look for inconsistencies across value, volume, and pricing. We compare implied consumption with trade flows, test whether price assumptions track observed commodity-linked movements, and review whether end-use splits align with what interviewees see in their order books.
If a large variance shows up, we re-open the driver, and then respondents are re-contacted to confirm whether a change is real or driven by timing, stocking, or a one-off contract. Before sign-off, an analyst review is completed in steps, followed by a final pass close to delivery so the latest public updates are reflected. Reports are refreshed annually, and interim updates are made when material events change supply, pricing, or demand direction.
Mordor Intelligence's Australia Plant Protein Market Size Compared With Other Published Estimates
Published market values can differ for plant protein in Australia because the boundary between ingredient sales and finished plant-based foods is not handled the same way by everyone, and currency timing can also shift results. Differences also come from how imports are treated, and whether animal feed and personal care uses are counted or left out.
Import volumes of plant protein ingredients, end-use inclusion rates shared by formulators, and spot price checks provide the evidence that links Mordor Intelligence to an ingredient-led revenue pool rather than the broader plant-based food shelf value, which is a key reason the figures below do not line up.
Benchmark comparison
| Source | Market Size | Gaps in Research Methodology |
|---|---|---|
| Mordor Intelligence | USD 149.52 M (2025) | |
| Trade Journal A | USD 360.20 M (2025) | This figure appears to include a wider set of plant-based protein products, likely blending ingredient sales with some finished plant-based food value, which inflates totals versus an ingredient-only cut. The scope language is broad, and the pricing basis is not clearly tied to isolate or concentrate price bands. |
| Industry Source B | USD 273.50 M (2023) | The estimate is presented in AUD and then converted, which can shift the USD value depending on the exchange rate timing. It also does not clearly separate ingredient proteins from downstream branded goods, and it provides limited detail on how volumes were linked to end-use demand. |
Overall, the spread is mainly explained by category boundaries and conversion choices, followed by how pricing and FX are applied. Our approach stays traceable because each step is linked to observable demand signals, practical inclusion rates, and realistic price bands that can be rechecked and updated over time.
Key Questions Answered in the Report
How fast is the plant protein market expected to grow between 2026 and 2031?
The plant protein market is forecast to register a 5.32% CAGR, reaching USD 204.03 million by 2031.
Which protein source is growing quickest within plant-based ingredients?
Pea protein is advancing at a 5.97% CAGR through 2031, outpacing other sources as firms seek allergen-free, neutral-flavor options.
What factors restrain wider usage of plant proteins in mainstream foods?
Higher processing costs versus whey and lingering off-flavors necessitating masking agents remain key hurdles, particularly in price-sensitive categories.