
| Study Period | 2017 - 2030 |
| Base Year For Estimation | 2024 |
| Forecast Data Period | 2025 - 2030 |
| Market Size (2025) | USD 3.93 Billion |
| Market Size (2030) | USD 4.74 Billion |
| CAGR (2025 - 2030) | 3.82 % |
| Market Concentration | Low |
Major Players*Disclaimer: Major Players sorted in no particular order |


Australia Pet Food Market Analysis
The Australia Pet Food Market size is estimated at 3.93 billion USD in 2025, and is expected to reach 4.74 billion USD by 2030, growing at a CAGR of 3.82% during the forecast period (2025-2030).
Australia's pet food industry is experiencing significant transformation driven by changing consumer demographics and preferences. The market is particularly shaped by younger consumers, with Generation Z comprising approximately 70% of pet owners as of 2021. This demographic shift has led to increased adoption of premium pet food market products and a greater emphasis on pet nutrition and wellness. The country has emerged as a significant player in the Asia-Pacific region, accounting for 12.2% of the regional pet food market in 2022, establishing itself as the third-largest market in the region. This position reflects the strong pet ownership culture in Australia, where pets are increasingly considered integral family members.
The distribution landscape for Australian pet food continues to evolve, with traditional and modern retail channels adapting to changing consumer preferences. Supermarkets and hypermarkets maintain a dominant position with an extensive network of 1,108 stores across 956 cities as of 2023, offering convenience and accessibility to pet owners. The retail infrastructure has been strengthened through strategic expansions and modernization efforts, with major chains developing dedicated pet care sections to provide comprehensive product selections. This evolution in retail infrastructure has been accompanied by the rise of specialized pet stores and online channels, creating a multi-channel shopping environment.
Product innovation and premiumization have become key drivers of market development, with manufacturers focusing on specialized nutrition and functional ingredients. In July 2023, Hill's Pet Nutrition demonstrated this trend by launching new MSC-certified pollock and insect protein products specifically designed for pets with sensitive stomachs and skin conditions. This launch exemplifies the industry's movement toward sustainable and health-focused product development. Manufacturers are increasingly incorporating novel ingredients and developing specialized formulations to address specific health concerns and dietary requirements of pets.
The competitive landscape of Australia's pet food industry is characterized by a mix of established multinational corporations and emerging local players. The industry has witnessed significant investment in manufacturing capabilities, with companies establishing new production facilities to meet growing demand. The market structure supports both premium and mass-market segments, with companies differentiating themselves through product quality, innovation, and marketing strategies. This competitive environment has fostered continuous improvement in product quality and manufacturing standards, contributing to the overall pet food market value development.
Australia Pet Food Market Trends
Cats are the second-most adopted pets in the country due to a rise in the need for companionship during the pandemic
- The cat is the second most popular pet in Australia, and the country has witnessed an increase in the cat population. There is a trend of an increase in the adoption of cats by the people of Australia for the past five years. This trend is due to the increase in pet humanization, cats being able to live in smaller spaces compared to dogs, the need for companionship during the pandemic, increasing urbanization, and the fact that they can be kept indoors without feeling cooped up.
- The country has less number of cat owners as compared to dog owners, but the average cat per household is more than that of dogs. For instance, in 2022, the households owning a cat accounted for 33.3% of the total households having a pet, and the average cat per household was 1.6, whereas the average dog per household was 1.3. Additionally, the country witnessed an increase in the number of homes owing cats from 2.6 million in 2019 to 3.3 million in 2022 due to a rise in the need for companionship during the pandemic. The effect of the pandemic is anticipated to be witnessed for 5-10 years as the average lifespan of cats is more than 20 years.
- The cat as a pet is being acquired by different channels such as animal shelters, friends, breeders, pet stores, and vets. An animal shelter is the acquisition channel used mostly by potential pet parents in the country because of the unbiased opinions, and they disclose all known health problems to potential adopters before releasing an animal for adoption. For instance, in 2022, animal shelters accounted for 28%, whereas pet shops accounted for 11%. Additionally, the purchase of cats from pet stores increased from 8% in 2019 to 11% in 2022 due to increasing disposable income, and the demand for pets was high during the pandemic.

Understand The Key Trends Shaping This Market
Download PDF
The growing awareness of the nutritional requirements of pets and the increasing trend of pet premiumization are driving the expenditure in the country
- Australia has been witnessing an increase in pet expenditure during the study period. The increase in pet expenditure can be attributed to growing awareness about specialized pet food and providing different types of pet food, such as snacks, dry pet food, and wet pet food to their pets. These contributed to increasing pet expenditure by 25.3% between 2017 and 2022. Dogs have a higher share than cats and other animals because large-sized dogs consume a high amount of dog food, are more allergic to different foods, and have a higher amount being spent on veterinary products as they are customized diets.
- There are different types of expenses incurred by the pet parents. The different expenses include pet food expenses, pet insurance, veterinary costs, and services such as pet grooming, pet walking, and pet daycare. Pet food has the highest share of the pet expenses incurred by pet parents in the country as the pet parents are procuring products sold under premium brands such as Royal Canin and Purina, growing awareness about different nutrients required by pets, and rising disposable income. For instance, pet food expenses accounted for 30% in 2019, which increased to 51% in 2022.
- Pet parents of dogs and cats have shifted from buying pet food from supermarkets to online stores. For instance, 74% of dog food purchases from supermarkets in 2019 decreased to 64% in 2022, and online sales accounted for 30% in 2022. This change in buying patterns is due to the convenience of buying pet food from anywhere.
- Pet expenditure is expected to increase in the country during the forecast period because of the rise in awareness of the nutritional requirements of pets, changes in buying patterns, and growing pet premiumization.

OTHER KEY INDUSTRY TRENDS COVERED IN THE REPORT
- The growing adoption of dogs during the pandemic was led by the evolving pet ecosystem and the need for companionship
- The rising popularity of other animals due to the changing preferences of pet owners are driving their adoption in the country
Segment Analysis: PET FOOD PRODUCT
Food Segment in Australia Pet Food Market
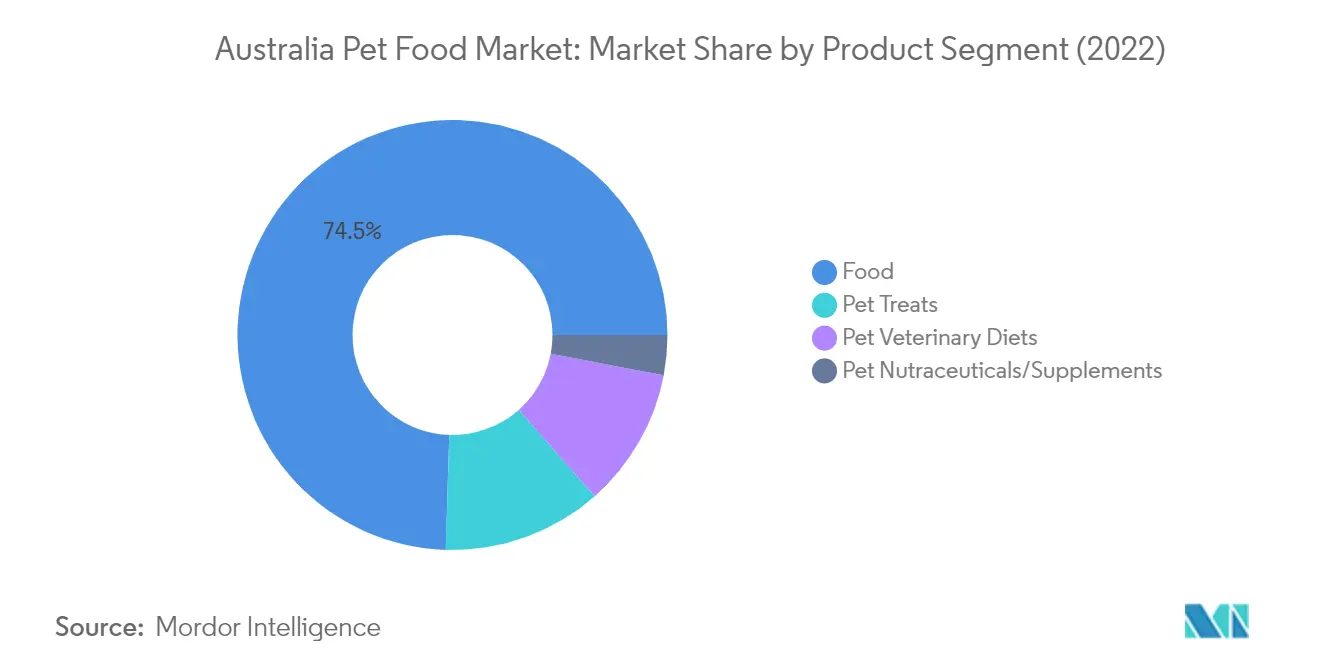
The pet food segment maintains its dominant position in the Australian pet food market, accounting for approximately 74% of the total market value in 2024. This substantial pet food market share is primarily driven by the increasing shift from home-cooked meals to commercial pet food products among Australian pet owners. The segment's growth is further supported by the rising awareness among dog owners regarding the pet nutrition market, higher usage of commercial products, and the increasing trend of pet humanization. The availability of various brands and product types, including dry and wet pet food blended with functional ingredients, has strengthened this segment's market position. Additionally, the segment's growth is bolstered by the increasing premiumization trend, where pet owners are willing to invest in high-quality commercial pet food products to ensure optimal nutrition for their pets.
Pet Nutraceuticals/Supplements Segment in Australia Pet Food Market
The pet nutraceuticals/supplements segment is emerging as the fastest-growing category in the Australian pet food market, projected to grow at approximately 12% during 2024-2029. This remarkable growth is driven by the increasing awareness about preventive healthcare and the rising demand for supplements like vitamins, minerals, probiotics, and omega-3 fatty acids. The segment's expansion is further supported by the growing trend of pet humanization, where pet owners are increasingly focused on their pets' overall health and well-being. The availability of various innovative products through multiple distribution channels and the increasing incorporation of natural ingredients in pet supplements are contributing to this growth. Moreover, the rising adoption of specialized nutrition solutions and the growing understanding of the benefits of preventive healthcare among pet owners are expected to sustain this segment's growth trajectory.
Remaining Segments in Pet Food Product Market
The pet treats and veterinary diets segments play crucial roles in completing the Australian pet food market landscape. Pet treats serve multiple purposes, including training rewards, dental health maintenance, and pet-owner bonding, while veterinary diets cater to pets with specific health conditions and dietary requirements. These segments are experiencing steady growth driven by increasing pet humanization and health awareness among pet owners. The pet treats segment is particularly benefiting from the growing trend of premium and functional treats, while the veterinary diets segment is expanding due to the increasing focus on specialized nutrition for pets with health issues. Both segments are witnessing continuous product innovations and the introduction of natural and functional ingredients to meet evolving consumer preferences.
Segment Analysis: PETS
Dogs Segment in Australia Pet Food Market
Dogs represent the dominant segment in Australia's dog food industry, accounting for approximately 44% of the total market value in 2024. This significant market share is attributed to the country's large dog population, with dogs being the most popular companion animals among Australian households. The segment's dominance is further reinforced by higher expenditure patterns among dog owners, particularly on premium and specialized food products. Australian dog owners are increasingly focusing on high-quality nutrition, with a growing preference for products containing natural ingredients and specialized formulations. The segment is also experiencing robust growth, projected to expand at around 4% annually from 2024 to 2029, driven by increasing dog adoption rates, rising pet humanization trends, and growing awareness about pet health and nutrition among Australian pet parents.
Remaining Segments in Pet Segmentation
The cat and other pets segments form significant portions of Australia's pet food market, each serving distinct consumer needs and preferences. The cat segment is characterized by specialized nutritional requirements and a growing trend toward premium and therapeutic diets, particularly among urban pet owners. The other pets segment, which includes birds, fish, and small mammals, represents a diverse market with specialized dietary needs and varying product formulations. Both segments are benefiting from increasing pet ownership trends and growing consumer awareness about proper pet nutrition. The market for these segments is also being shaped by innovations in product formulations, increasing availability of specialized diets, and the growing trend of pet humanization across all pet categories.
Segment Analysis: DISTRIBUTION CHANNEL
Supermarkets/Hypermarkets Segment in Australian Pet Food Market
Supermarkets and hypermarkets continue to dominate the Australian pet food market distribution landscape, commanding approximately 60% of the market share in 2024. This channel's dominance is primarily attributed to its one-stop shopping convenience, allowing pet owners to purchase pet food alongside their regular household items. Major chains like Woolworths, Coles, and Aldi maintain dedicated pet sections offering comprehensive product ranges across various categories including food, treats, and veterinary diets. The channel's strength is further reinforced by its extensive network of 1,108 supermarkets across 956 cities in Australia, ensuring widespread accessibility. These establishments attract customers through competitive pricing strategies, regular promotional offers, and the availability of both premium and private-label brands, making them the preferred choice for routine pet food purchases.
Online Channel Segment in Australian Pet Food Market
The online distribution channel is experiencing remarkable growth in the Australian pet food market, projected to grow at approximately 6% annually from 2024 to 2029. This channel's accelerated growth is driven by increasing digital adoption among pet owners, offering unprecedented convenience through home delivery services and subscription-based models. The segment's expansion is further supported by the comprehensive product information available online, enabling pet owners to make informed decisions through detailed ingredient lists, nutritional information, and customer reviews. Online platforms are also gaining popularity by offering competitive pricing, exclusive online-only products, and personalized shopping experiences through AI-driven recommendations and targeted promotions, making them increasingly attractive to tech-savvy pet owners.
Remaining Segments in Distribution Channel
The Australian pet food market's distribution landscape is further diversified through specialty stores, convenience stores, and other channels including veterinary clinics and pet shelters. Specialty stores stand out by offering expert advice, premium products, and customized solutions for specific pet needs. Convenience stores serve as quick-access points for emergency purchases and basic pet food needs, particularly in urban areas. Other channels, including veterinary clinics and pet shelters, play a crucial role in distributing specialized diets and prescription pet food products. These channels collectively contribute to a comprehensive distribution network that caters to various consumer preferences and shopping behaviors in the Australian pet food market.
Australia Pet Food Industry Overview
Top Companies in Australia Pet Food Market
The Australian pet food market is characterized by companies actively pursuing product innovation and strategic expansion initiatives. Major players are focusing on developing premium and specialized pet food products, including natural ingredients, grain-free options, and functional foods targeting specific health conditions. Operational agility is demonstrated through investments in local manufacturing facilities and distribution networks, with several companies establishing or expanding production sites across Australia. Strategic moves predominantly involve partnerships with research institutes, veterinary clinics, and local distributors to strengthen market presence and enhance product development capabilities. Companies are also expanding their reach through multi-channel distribution strategies, combining traditional retail presence with growing e-commerce capabilities to meet evolving consumer preferences. This dynamic environment is led by leaders in pet food who are setting benchmarks in innovation and distribution.
Mix of Global and Local Players
The Australian pet food market exhibits a fragmented competitive landscape with a balanced mix of global conglomerates and local specialists. Global players like Mars Incorporated, Nestlé Purina, and Colgate-Palmolive leverage their international expertise and extensive research capabilities to maintain market positions, while local companies such as Real Pet Food Co. and EBOS Group capitalize on their understanding of regional preferences and established distribution networks. The market structure allows for healthy competition while maintaining sufficient space for both established players and new entrants to operate profitably.
The market demonstrates moderate consolidation levels, with mergers and acquisitions serving as key growth strategies for both global and local players. Companies are strategically acquiring smaller, specialized manufacturers to expand their product portfolios and gain access to new market segments. The trend of vertical integration is evident as companies seek to control various aspects of the supply chain, from manufacturing to distribution, to ensure product quality and optimize operational efficiency. This strategy is particularly beneficial for small companies in the pet food sector aiming to enhance their market presence.
Innovation and Distribution Drive Market Success
Success in the Australian pet food market increasingly depends on companies' ability to innovate and adapt to changing consumer preferences. Incumbents can strengthen their market position by investing in research and development to create differentiated products, particularly in premium and specialized segments. Building strong relationships with veterinarians and pet care professionals, expanding manufacturing capabilities, and developing omnichannel distribution strategies are crucial for maintaining competitive advantage. Companies must also focus on sustainability initiatives and transparent sourcing practices to align with growing consumer consciousness.
For contenders seeking to gain ground, opportunities lie in targeting specific market niches and developing innovative products that address unmet consumer needs. Success factors include establishing a strong local manufacturing presence, developing effective distribution partnerships, and leveraging digital platforms to reach consumers directly. The regulatory environment, while structured, remains supportive of market growth, with companies needing to maintain compliance with quality standards while pursuing innovation. The market's resilience to substitution risks is strengthened by growing pet humanization trends and increasing consumer willingness to spend on premium pet food products. The market share of pet food by brand is influenced by these strategic initiatives and consumer trends.
Australia Pet Food Market Leaders
-
Colgate-Palmolive Company (Hill's Pet Nutrition Inc.)
-
EBOS Group Limited
-
Mars Incorporated
-
Nestle (Purina)
-
Real Pet Food Co.
- *Disclaimer: Major Players sorted in no particular order

Need More Details on Market Players and Competiters?
Download PDF
Australia Pet Food Market News
- July 2023: Hill's Pet Nutrition introduced its new MSC (Marine Stewardship Council) certified pollock and insect protein products for pets with sensitive stomachs and skin lines. They contain vitamins, omega-3 fatty acids, and antioxidants.
- May 2023: Nestle Purina launched new cat treats under the Friskies "Friskies Playfuls - treats" brand. These treats are round in shape and are available in chicken and liver and salmon and shrimp flavors for adult cats.
- April 2023: Mars Incorporated opened its first pet food research and development center in Asia-Pacific. This new facility, called the APAC pet center, will support the company's product development.
Free With This Report
We provide a complimentary and exhaustive set of data points on regional and country-level metrics that present the fundamental structure of the industry. Presented in the form of 90+ free charts, the section covers difficult-to-find data from various countries regarding the expenditure on different pet food products including food, treats, veterinary diets, and nutraceuticals/supplements.


Australia Pet Food Market Report - Table of Contents
1. EXECUTIVE SUMMARY & KEY FINDINGS
2. REPORT OFFERS
3. INTRODUCTION
- 3.1 Study Assumptions & Market Definition
- 3.2 Scope of the Study
- 3.3 Research Methodology
4. KEY INDUSTRY TRENDS
-
4.1 Pet Population
- 4.1.1 Cats
- 4.1.2 Dogs
- 4.1.3 Other Pets
- 4.2 Pet Expenditure
- 4.3 Regulatory Framework
- 4.4 Value Chain & Distribution Channel Analysis
5. MARKET SEGMENTATION (includes market size in Value in USD and Volume, Forecasts up to 2030 and analysis of growth prospects)
-
5.1 Pet Food Product
- 5.1.1 Food
- 5.1.1.1 By Sub Product
- 5.1.1.1.1 Dry Pet Food
- 5.1.1.1.1.1 By Sub Dry Pet Food
- 5.1.1.1.1.1.1 Kibbles
- 5.1.1.1.1.1.2 Other Dry Pet Food
- 5.1.1.1.2 Wet Pet Food
- 5.1.2 Pet Nutraceuticals/Supplements
- 5.1.2.1 By Sub Product
- 5.1.2.1.1 Milk Bioactives
- 5.1.2.1.2 Omega-3 Fatty Acids
- 5.1.2.1.3 Probiotics
- 5.1.2.1.4 Proteins and Peptides
- 5.1.2.1.5 Vitamins and Minerals
- 5.1.2.1.6 Other Nutraceuticals
- 5.1.3 Pet Treats
- 5.1.3.1 By Sub Product
- 5.1.3.1.1 Crunchy Treats
- 5.1.3.1.2 Dental Treats
- 5.1.3.1.3 Freeze-dried and Jerky Treats
- 5.1.3.1.4 Soft & Chewy Treats
- 5.1.3.1.5 Other Treats
- 5.1.4 Pet Veterinary Diets
- 5.1.4.1 By Sub Product
- 5.1.4.1.1 Diabetes
- 5.1.4.1.2 Digestive Sensitivity
- 5.1.4.1.3 Oral Care Diets
- 5.1.4.1.4 Renal
- 5.1.4.1.5 Urinary tract disease
- 5.1.4.1.6 Other Veterinary Diets
-
5.2 Pets
- 5.2.1 Cats
- 5.2.2 Dogs
- 5.2.3 Other Pets
-
5.3 Distribution Channel
- 5.3.1 Convenience Stores
- 5.3.2 Online Channel
- 5.3.3 Specialty Stores
- 5.3.4 Supermarkets/Hypermarkets
- 5.3.5 Other Channels
6. COMPETITIVE LANDSCAPE
- 6.1 Key Strategic Moves
- 6.2 Market Share Analysis
- 6.3 Company Landscape
-
6.4 Company Profiles
- 6.4.1 ADM
- 6.4.2 Clearlake Capital Group, L.P. (Wellness Pet Company Inc.)
- 6.4.3 Colgate-Palmolive Company (Hill's Pet Nutrition Inc.)
- 6.4.4 EBOS Group Limited
- 6.4.5 IB Group (Drools Pet Food Pvt. Ltd.)
- 6.4.6 Mars Incorporated
- 6.4.7 Nestle (Purina)
- 6.4.8 Petway Petcare
- 6.4.9 Real Pet Food Co.
- 6.4.10 Schell & Kampeter Inc. (Diamond Pet Foods)
- *List Not Exhaustive
7. KEY STRATEGIC QUESTIONS FOR PET FOOD CEOS
8. APPENDIX
-
8.1 Global Overview
- 8.1.1 Overview
- 8.1.2 Porter’s Five Forces Framework
- 8.1.3 Global Value Chain Analysis
- 8.1.4 Market Dynamics (DROs)
- 8.2 Sources & References
- 8.3 List of Tables & Figures
- 8.4 Primary Insights
- 8.5 Data Pack
- 8.6 Glossary of Terms
You Can Purchase Parts Of This Report. Check Out Prices For Specific Sections
Get Price Break-up Now
List of Tables & Figures
- Figure 1:
- PET POPULATION OF CATS, NUMBER, AUSTRALIA, 2017 - 2022
- Figure 2:
- PET POPULATION OF DOGS, NUMBER, AUSTRALIA, 2017 - 2022
- Figure 3:
- PET POPULATION OF OTHER PETS, NUMBER, AUSTRALIA, 2017 - 2022
- Figure 4:
- PET EXPENDITURE PER CAT, USD, AUSTRALIA, 2017 - 2022
- Figure 5:
- PET EXPENDITURE PER DOG, USD, AUSTRALIA, 2017 - 2022
- Figure 6:
- PET EXPENDITURE PER OTHER PET, USD, AUSTRALIA, 2017 - 2022
- Figure 7:
- VOLUME OF PET FOOD, METRIC TON, AUSTRALIA, 2017 - 2029
- Figure 8:
- VALUE OF PET FOOD, USD, AUSTRALIA, 2017 - 2029
- Figure 9:
- VOLUME OF PET FOOD BY PET FOOD PRODUCT CATEGORIES, METRIC TON, AUSTRALIA, 2017 - 2029
- Figure 10:
- VALUE OF PET FOOD BY PET FOOD PRODUCT CATEGORIES, USD, AUSTRALIA, 2017 - 2029
- Figure 11:
- VOLUME SHARE OF PET FOOD BY PET FOOD PRODUCT CATEGORIES, %, AUSTRALIA, 2017 VS 2023 VS 2029
- Figure 12:
- VALUE SHARE OF PET FOOD BY PET FOOD PRODUCT CATEGORIES, %, AUSTRALIA, 2017 VS 2023 VS 2029
- Figure 13:
- VOLUME OF PET FOOD BY SUB PRODUCT CATEGORIES, METRIC TON, AUSTRALIA, 2017 - 2029
- Figure 14:
- VALUE OF PET FOOD BY SUB PRODUCT CATEGORIES, USD, AUSTRALIA, 2017 - 2029
- Figure 15:
- VOLUME SHARE OF PET FOOD BY SUB PRODUCT CATEGORIES, %, AUSTRALIA, 2017 VS 2023 VS 2029
- Figure 16:
- VALUE SHARE OF PET FOOD BY SUB PRODUCT CATEGORIES, %, AUSTRALIA, 2017 VS 2023 VS 2029
- Figure 17:
- VOLUME OF PET FOOD BY SUB DRY PET FOOD CATEGORIES, METRIC TON, AUSTRALIA, 2017 - 2029
- Figure 18:
- VALUE OF PET FOOD BY SUB DRY PET FOOD CATEGORIES, USD, AUSTRALIA, 2017 - 2029
- Figure 19:
- VOLUME SHARE OF PET FOOD BY SUB DRY PET FOOD CATEGORIES, %, AUSTRALIA, 2017 VS 2023 VS 2029
- Figure 20:
- VALUE SHARE OF PET FOOD BY SUB DRY PET FOOD CATEGORIES, %, AUSTRALIA, 2017 VS 2023 VS 2029
- Figure 21:
- VOLUME OF KIBBLES, METRIC TON, AUSTRALIA, 2017 - 2029
- Figure 22:
- VALUE OF KIBBLES, USD, AUSTRALIA, 2017 - 2029
- Figure 23:
- VALUE SHARE OF KIBBLES BY DISTRIBUTION CHANNEL, %, AUSTRALIA, 2022 AND 2029
- Figure 24:
- VOLUME OF OTHER DRY PET FOOD, METRIC TON, AUSTRALIA, 2017 - 2029
- Figure 25:
- VALUE OF OTHER DRY PET FOOD, USD, AUSTRALIA, 2017 - 2029
- Figure 26:
- VALUE SHARE OF OTHER DRY PET FOOD BY DISTRIBUTION CHANNEL, %, AUSTRALIA, 2022 AND 2029
- Figure 27:
- VOLUME OF WET PET FOOD, METRIC TON, AUSTRALIA, 2017 - 2029
- Figure 28:
- VALUE OF WET PET FOOD, USD, AUSTRALIA, 2017 - 2029
- Figure 29:
- VALUE SHARE OF WET PET FOOD BY DISTRIBUTION CHANNEL, %, AUSTRALIA, 2022 AND 2029
- Figure 30:
- VOLUME OF PET FOOD BY SUB PRODUCT CATEGORIES, METRIC TON, AUSTRALIA, 2017 - 2029
- Figure 31:
- VALUE OF PET FOOD BY SUB PRODUCT CATEGORIES, USD, AUSTRALIA, 2017 - 2029
- Figure 32:
- VOLUME SHARE OF PET FOOD BY SUB PRODUCT CATEGORIES, %, AUSTRALIA, 2017 VS 2023 VS 2029
- Figure 33:
- VALUE SHARE OF PET FOOD BY SUB PRODUCT CATEGORIES, %, AUSTRALIA, 2017 VS 2023 VS 2029
- Figure 34:
- VOLUME OF MILK BIOACTIVES, METRIC TON, AUSTRALIA, 2017 - 2029
- Figure 35:
- VALUE OF MILK BIOACTIVES, USD, AUSTRALIA, 2017 - 2029
- Figure 36:
- VALUE SHARE OF MILK BIOACTIVES BY DISTRIBUTION CHANNEL, %, AUSTRALIA, 2022 AND 2029
- Figure 37:
- VOLUME OF OMEGA-3 FATTY ACIDS, METRIC TON, AUSTRALIA, 2017 - 2029
- Figure 38:
- VALUE OF OMEGA-3 FATTY ACIDS, USD, AUSTRALIA, 2017 - 2029
- Figure 39:
- VALUE SHARE OF OMEGA-3 FATTY ACIDS BY DISTRIBUTION CHANNEL, %, AUSTRALIA, 2022 AND 2029
- Figure 40:
- VOLUME OF PROBIOTICS, METRIC TON, AUSTRALIA, 2017 - 2029
- Figure 41:
- VALUE OF PROBIOTICS, USD, AUSTRALIA, 2017 - 2029
- Figure 42:
- VALUE SHARE OF PROBIOTICS BY DISTRIBUTION CHANNEL, %, AUSTRALIA, 2022 AND 2029
- Figure 43:
- VOLUME OF PROTEINS AND PEPTIDES, METRIC TON, AUSTRALIA, 2017 - 2029
- Figure 44:
- VALUE OF PROTEINS AND PEPTIDES, USD, AUSTRALIA, 2017 - 2029
- Figure 45:
- VALUE SHARE OF PROTEINS AND PEPTIDES BY DISTRIBUTION CHANNEL, %, AUSTRALIA, 2022 AND 2029
- Figure 46:
- VOLUME OF VITAMINS AND MINERALS, METRIC TON, AUSTRALIA, 2017 - 2029
- Figure 47:
- VALUE OF VITAMINS AND MINERALS, USD, AUSTRALIA, 2017 - 2029
- Figure 48:
- VALUE SHARE OF VITAMINS AND MINERALS BY DISTRIBUTION CHANNEL, %, AUSTRALIA, 2022 AND 2029
- Figure 49:
- VOLUME OF OTHER NUTRACEUTICALS, METRIC TON, AUSTRALIA, 2017 - 2029
- Figure 50:
- VALUE OF OTHER NUTRACEUTICALS, USD, AUSTRALIA, 2017 - 2029
- Figure 51:
- VALUE SHARE OF OTHER NUTRACEUTICALS BY DISTRIBUTION CHANNEL, %, AUSTRALIA, 2022 AND 2029
- Figure 52:
- VOLUME OF PET FOOD BY SUB PRODUCT CATEGORIES, METRIC TON, AUSTRALIA, 2017 - 2029
- Figure 53:
- VALUE OF PET FOOD BY SUB PRODUCT CATEGORIES, USD, AUSTRALIA, 2017 - 2029
- Figure 54:
- VOLUME SHARE OF PET FOOD BY SUB PRODUCT CATEGORIES, %, AUSTRALIA, 2017 VS 2023 VS 2029
- Figure 55:
- VALUE SHARE OF PET FOOD BY SUB PRODUCT CATEGORIES, %, AUSTRALIA, 2017 VS 2023 VS 2029
- Figure 56:
- VOLUME OF CRUNCHY TREATS, METRIC TON, AUSTRALIA, 2017 - 2029
- Figure 57:
- VALUE OF CRUNCHY TREATS, USD, AUSTRALIA, 2017 - 2029
- Figure 58:
- VALUE SHARE OF CRUNCHY TREATS BY DISTRIBUTION CHANNEL, %, AUSTRALIA, 2022 AND 2029
- Figure 59:
- VOLUME OF DENTAL TREATS, METRIC TON, AUSTRALIA, 2017 - 2029
- Figure 60:
- VALUE OF DENTAL TREATS, USD, AUSTRALIA, 2017 - 2029
- Figure 61:
- VALUE SHARE OF DENTAL TREATS BY DISTRIBUTION CHANNEL, %, AUSTRALIA, 2022 AND 2029
- Figure 62:
- VOLUME OF FREEZE-DRIED AND JERKY TREATS, METRIC TON, AUSTRALIA, 2017 - 2029
- Figure 63:
- VALUE OF FREEZE-DRIED AND JERKY TREATS, USD, AUSTRALIA, 2017 - 2029
- Figure 64:
- VALUE SHARE OF FREEZE-DRIED AND JERKY TREATS BY DISTRIBUTION CHANNEL, %, AUSTRALIA, 2022 AND 2029
- Figure 65:
- VOLUME OF SOFT & CHEWY TREATS, METRIC TON, AUSTRALIA, 2017 - 2029
- Figure 66:
- VALUE OF SOFT & CHEWY TREATS, USD, AUSTRALIA, 2017 - 2029
- Figure 67:
- VALUE SHARE OF SOFT & CHEWY TREATS BY DISTRIBUTION CHANNEL, %, AUSTRALIA, 2022 AND 2029
- Figure 68:
- VOLUME OF OTHER TREATS, METRIC TON, AUSTRALIA, 2017 - 2029
- Figure 69:
- VALUE OF OTHER TREATS, USD, AUSTRALIA, 2017 - 2029
- Figure 70:
- VALUE SHARE OF OTHER TREATS BY DISTRIBUTION CHANNEL, %, AUSTRALIA, 2022 AND 2029
- Figure 71:
- VOLUME OF PET FOOD BY SUB PRODUCT CATEGORIES, METRIC TON, AUSTRALIA, 2017 - 2029
- Figure 72:
- VALUE OF PET FOOD BY SUB PRODUCT CATEGORIES, USD, AUSTRALIA, 2017 - 2029
- Figure 73:
- VOLUME SHARE OF PET FOOD BY SUB PRODUCT CATEGORIES, %, AUSTRALIA, 2017 VS 2023 VS 2029
- Figure 74:
- VALUE SHARE OF PET FOOD BY SUB PRODUCT CATEGORIES, %, AUSTRALIA, 2017 VS 2023 VS 2029
- Figure 75:
- VOLUME OF DIABETES, METRIC TON, AUSTRALIA, 2017 - 2029
- Figure 76:
- VALUE OF DIABETES, USD, AUSTRALIA, 2017 - 2029
- Figure 77:
- VALUE SHARE OF DIABETES BY DISTRIBUTION CHANNEL, %, AUSTRALIA, 2022 AND 2029
- Figure 78:
- VOLUME OF DIGESTIVE SENSITIVITY, METRIC TON, AUSTRALIA, 2017 - 2029
- Figure 79:
- VALUE OF DIGESTIVE SENSITIVITY, USD, AUSTRALIA, 2017 - 2029
- Figure 80:
- VALUE SHARE OF DIGESTIVE SENSITIVITY BY DISTRIBUTION CHANNEL, %, AUSTRALIA, 2022 AND 2029
- Figure 81:
- VOLUME OF ORAL CARE DIETS, METRIC TON, AUSTRALIA, 2017 - 2029
- Figure 82:
- VALUE OF ORAL CARE DIETS, USD, AUSTRALIA, 2017 - 2029
- Figure 83:
- VALUE SHARE OF ORAL CARE DIETS BY DISTRIBUTION CHANNEL, %, AUSTRALIA, 2022 AND 2029
- Figure 84:
- VOLUME OF RENAL, METRIC TON, AUSTRALIA, 2017 - 2029
- Figure 85:
- VALUE OF RENAL, USD, AUSTRALIA, 2017 - 2029
- Figure 86:
- VALUE SHARE OF RENAL BY DISTRIBUTION CHANNEL, %, AUSTRALIA, 2022 AND 2029
- Figure 87:
- VOLUME OF URINARY TRACT DISEASE, METRIC TON, AUSTRALIA, 2017 - 2029
- Figure 88:
- VALUE OF URINARY TRACT DISEASE, USD, AUSTRALIA, 2017 - 2029
- Figure 89:
- VALUE SHARE OF URINARY TRACT DISEASE BY DISTRIBUTION CHANNEL, %, AUSTRALIA, 2022 AND 2029
- Figure 90:
- VOLUME OF OTHER VETERINARY DIETS, METRIC TON, AUSTRALIA, 2017 - 2029
- Figure 91:
- VALUE OF OTHER VETERINARY DIETS, USD, AUSTRALIA, 2017 - 2029
- Figure 92:
- VALUE SHARE OF OTHER VETERINARY DIETS BY DISTRIBUTION CHANNEL, %, AUSTRALIA, 2022 AND 2029
- Figure 93:
- VOLUME OF PET FOOD BY PET TYPE, METRIC TON, AUSTRALIA, 2017 - 2029
- Figure 94:
- VALUE OF PET FOOD BY PET TYPE, USD, AUSTRALIA, 2017 - 2029
- Figure 95:
- VOLUME SHARE OF PET FOOD BY PET TYPE, %, AUSTRALIA, 2017 VS 2023 VS 2029
- Figure 96:
- VALUE SHARE OF PET FOOD BY PET TYPE, %, AUSTRALIA, 2017 VS 2023 VS 2029
- Figure 97:
- VOLUME OF PET CAT FOOD, METRIC TON, AUSTRALIA, 2017 - 2029
- Figure 98:
- VALUE OF PET CAT FOOD, USD, AUSTRALIA, 2017 - 2029
- Figure 99:
- VALUE SHARE OF PET CAT FOOD BY PET FOOD CATEGORIES, %, AUSTRALIA, 2022 AND 2029
- Figure 100:
- VOLUME OF PET DOG FOOD, METRIC TON, AUSTRALIA, 2017 - 2029
- Figure 101:
- VALUE OF PET DOG FOOD, USD, AUSTRALIA, 2017 - 2029
- Figure 102:
- VALUE SHARE OF PET DOG FOOD BY PET FOOD CATEGORIES, %, AUSTRALIA, 2022 AND 2029
- Figure 103:
- VOLUME OF OTHER PETS FOOD, METRIC TON, AUSTRALIA, 2017 - 2029
- Figure 104:
- VALUE OF OTHER PETS FOOD, USD, AUSTRALIA, 2017 - 2029
- Figure 105:
- VALUE SHARE OF OTHER PETS FOOD BY PET FOOD CATEGORIES, %, AUSTRALIA, 2022 AND 2029
- Figure 106:
- VOLUME OF PET FOOD SOLD VIA DISTRIBUTION CHANNELS, METRIC TON, AUSTRALIA, 2017 - 2029
- Figure 107:
- VALUE OF PET FOOD SOLD VIA DISTRIBUTION CHANNELS, USD, AUSTRALIA, 2017 - 2029
- Figure 108:
- VOLUME SHARE OF PET FOOD SOLD VIA DISTRIBUTION CHANNELS, %, AUSTRALIA, 2017 VS 2023 VS 2029
- Figure 109:
- VALUE SHARE OF PET FOOD SOLD VIA DISTRIBUTION CHANNELS, %, AUSTRALIA, 2017 VS 2023 VS 2029
- Figure 110:
- VOLUME OF PET FOOD SOLD VIA CONVENIENCE STORES, METRIC TON, AUSTRALIA, 2017 - 2029
- Figure 111:
- VALUE OF PET FOOD SOLD VIA CONVENIENCE STORES, USD, AUSTRALIA, 2017 - 2029
- Figure 112:
- VALUE SHARE OF PET FOOD SOLD VIA CONVENIENCE STORES BY PET FOOD PRODUCT CATEGORIES, %, AUSTRALIA, 2022 AND 2029
- Figure 113:
- VOLUME OF PET FOOD SOLD VIA ONLINE CHANNEL, METRIC TON, AUSTRALIA, 2017 - 2029
- Figure 114:
- VALUE OF PET FOOD SOLD VIA ONLINE CHANNEL, USD, AUSTRALIA, 2017 - 2029
- Figure 115:
- VALUE SHARE OF PET FOOD SOLD VIA ONLINE CHANNEL BY PET FOOD PRODUCT CATEGORIES, %, AUSTRALIA, 2022 AND 2029
- Figure 116:
- VOLUME OF PET FOOD SOLD VIA SPECIALTY STORES, METRIC TON, AUSTRALIA, 2017 - 2029
- Figure 117:
- VALUE OF PET FOOD SOLD VIA SPECIALTY STORES, USD, AUSTRALIA, 2017 - 2029
- Figure 118:
- VALUE SHARE OF PET FOOD SOLD VIA SPECIALTY STORES BY PET FOOD PRODUCT CATEGORIES, %, AUSTRALIA, 2022 AND 2029
- Figure 119:
- VOLUME OF PET FOOD SOLD VIA SUPERMARKETS/HYPERMARKETS, METRIC TON, AUSTRALIA, 2017 - 2029
- Figure 120:
- VALUE OF PET FOOD SOLD VIA SUPERMARKETS/HYPERMARKETS, USD, AUSTRALIA, 2017 - 2029
- Figure 121:
- VALUE SHARE OF PET FOOD SOLD VIA SUPERMARKETS/HYPERMARKETS BY PET FOOD PRODUCT CATEGORIES, %, AUSTRALIA, 2022 AND 2029
- Figure 122:
- VOLUME OF PET FOOD SOLD VIA OTHER CHANNELS, METRIC TON, AUSTRALIA, 2017 - 2029
- Figure 123:
- VALUE OF PET FOOD SOLD VIA OTHER CHANNELS, USD, AUSTRALIA, 2017 - 2029
- Figure 124:
- VALUE SHARE OF PET FOOD SOLD VIA OTHER CHANNELS BY PET FOOD PRODUCT CATEGORIES, %, AUSTRALIA, 2022 AND 2029
- Figure 125:
- MOST ACTIVE COMPANIES BY NUMBER OF STRATEGIC MOVES, COUNT, AUSTRALIA, 2017 - 2023
- Figure 126:
- MOST ADOPTED STRATEGIES, COUNT, AUSTRALIA, 2017 - 2023
- Figure 127:
- VALUE SHARE OF MAJOR PLAYERS, %, AUSTRALIA
Australia Pet Food Industry Segmentation
Food, Pet Nutraceuticals/Supplements, Pet Treats, Pet Veterinary Diets are covered as segments by Pet Food Product. Cats, Dogs are covered as segments by Pets. Convenience Stores, Online Channel, Specialty Stores, Supermarkets/Hypermarkets are covered as segments by Distribution Channel.| Pet Food Product | Food | By Sub Product | Dry Pet Food | By Sub Dry Pet Food | Kibbles |
| Other Dry Pet Food | |||||
| Wet Pet Food | |||||
| Pet Nutraceuticals/Supplements | By Sub Product | Milk Bioactives | |||
| Omega-3 Fatty Acids | |||||
| Probiotics | |||||
| Proteins and Peptides | |||||
| Vitamins and Minerals | |||||
| Other Nutraceuticals | |||||
| Pet Treats | By Sub Product | Crunchy Treats | |||
| Dental Treats | |||||
| Freeze-dried and Jerky Treats | |||||
| Soft & Chewy Treats | |||||
| Other Treats | |||||
| Pet Veterinary Diets | By Sub Product | Diabetes | |||
| Digestive Sensitivity | |||||
| Oral Care Diets | |||||
| Renal | |||||
| Urinary tract disease | |||||
| Other Veterinary Diets | |||||
| Pets | Cats | ||||
| Dogs | |||||
| Other Pets | |||||
| Distribution Channel | Convenience Stores | ||||
| Online Channel | |||||
| Specialty Stores | |||||
| Supermarkets/Hypermarkets | |||||
| Other Channels | |||||
Need A Different Region or Segment?
Customize Now
Market Definition
- FUNCTIONS - Pet foods are usually intended to provide complete and balanced nutrition to the pet but are primarily used as functional products. The scope includes the food and supplements consumed by pets including veterinary diets. Supplements/nutraceuticals that are directly supplied to pets are considered within the scope.
- RESELLERS - Companies engaged in reselling of pet food without value addition have been excluded from the market scope, in order to avoid double counting.
- END CONSUMERS - Pet owners are considered to be the end-consumers in the market studied.
- DISTRIBUTION CHANNELS - Supermarkets/hypermarkets, specialty stores, convenience stores, online channels and other channels are considered within the scope. The stores which are exclusively providing pet related basic and custom products are considered within the scope of specialty stores.
| Keyword | Definition |
|---|---|
| Pet Food | The scope of pet food includes the food that is eatable by pets including food, treats, veterinary diets, and nutraceuticals/supplements. |
| Food | Food is animal feed intended for consumption by pets. It is formulated to provide essential nutrients and meet the dietary needs of various types of pets, including dogs, cats, and other animals. These are generally segmented into dry and wet pet foods. |
| Dry Pet Food | Dry pet foods may be extruded/baked (kibbles) or flaked. They have a lower moisture content, typically around 12-20%. |
| Wet Pet Food | Wet pet food, also known as canned pet food or moist pet food, generally has a higher moisture content compared to dry pet food, often ranging from 70-80%. |
| Kibbles | Kibbles are dry, processed pet food in small, bite-sized pieces or pellets. They are specifically formulated to provide balanced nutrition for various domestic animals, such as dogs, cats, and other animals. |
| Treats | Pet Treats are special food items or rewards given to pets, to show affection, and encourage good behavior. They are especially used during training. Pet treats are made from various combinations of meat or meat-derived materials with other ingredients. |
| Dental Treats | Pet dental treats are specialized treats that are formulated to promote good oral hygiene in pets. |
| Crunchy Treats | It is a type of pet treat that has a firm and crispy texture which can be a good source of nutrition for pets. |
| Soft and chewy treats | Soft and Chewy pet treats are a type of pet food product that is formulated to be easy to chewy and digest. They are usually made from soft and pliable ingredients, such as meat, poultry, or vegetables, that have been blended and formed into bite-sized pieces or strips. |
| Freeze-dried & Jerky Treats | Freeze-dried and jerky treats are snacks given to pets, that are prepared through a special preservation process, without damaging the nutritional content, resulting in long-lasting, nutrient-rich treats. |
| Urinary Tract Disease Diets | These are commercial diets that are specifically formulated to promote urinary health and reduce the risk of urinary tract infections and other urinary problems. |
| Renal Diets | These are specialized pet foods formulated to support the health of pets with kidney disease or renal insufficiency. |
| Digestive Sensitivity Diets | Digestive-sensitive diets are specially formulated to meet the nutritional needs of pets with digestive issues such as food intolerances, allergies, and sensitivities. These diets are designed to be easily digestible and to reduce the symptoms of digestive problems in pets. |
| Oral Care Diets | Oral care diets for pets are specially formulated diets produced to promote oral health and hygiene in pets. |
| Grain-Free Pet Food | Pet food that does not contain common grains like wheat, corn, or soy. Grain-free diets are often preferred by pet owners seeking alternative options or if their pets have specific dietary sensitivities. |
| Premium Pet Food | High-quality pet food formulated with superior ingredients often offers additional nutritional benefits compared to standard pet food. |
| Natural Pet Food | Pet food made from natural ingredients, with minimal processing and without artificial preservatives. |
| Organic Pet Food | Pet food is produced using organic ingredients, free from synthetic pesticides, hormones, and genetically modified organisms (GMOs). |
| Extrusion | A manufacturing process used to produce dry pet food, where ingredients are cooked, mixed, and shaped under high pressure and temperature. |
| Other Pets | Other pets include birds, fish, rabbits, hamsters, ferrets, and reptiles. |
| Palatability | The taste, texture, and aroma of pet food influence its appeal and acceptance by pets. |
| Complete and Balanced Pet Food | Pet food that provides all essential nutrients in appropriate proportions to meet the nutritional needs of pets without additional supplementation. |
| Preservatives | These are the substances that are added to pet food to extend its shelf life and prevent spoilage. |
| Nutraceuticals | Food products that offer health benefits beyond basic nutrition, often contain bioactive compounds with potential therapeutic effects. |
| Probiotics | Live beneficial bacteria that promote a healthy balance of gut flora, supporting digestive health and immune function in pets. |
| Antioxidants | Compounds that help neutralize harmful free radicals in the body, promoting cellular health and supporting the immune system in pets. |
| Shelf-Life | The duration of which pet food remains safe and nutritionally viable for consumption after its production date. |
| Prescription diet | Specialized pet food formulated to address specific medical conditions under veterinary supervision. |
| Allergen | A substance that can cause allergic reactions in some pets, leading to food allergies or sensitivities. |
| Canned food | Wet pet food that is packed in cans and contains higher moisture content than dry food. |
| Limited ingredient diet (LID) | Pet food formulated with a reduced number of ingredients to minimize potential allergens. |
| Guaranteed Analysis | The minimum or maximum levels of certain nutrients present in pet food. |
| Weight management | Pet food designed to help pets maintain a healthy weight or support weight loss efforts. |
| Other Nutraceuticals | It includes prebiotics, antioxidants, digestive fiber, enzymes, essential oils and herbs. |
| Other Veterinary Diets | It includes weight management diets, skin and coat health, cardiac care, and joint care. |
| Other Treats | It includes rawhides, mineral blocks, lickables, and catnips. |
| Other Dry Foods | It includes cereal flakes, mixers, meal toppers, freeze-dried foods, and air-dried foods. |
| Other Animals | It includes birds, fish, reptiles, and small animals (rabbits, ferrets, hamsters). |
| Other Distribution Channels | It includes veterinary clinics, local unregulated stores, and feed and farm stores. |
| Proteins and Peptides | Proteins are large molecules composed of basic units called amino acids which help in the growth and development of pets. Peptides are the short string of 2 to 50 amino acids. |
| Omega-3 fatty acids | Omega-3 fatty acids are essential polyunsaturated fats that play a crucial role in the overall health and well-being of Pets |
| Vitamins | Vitamins are the essential organic compounds that are essential for vital physiological functioning. |
| Minerals | Minerals are naturally occurring inorganic substances that are essential for various physiological functions in pets. |
| CKD | Chronic Kidney Disease |
| DHA | Docosahexaenoic Acid |
| EPA | Eicosapentaenoic Acid |
| ALA | Alpha-linolenic Acid |
| BHA | Butylated Hydroxyanisol |
| BHT | Butylated Hydroxytoluene |
| FLUTD | Feline Lower Urinary Tract Disease |
Need More Details on Market Definition?
Ask a Question
Research Methodology
Mordor Intelligence follows a four-step methodology in all our reports.
- Step-1: IDENTIFY KEY VARIABLES: In order to build a robust forecasting methodology, the variables and factors identified in Step-1 are tested against available historical market numbers. Through an iterative process, the variables required for market forecast are set and the model is built on the basis of these variables.
- Step-2: Build a Market Model: Market-size estimations for the forecast years are in nominal terms. Inflation is not a part of the pricing, and the average selling price (ASP) is kept constant throughout the forecast period.
- Step-3: Validate and Finalize: In this important step, all market numbers, variables and analyst calls are validated through an extensive network of primary research experts from the market studied. The respondents are selected across levels and functions to generate a holistic picture of the market studied.
- Step-4: Research Outputs: Syndicated Reports, Custom Consulting Assignments, Databases & Subscription Platforms

Get More Details On Research Methodology
Download PDF


