
Market Overview
| Study Period | 2020 - 2031 |
|---|---|
| Forecast Data Period | 2026 - 2031 |
| Base Year Market Size (2025) | USD 0.85 Billion |
| Market Size (2026) | USD 0.92 Billion |
| Market Size (2031) | USD 1.35 Billion |
| Growth Rate (2026 - 2031) | 7.98 % |
| Market Concentration | Medium |
Major Players *Disclaimer: Major Players sorted in no particular order Image © Mordor Intelligence. Reuse requires attribution under CC BY 4.0. | |
Australia Patient Monitoring Market Analysis by Mordor Intelligence
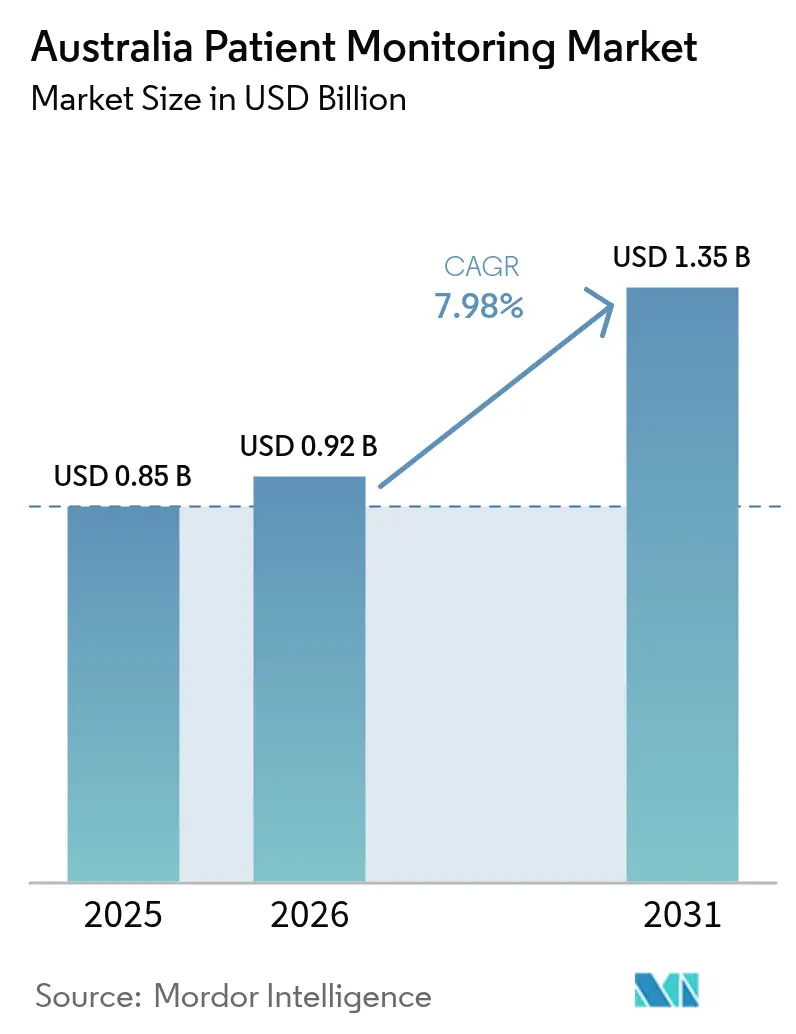
The Australia patient monitoring market size was valued at USD 0.85 billion in 2025 and estimated to grow from USD 0.92 billion in 2026 to reach USD 1.35 billion by 2031, at a CAGR of 7.98% during the forecast period (2026-2031). Momentum stems from accelerated 4G/5G coverage following the 3G network shutdown, permanent Medicare telehealth reimbursements and streamlined software-as-a-medical-device rules that shorten approval timelines. Public-sector grants for cybersecurity, direct-to-device satellite connectivity and hospital-at-home pilots encourage continuous multiparameter monitoring in urban and rural facilities. Intensifying partnerships between global manufacturers and local telehealth operators embed AI triage dashboards that reduce nuisance alarms and elevate nurse productivity.
Key Report Takeaways
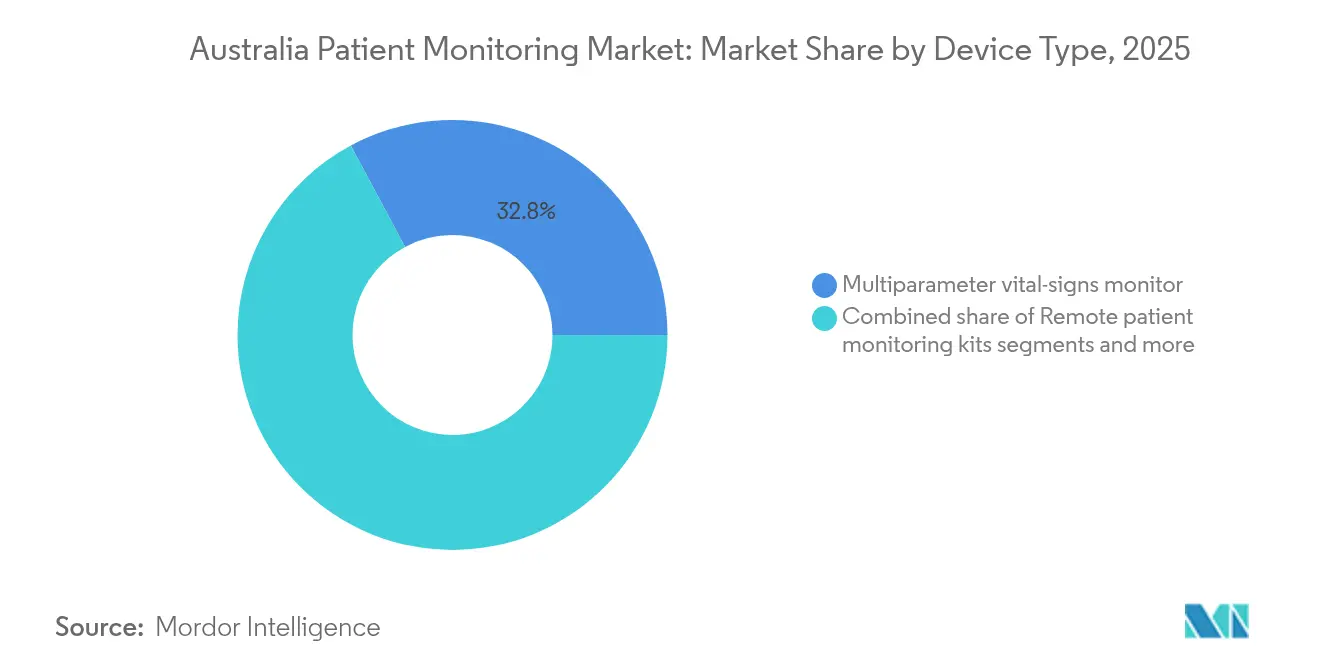
- By product type, multiparameter monitors led with 32.84% of Australia patient monitoring market share in 2025, while remote patient monitoring kits are on pace for an 8.05% CAGR through 2031.
- By modality, bedside systems represented 49.35% of the Australia patient monitoring market size in 2025; wearable and patch devices are forecast to expand at a 9.01% CAGR to 2031.
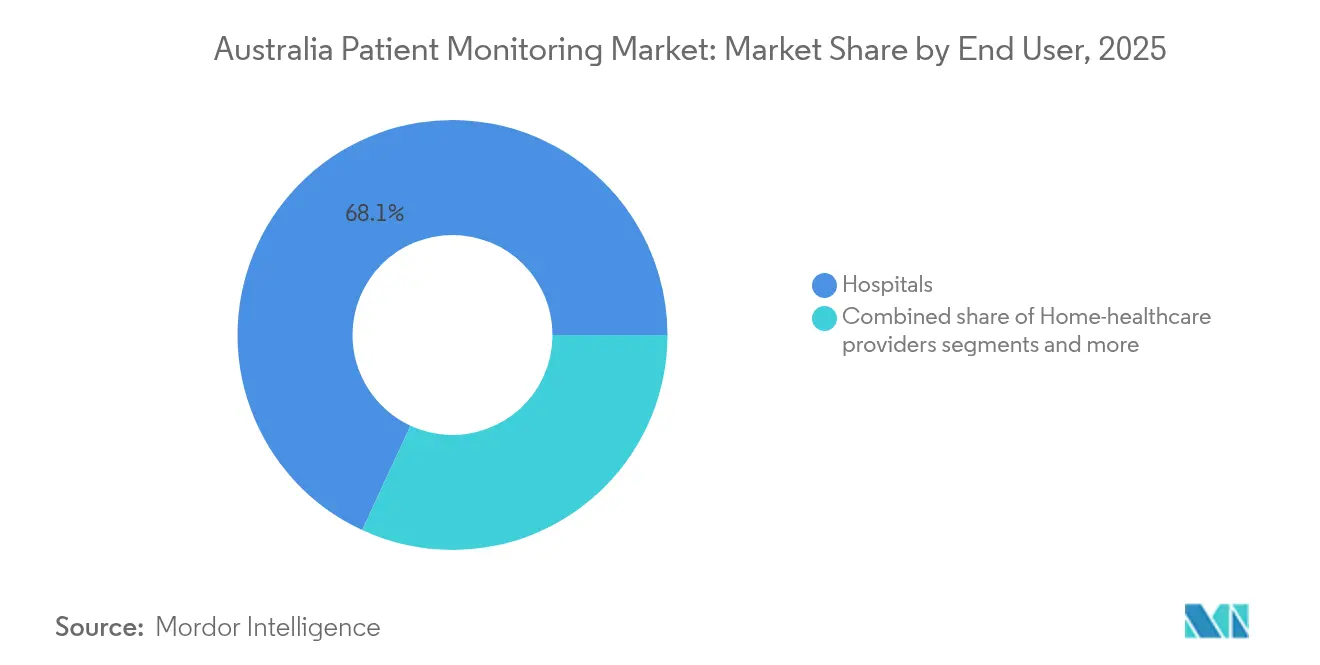
- By end user, hospitals held 68.10% of Australia patient monitoring market share in 2025, while home-healthcare providers register the fastest 8.18% CAGR over the outlook period.
- By application, cardiology captured 24.88% of the Australia patient monitoring market size in 2025; chronic-disease management is projected to grow at an 8.62% CAGR to 2031
Note: Market size and forecast figures in this report are generated using Mordor Intelligence’s proprietary estimation framework, updated with the latest available data and insights as of 2026.
Australia Patient Monitoring Market Trends and Insights
Drivers Impact Analysis*
| Driver | (~) % Impact on CAGR Forecast | Geographic Relevance | Impact Timeline |
|---|---|---|---|
| Rising burden of chronic diseases & ageing population | +2.1% | National, with higher impact in metropolitan areas | Long term (≥ 4 years) |
| Expansion of telehealth reimbursement & government digital health initiatives | +1.8% | National, with enhanced benefits for rural/remote areas | Medium term (2-4 years) |
| Rapid adoption of IoT-enabled wireless & wearable monitors | +1.5% | Urban centers initially, expanding to regional areas | Short term (≤ 2 years) |
| Hospital-at-home & shift toward home healthcare services | +1.3% | Metropolitan areas with strong digital infrastructure | Medium term (2-4 years) |
| AI-powered predictive analytics in Indigenous remote health programs | +0.9% | Remote and very remote areas, Northern Territory focus | Long term (≥ 4 years) |
| Emergence of smart wound-care patches for chronic ulcer monitoring | 0.4% | National, with emphasis on aged care facilities | Short term (≤ 2 years) |
| Source: Mordor Intelligence | |||
Rising burden of chronic diseases & aging population
Diabetes mortality among Indigenous Australians is 4.4 times higher than for non-Indigenous peers, intensifying demand for continuous glucose, cardiac and wound-healing surveillance. Federal investment of USD 50 million in a total artificial heart and USD 3 billion in chronic-wound management highlights cardiovascular priorities. Smart wound patches from RMIT detect inflammatory markers in real time for roughly 500,000 chronic-wound cases annually. Short-Term Restorative Care pilots preserved 99% of client independence, demonstrating technology’s cost-avoidance potential for elder care. Population aging therefore amplifies needs for predictive analytics that pre-empt emergency admissions.
Expansion of telehealth reimbursement & government digital-health initiatives
Permanent Medicare telehealth items and triple bulk-billing incentives for vulnerable citizens create durable revenue for remote patient monitoring services. Tasmania’s Care@home extension shows state-level scaling of infection surveillance with around-the-clock clinician oversight. The National Healthcare Interoperability Plan has delivered one-third of its milestones, upgrading My Health Record so device data flows seamlessly across locations. A USD 3.5 billion federal allocation to triple bulk-billing incentives further pushes providers toward connected care and away from on-site consults.
Rapid adoption of IoT-enabled wireless & wearable monitors
The October 2024 3G shutdown spurred manufacturers to retrofit pacemakers, CPAPs and telemetry systems with 4G/5G radios. Abbott’s glucose feeds now stream into Epic EHRs, removing manual uploads and improving metabolic management. BIOTRONIK’s BIOMONITOR IV slashes false arrhythmia alerts by 86% while preserving 98% clinical relevance. Direct-to-device satellite programs extend IoT reach into outback communities previously outside mobile footprints.
Hospital-at-home & shift toward home-healthcare services
Analysts calculate hospital-at-home could save USD 1 billion yearly in operating expense and USD 6.4 billion in deferred bricks-and-mortar spend by 2030 as 350,000 admissions migrate home. South Australia’s My Home Hospital has treated 15,000 patients with high satisfaction and released bed capacity for acute cases. The Smarter Hospitals Project studies workforce readiness for virtual wards, while Silverchain’s nurse-supervised infusions document practical pathways from pilot to scale. Activity-based funding guidance now embeds remote-monitoring codes, giving hospitals income certainty when care occurs off-campus.
Restraints Impact Analysis*
| Restraint | (~) % Impact on CAGR Forecast | Geographic Relevance | Impact Timeline |
|---|---|---|---|
| High device cost & limited private reimbursement | -1.2% | National, with higher impact in rural/remote areas | Medium term (2-4 years) |
| Increasing cybersecurity & data-privacy compliance costs | -0.8% | National, with emphasis on large healthcare networks | Short term (≤ 2 years) |
| Patchy broadband & digital infrastructure in rural Australia causing RPM dropout | -0.6% | Rural and remote areas, particularly Northern Territory/Western Australia | Long term (≥ 4 years) |
| Clinician alert fatigue and medico-legal liability concerns | -0.4% | Hospital-based settings, ICU and critical care units | Medium term (2-4 years) |
| Source: Mordor Intelligence | |||
High device cost & limited private reimbursement
Continuous glucose monitors and premium implantables remain expensive, especially for Indigenous patients with limited private cover. Modified Monash upgrades in 2025 raised bulk-billing rates in 34 regional towns, yet out-of-pocket device costs persist. Surveys show 80% of rural adults are digitally engaged but cite price and product complexity as leading adoption barriers. Private insurance seldom covers home-use monitoring hardware, stalling chronic-disease programs outside hospital walls.
Increasing cybersecurity & data-privacy compliance costs
Healthcare remains the nation’s most-targeted vertical, prompting USD 6.4 million in federal funding for information-sharing nodes across 750 hospitals and 6,500 clinics. The Cyber Security Act 2024 imposes minimum protections and breach-report mandates that inflate device R&D overhead. Expanded OAIC penalties amplify breach liabilities, while AI scribes used by 25% of GPs often lack TGA certification, creating medico-legal ambiguity.
*Our forecasts treat driver/restraint impacts as directional, not additive. The impact forecasts reflect baseline growth, mix effects, and variable interactions.
Segment Analysis
By Product Type: Multiparameter Monitors Lead Comprehensive Care
Multiparameter monitors contributed 32.84% to the Australia patient monitoring market size in 2025 thanks to plug-and-play compatibility with electronic health records and rapid display of ECG, SpO₂ and NIBP on a single screen. Remote patient monitoring kits will outpace all peers at an 8.05% CAGR by bundling Bluetooth wearables, AI triage engines and Medicare-reimbursable data services. Cardiac lines strengthen as BIOMONITOR IV delivers 86% nuisance-alarm reduction, elevating clinician trust in implantable loop recorders.
Hemodynamic platforms consolidate under BD’s USD 4.2 billion deal for Edwards’ Critical Care group, creating an advanced waveform analysis leader with cloud-ready integration. Fetal and neonatal innovators such as VitalTrace use real-time lactate to cut emergency C-sections in half. Respiratory and neuro lines now embed edge AI that flags apnea or neurologic decline seconds after onset. Wearable monitors inherit smartphone design cues yet comply with TGA’s unique-device-identifier rules, bridging consumer ergonomics and hospital governance across the Australia patient monitoring market.

By Modality: Wearables Challenge Bedside Dominance
Bedside systems retained 49.35% of Australia patient monitoring market share in 2025 because ICU workflows rely on trusted central stations. Wearable and patch monitors, however, advance at a 9.01% CAGR as patients demand untethered mobility and clinicians see earlier ambulation shorten average length of stay. Portable devices straddle step-down wards, slashing unplanned ICU returns by relaying spot-check vitals every two minutes versus manual four-hour intervals.
Implantable sensors such as Abbott’s AVEIR leadless pacemaker now include conduction-system pacing, widening therapeutic reach. Satellite-backed data links push wearable telemetry to cattle stations and mining camps, reflecting government dual-use space-industry strategy. Regulatory mutual recognition for FDA-cleared hardware speeds upgrades, letting providers abandon 3G-era boxes without repeating full conformity assessments.
By End User: Home Healthcare Disrupts Hospital Centricity
Hospitals captured 68.10% of Australia patient monitoring market share in 2025 through bulk procurement and ICU demand. Yet home-healthcare and aged-care operators post the swiftest 8.18% CAGR as virtual wards win public funding and family preference for at-home convalescence. Ramsay Health Care logged 9.4% FY 2024 revenue after linking remote rehabilitation pathways to acute discharges.
General-practice clinics leverage MyMedicare enrollment to boost telehealth rebates, with AI scribes freeing three minutes per consult. Telehealth corporations mirror New South Wales’ free virtual urgent-care blueprint, predicting 85,000 fewer emergency-department visits annually. Aged-care chains receive USD 13 million to pilot fall-detection lidars and sensor-enabled medication management, while public services adopt national digital-health blueprints.
By Application: Chronic-Disease Management Accelerates
Cardiology retained 24.88% of Australia patient monitoring market size in 2025 as pacemakers and Holters remained core. Chronic-disease management exhibits the fastest 8.62% CAGR because COPD, hypertension and diabetes programs shift to algorithm-guided home models fully reimbursed by the MBS. Neurology categories benefit from continuous EEG patches that detect seizure precursors, offering early evacuation for rural patients via the Royal Flying Doctor Service.
Respiratory applications rise on ResMed’s 10% Q4 2025 revenue growth from cloud-linked CPAP ecosystems. ICU modules install smart-alarm routing that filters 70% of non-actionable alerts, fighting burnout identified in systematic nurse reviews. Perioperative wards pilot 72-hour continuous SpO₂ and respiration patches, cutting post-op ICU transfers in half. Rehabilitation programs integrate inertial sensors to quantify home-based physio, aligning with the 99% functional-independence score seen in restorative-care trials.
Geography Analysis
Australia’s patient monitoring devices market demonstrates a pronounced urban-rural divide. Metro centers—Sydney, Melbourne, Brisbane, Perth and Adelaide—account for more than two-thirds of installs owing to robust fiber backbones, tertiary hospitals and specialist density. New South Wales’ statewide virtual urgent-care network alone is scheduled to add 200,000 RPM endpoints by 2030. Victoria’s virtual ED mirrors this scale by funneling vitals to cloud dashboards accessed by 200 aged-care homes.
Regional momentum improved after 34 communities received Modified Monash upgrades in March 2025, unlocking richer bulk-billing and clinician recruitment pools. Nevertheless, more than 50,000 connectivity complaints lodged with the telecommunications ombudsman in 2024 show persistent coverage gaps. Telstra–Starlink direct-to-device pilots now deliver 256 kbps bursts, supporting patch monitors in cattle stations that historically relied on paper vitals.
Northern Territory and Western Australia face vast distances and high Indigenous-care loads. The Central Australian Aboriginal Congress funds mobile clinics that tour eight remote settlements every eight weeks to provide diabetes monitoring and ulcer screening. Tasmania’s Care@home expansion reveals how smaller states can run seven-day virtual wards staffed by pharmacists, dietitians and nurse practitioners. Interoperability Plan milestones—14 achieved, 27 on track—lay nationwide healthcare-identifier rails, ensuring that telemetry captured in one state flows securely to another.
Regulatory Landscape
Australia regulates patient monitoring devices under the Therapeutic Goods Act 1989 and the Therapeutic Goods (Medical Devices) Regulations 2002, administered by the Therapeutic Goods Administration (TGA). Devices are classified by intended purpose under Schedule 2, including rules used for devices that monitor the state or progression of a disease or condition. Higher-risk systems face deeper conformity assessment and targeted application audits, with changes effective from 1 July 2024 that refocused mandatory audits toward high-risk devices and IVDs. For software-based patient monitoring and clinical decision support, TGA guidance updated in 2026 reinforced that software intended for clinical monitoring or diagnostic support typically requires ARTG inclusion, shaping how vendors manage updates, cybersecurity controls, and technical documentation.
Post-market controls are also tightening through traceability and surveillance requirements. Mandatory healthcare-facility reporting of medical device-related injuries or suspected injuries commenced on 21 March 2026, increasing formal incident capture for networked monitoring systems deployed in hospitals and virtual wards. In parallel, Unique Device Identification (UDI) requirements progressed through the Australian UDI framework, with mandatory labeling requirements for most devices commencing on 1 July 2026. This adds compliance obligations for manufacturers, sponsors, and healthcare providers managing device inventory and recalls across Australia.
Value Chain Analysis
The value chain starts with global and domestic manufacturers designing hardware (bedside monitors, wearables, implantables) and software (remote patient monitoring platforms, alarm management, analytics) to meet TGA Essential Principles under the Therapeutic Goods (Medical Devices) Regulations 2002 before ARTG inclusion and supply. Local sponsors commonly hold regulatory responsibility for imported systems, manage technical files and post-market obligations, and coordinate clinical evaluation and cybersecurity documentation, which becomes more significant for connected monitoring and software-based medical devices.
In Australia, distribution typically runs through national distributors and specialized third-party logistics providers that support medical-device storage, inventory management, and temperature-controlled shipment where required. This supply model serves public health services, private hospitals, GP/ambulatory settings, and home-care operators. Hospital procurement and deployment then drive downstream integration work, including EHR connectivity, interoperability with My Health Record-aligned workflows, and device fleet management across wards and virtual-care programs. With UDI rollout from July 2026, new data-capture needs appear across labeling, inventory systems, and provider receiving processes, while TGA supply-disruption management guidance raises the need for contingency planning for critical monitoring consumables, sensors, and replacement parts.
Competitive Landscape
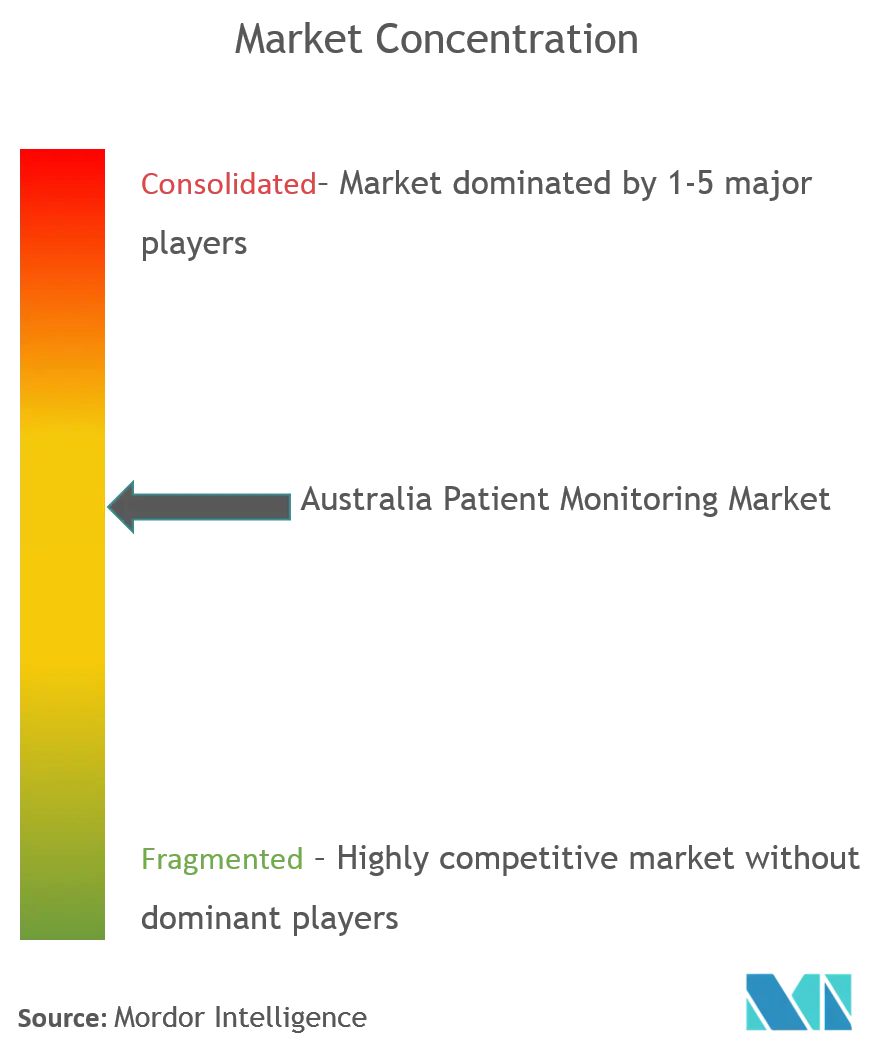
The Australia patient monitoring market is moderately fragmented yet trending toward consolidation. BD’s USD 4.2 billion purchase of Edwards Lifesciences’ Critical Care group creates a global hemodynamic powerhouse serving 10,000 hospitals. Medtronic–Philips partnerships integrate Nellcor pulse-oximetry and Microstream capnography into Philips IntelliVue monitoring suites, backed by a pledge program validating joint safety claims. BIOTRONIK trims false arrhythmia alerts through SmartECG AI, complementing ResMed’s cloud-backed adherence data as hospitals demand device-agnostic dashboards. Domestic innovators such as VitalTrace aim for 2027 TGA clearance, while RMIT-origin smart-wound startups exploit aging-related ulcers as white-space growth pockets.
Competitive edges increasingly hinge on cyber-secure APIs, open FHIR transports and ready-mapped My Health Record feeds. Vendors able to bundle AI triage, device management and reimbursement analytics under a single subscription appeal most to public purchasers operating on activity-based funding models across the Australia patient monitoring market.
Australia Patient Monitoring Industry Leaders
-
Koninklijke Philips N.V
-
Mindray Medical International Co. Ltd.
-
Nihon Kohden Corporation
-
Baxter International Inc.
-
Siemens Healthcare GmbH
- *Disclaimer: Major Players sorted in no particular order
Market Opportunities and Future Outlook
Virtual care procurement and digital hospital programs create whitespace for patient monitoring vendors that can deliver interoperable, cyber-secure, workflow-ready remote monitoring at scale. A practical indicator comes from public-sector rollout activity tied to hospital-at-home and remote monitoring programs, alongside state digital-health priorities such as eHealth Queensland's Digital Health Strategic Vision for Queensland 2026, which emphasizes digital-by-default care and integrated digital hospitals. In this setting, platforms and device ecosystems that stream multiparameter data, support clinician escalation pathways, and integrate with clinical systems tend to face less friction than standalone point solutions.
Policy and regulation are also reshaping commercial pathways and product design requirements. The Private Health Insurance (Medical Devices and Human Tissue Products) Rules (No. 1) 2026 took effect on 1 March 2026 through an updated Prescribed List framework, keeping reimbursement administration in focus for device suppliers targeting private hospital and insured patient pathways. On compliance, mandatory adverse-event reporting by healthcare facilities from 21 March 2026 and UDI labeling requirements commencing 1 July 2026 increase traceability and post-market signal generation, which benefits vendors that bundle device management, audit-ready data capture, and rapid field-action execution. Updated TGA guidance in 2026 on software-based medical devices further supports investment in regulated RPM software and AI-enabled monitoring features that can be maintained under controlled update and documentation processes.
Recent Industry Developments
- July 2026: Visionflex confirmed its clinical hardware rollout as part of the NSW Health Remote Patient Monitoring Digital Uplift program to support Hospital in the Home services. The implementation anchors clinically oriented peripherals into statewide virtual care workflows, expanding the installed base that can pair with continuous monitoring and telehealth assessment pathways.
- March 2026: Alcidion signed a contract with Gold Coast Health to implement its Miya Precision platform to support remote patient monitoring for virtual care delivered in patients' homes. The deal strengthens platform-led RPM deployments inside public health systems, reinforcing demand for integrated dashboards, escalation rules, and hospital-grade data governance.
- July 2024: The TGA implemented medical device regulation changes, including updated software classification rules and mandatory application audits for Class III devices. These changes increased the compliance focus for software-enabled monitoring and high-risk device submissions, influencing how manufacturers plan evidence generation and submission timelines for advanced monitoring systems.
Research Methodology Framework and Report Scope
Market Definition and Coverage
This market covers patient monitoring devices used in Australia to track and record patient parameters, either continuously or at set intervals, in clinical and home settings. The sizing is value-based and focuses on equipment used to capture and display patient status data.
Scope exclusions: We exclude general diagnostic equipment and imaging systems that are not primarily used for ongoing patient parameter monitoring.
Segmentation Overview
- By Product Type (Value, AUD mn)
- Multi-parameter Monitors
- Cardiac Monitoring Devices (ECG, Holter, MCT)
- Hemodynamic Monitoring Devices
- Fetal & Neonatal Monitors
- Neuro Monitoring Devices
- Respiratory Monitoring Devices
- Remote Patient Monitoring Kits & Platforms
- Vital Signs Monitors
- Wearable Patient Monitors
- By Modality
- Bedside / Stationary
- Portable / Compact
- Wearable / Patch
- Implantable Sensors
- By End User
- Hospitals & Public Health Services
- Private Hospitals & Day Surgery Centers
- Home Healthcare & Aged-Care Facilities
- Ambulatory Care & GP Clinics
- Telehealth Providers
- By Application
- Cardiology
- Neurology
- Respiratory Care
- Critical Care & ICU
- Chronic Disease Management (Diabetes, Hypertension, COPD)
- Perioperative & Anesthesia Monitoring
- Post-Acute & Rehabilitation
- By Technology
- Wired
- Wireless (Bluetooth, Wi-Fi)
- Cloud-connected / AI Analytics
Data Sources, Market Sizing, and Validation
Desk Research
We started by building a clean fact base on Australia healthcare delivery and device adoption using public sources that are easy to verify. Helpful inputs came from the Australian Institute of Health and Welfare for care setting mix, the Australian Government Department of Health and Aged Care for policy direction, and the Australian Bureau of Statistics for demographic and chronic condition context that shapes monitoring demand.
To translate those signals into market math, we also reviewed regulatory and safety references such as Therapeutic Goods Administration (TGA) device classifications and ARTG guidance, along with peer-reviewed clinical and health services research that describes monitoring use patterns in hospitals and at home. Company filings, investor presentations, and trusted media coverage were used to sanity-check product availability and broad pricing direction, and we supplemented this with subscription-based databases for company financials, patent activity, and import or export shipment indicators where needed. These examples are not exhaustive, and many other public and paid sources were also used for data collection, validation, and research clarification.
Primary Interviews and Surveys
Primary work was used to pressure-test what we saw in desk research, especially for device mix shifts, replacement cycles, and how remote patient monitoring is being bought and deployed. We spoke with a mix of manufacturers and channel participants, along with hospital and home care stakeholders, and the discussions helped confirm realistic price bands and usage intensity across major Australian care settings.
Distribution of primary research fieldwork respondents
| Company type | Respondent position |
|---|---|
| Top tier: 27% | CXOs: 12% |
| Mid tier: 51% | Functional/Unit leaders: 39% |
| Smaller Players: 22% | Managers: 49% |
Market-Sizing & Forecasting
The core model is built using a top-down approach where Australia healthcare activity and treated patient pools are translated into monitoring demand, and then split by common device groups such as cardiac monitoring, multi-parameter monitors, respiratory monitoring, and remote patient monitoring. Once that demand pool was formed, it was converted into value using realistic device price bands and replacement timing, and it was then aligned to how procurement typically happens across hospitals, clinics, and home healthcare.
To keep the totals practical, we corroborated the result with selective bottom-up approximations, such as a sampled ASP times volume check for a few high-usage device categories and a channel-level sense check on annual purchasing patterns. Inputs that mattered most included admitted patient activity and care setting mix, prevalence trends for cardiology and respiratory conditions, the share of monitoring shifting to home healthcare, average device life and refresh cycles, and observed price progression from product upgrades. Where data was thin for smaller device types, we used conservative penetration assumptions that were validated in interviews, and the gaps were handled by anchoring them to the closest comparable device class.
For forecasting, scenario analysis was used so the outlook could reflect different adoption speeds for remote monitoring and different capital spend cycles in hospitals. Assumption ranges were set from expert feedback, and then applied consistently year to year so the forecast stays repeatable and easy to update when new signals arrive.
Data Validation & Update Cycle
Before finalizing, the outputs were checked against independent signals like care activity trends, procurement direction, and realistic price movement, and then outliers were reviewed until they made sense in plain language. We also run variance checks across device types and end-user splits so one category does not grow in a way that contradicts known adoption or replacement behavior.
A multi-step internal review is followed, and follow-up calls are triggered when an assumption moves the market materially or conflicts with multiple interview inputs. Reports are refreshed annually, with interim updates when there are material policy, regulatory, or supply changes. Right before delivery, we do a final pass to capture the latest publicly available updates so the view stays current.
Mordor Intelligence's Australia Patient Monitoring Market Market Size Compared With Other Published Estimates
Published market sizes for Australia patient monitoring can look far apart, even when the topic sounds the same, because the scope line is drawn differently and the base year choices do not match. Differences also come from how remote monitoring is treated, how broad the device basket is, and whether the estimate is tied back to real healthcare activity signals.
The table shows a lower 2025 value than some broader published numbers, and in Mordor Intelligence's model the count is limited to patient monitoring device categories (including remote patient monitoring) rather than folding in wider diagnostic and imaging equipment. Another driver is that some sources anchor on a 2024 starting point and may apply more aggressive price and adoption progression without the same level of end-user validation on replacement cycles and hospital versus home mix, which can lift the headline value quickly.
Benchmark comparison
| Source | Market Size | Gaps in Research Methodology |
|---|---|---|
| Mordor Intelligence | USD 0.85 B (2025) | |
| Global Consultancy A | USD 1.20 B (2024) | Uses a different base year and tends to apply a broad device basket, which can pull adjacent wellness or consumer monitoring revenue into the same total, and it can also assume faster ASP uplift from tech refresh. |
| Industry Publisher B | USD 1.83 B (2024) | Built from a wider diagnostic and monitoring umbrella, which typically includes non-monitoring categories like imaging and other diagnostic systems, so the scope is not comparable to a patient monitoring-only device definition. |
Across the three figures, the main takeaway is that scope and starting-year choices explain most of the spread, and then the pricing and adoption assumptions do the rest. By keeping the market tied to clear device categories, care settings, and replacement behavior, the final number stays traceable to practical drivers that can be revisited when new evidence shows up.
Key Questions Answered in the Report
What is the projected value of Australia patient monitoring devices by 2031?
The market is expected to reach USD 1,347.2 million in 2031, expanding at an 7.98% CAGR from 2026.
Which product type currently dominates device demand in Australia?
Multiparameter monitors command the largest share at 32.84% of 2025 revenues.
Why are wearables growing faster than bedside monitors?
Wearables deliver mobility, reduce nurse workload and align with hospital-at-home models, delivering a 9.01% CAGR through 2031.
How does government telehealth funding influence demand?
Permanent MBS telehealth items and triple bulk-billing incentives create sustainable revenue for remote patient monitoring providers, boosting adoption.
What are the main cybersecurity challenges for device makers?
New regulations mandate minimum security features and breach reporting, raising compliance costs even as healthcare remains the most targeted sector.
Which end-user segment shows the highest growth?
Home-health and aged-care providers are expanding fastest with an 8.18% CAGR as virtual wards scale nationally.