
Market Overview
| Study Period | 2020 - 2031 |
|---|---|
| Forecast Data Period | 2026 - 2031 |
| Base Year Market Size (2025) | USD 6.68 Billion |
| Market Size (2026) | USD 6.87 Billion |
| Market Size (2031) | USD 8.43 Billion |
| Growth Rate (2026 - 2031) | 4.18 % |
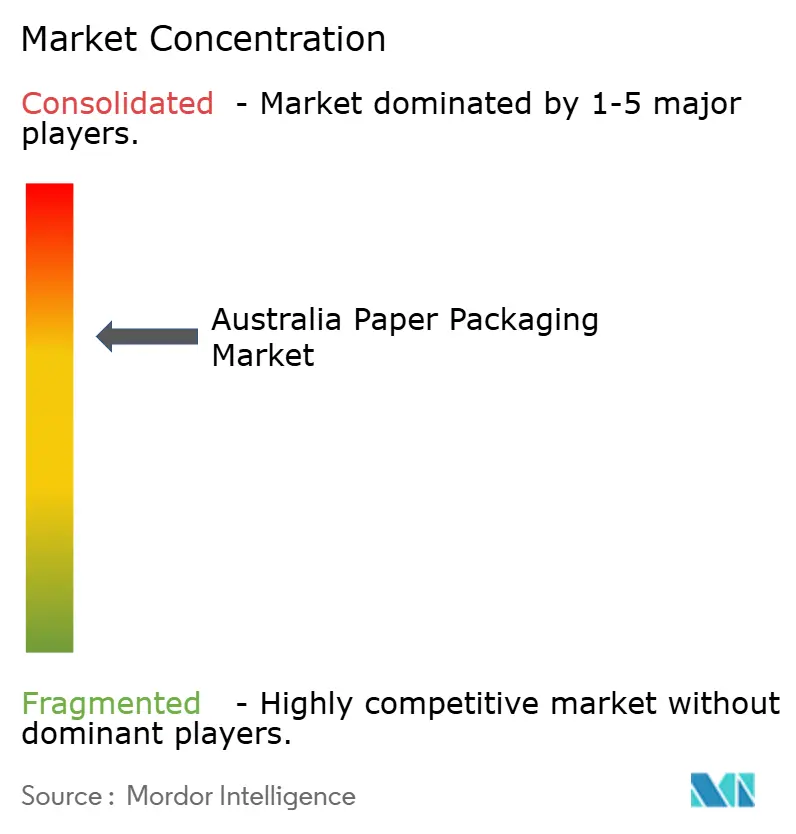
| Market Concentration | Medium |
Major Players *Disclaimer: Major Players sorted in no particular order Image © Mordor Intelligence. Reuse requires attribution under CC BY 4.0. | |
Australia Paper Packaging Market Analysis by Mordor Intelligence
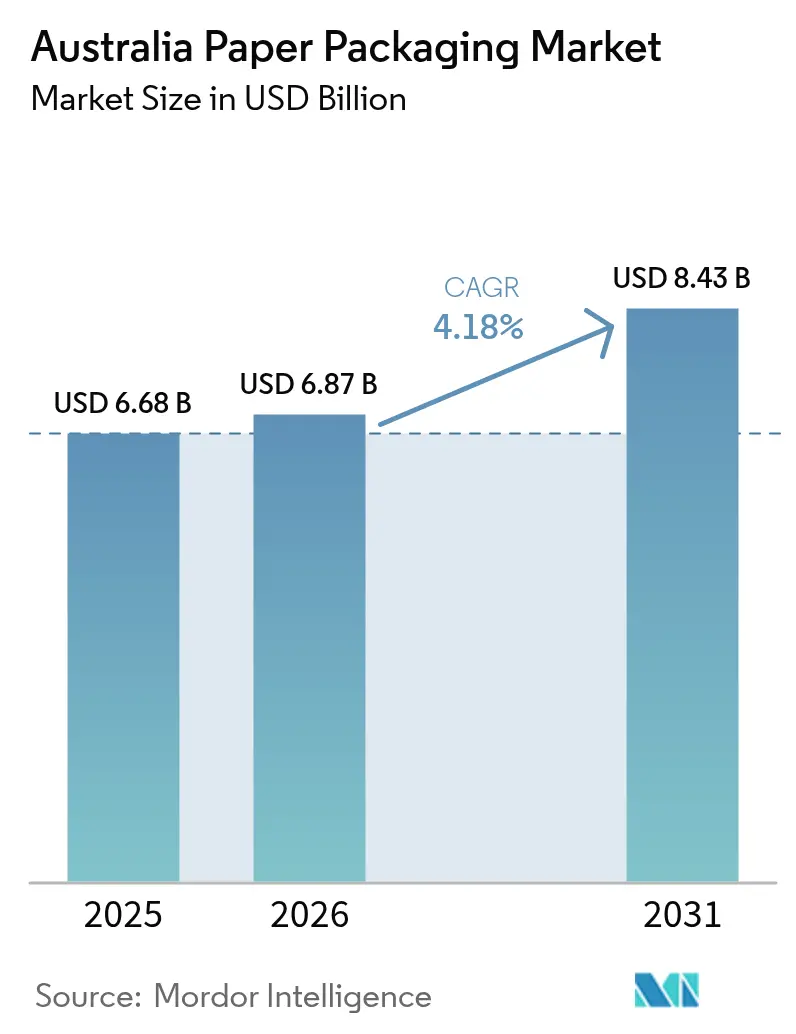
The Australia paper packaging market size is expected to grow from USD 6.58 billion in 2025 to USD 6.87 billion in 2026 and is forecast to reach USD 8.43 billion by 2031 at 4.18% CAGR over 2026-2031. E-commerce parcel traffic, statewide container-deposit schemes, and retailer circular-economy mandates are the primary forces reshaping business models as converters balance recycled-content targets with pharmaceutical-grade purity demands. Visy’s USD 117.3 million (AUD 175 million) Brisbane plant demonstrates how automation and digital printing are now essential for high-mix, short-lead-time orders, while the 2024 administration of Qenos removed a domestic polyethylene cost reference and accelerated paper substitution in flexible formats. Pulp import volatility and energy-price inflation continue to squeeze margins, yet fresh investments in aqueous and PVOH coatings are unlocking barrier performance that allows fibre to enter meal-kit insulation, aseptic beverages, and premium sauces. Forward-looking players are therefore rewiring supply chains around closed-loop recovery, serialization, and eco-modulation fees that reward low-impact substrates.
Key Report Takeaways
- By product type, corrugated boxes held 48.5% of the Australia paper packaging market share in 2025, whereas flexible paper packaging is projected to expand at a 5.01% CAGR through 2031.
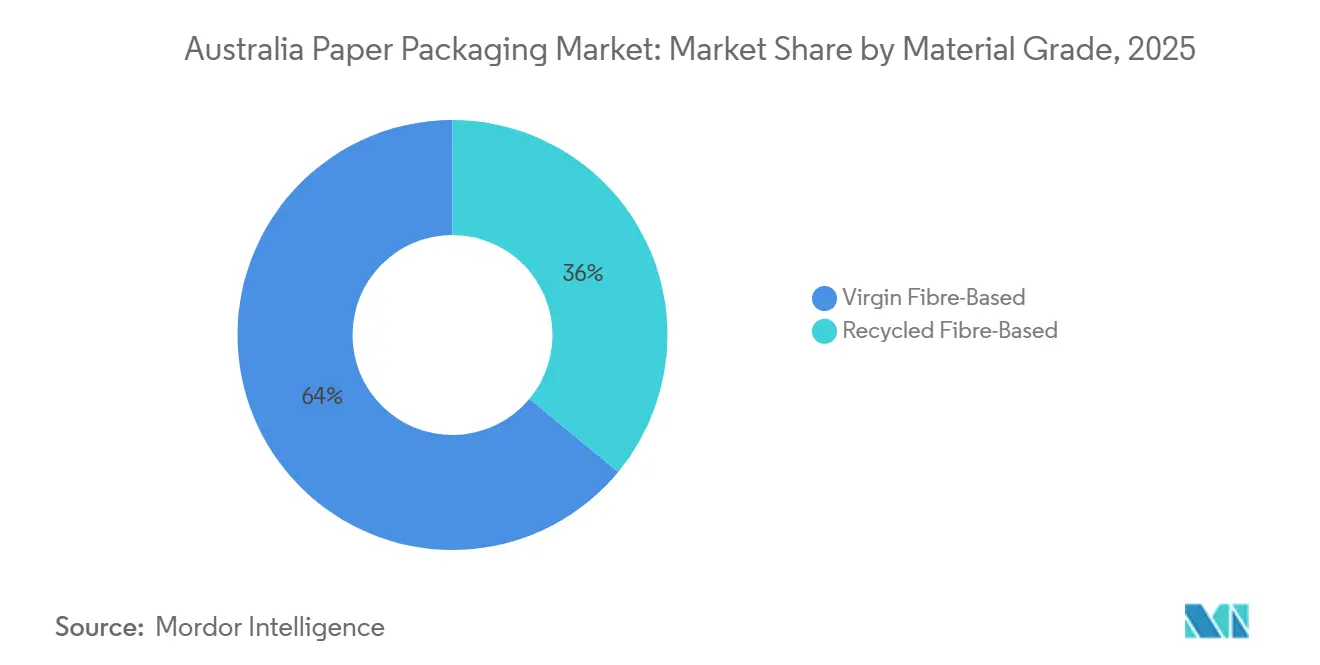
- By material grade, recycled fibre captured 64% of the 2025 Australia paper packaging market size, while virgin fibre is forecast to post the fastest growth at a 4.93% CAGR on rising pharmaceutical and premium-beverage demand.
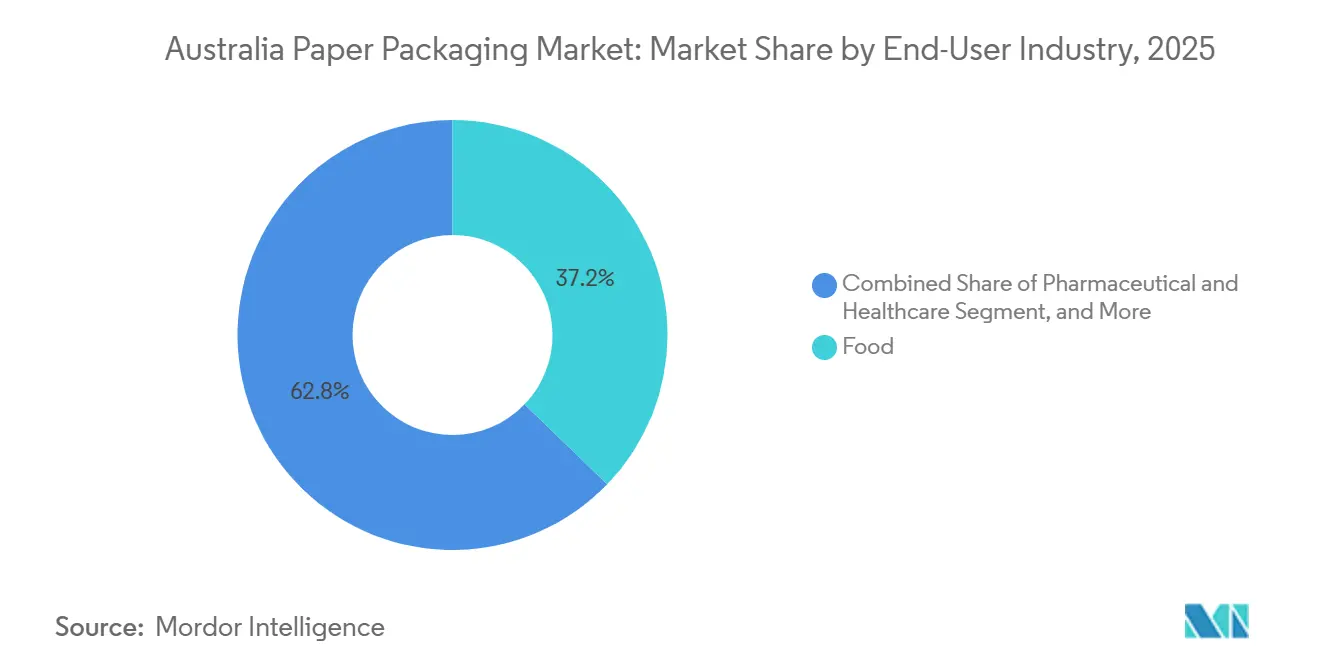
- By end-user industry, food applications accounted for 37.2% of the Australia paper packaging market share in 2025, but pharmaceutical and healthcare end uses are expected to register the highest 5.22% CAGR to 2031.
- By packaging format, secondary formats represented 46.8% of the 2025 Australia paper packaging market size, yet primary packaging is poised to advance at a 4.83% CAGR on carton serialization and fibre bottles.
- By company share, Visy, Amcor, Orora, and Pratt Industries together controlled just over half of 2025 revenue, indicating a moderately consolidated structure that still leaves room for niche innovators.
Note: Market size and forecast figures in this report are generated using Mordor Intelligence’s proprietary estimation framework, updated with the latest available data and insights as of 2026.
Australia Paper Packaging Market Trends and Insights
Drivers Impact Analysis*
| Driver | (~) % Impact on CAGR Forecast | Geographic Relevance | Impact Timeline |
|---|---|---|---|
| Rising Consumer Preference for Sustainable and Recyclable Packaging | +0.90% | National, with stronger uptake in urban centers (Sydney, Melbourne, Brisbane) | Medium term (2-4 years) |
| Booming Australian E-commerce Fulfilment Volumes | +1.10% | National, concentrated in New South Wales and Victoria distribution hubs | Short term (≤ 2 years) |
| Government Single-Use Plastic Bans Fuelling Paper Substitution | +0.80% | National, state-level implementation (New South Wales, Queensland, Victoria lead) | Short term (≤ 2 years) |
| Corporate Circular-Economy Targets Accelerating Fibre-Based Innovation | +0.60% | National, multinational FMCG and retail chains | Medium term (2-4 years) |
| Rapid Growth of Meal-Kit and Food-Delivery Services Increasing Demand for Insulated Paper Packs | +0.40% | National, urban concentration (Sydney, Melbourne, Brisbane) | Short term (≤ 2 years) |
| Retail Private-Label Expansion Requiring Cost-Efficient Shelf-Ready Paper Formats | +0.30% | National, major retailers (Woolworths, Coles, Aldi) | Medium term (2-4 years) |
| State-Level Container-Deposit Schemes Driving Demand for High-Barrier Paper Bottles | +0.20% | National, Tasmania completion mid-2025 | Long term (≥ 4 years) |
| Australia's Remote-Logistics Challenges Increasing Demand for Lightweight Cushioned Corrugated | +0.30% | National, pronounced in Western Australia, Northern Territory, regional Queensland | Medium term (2-4 years) |
| Source: Mordor Intelligence | |||
Rising Consumer Preference for Sustainable and Recyclable Packaging
Household purchasing data show that packaging displaying the Australasian Recycling Label covered 3.69 million tonnes of product in 2024, with paper and paperboard accounting for more than half of that weight and achieving a 66% recovery rate.[1]Australasian Packaging Covenant Organisation, “APCO Strategic Plan 2030,” apco.org.au Major retailers now leverage nearly universal private-label penetration to dictate packaging specifications, illustrated by Woolworths’ USD 1.34 billion (AUD 2.0-2.2 billion) FY2025 capital program that prioritizes shelf-ready corrugated able to keep produce rejection below 2%. Yet 1.3 million tonnes of fibre still entered landfill, exposing infrastructure gaps that brand owners increasingly view as reputational risk. The result is a pull effect on converters to lift post-consumer content while maintaining food-contact compliance, driving demand for cleaner material streams and certified virgin pulp.
Booming Australian E-commerce Fulfilment Volumes
Parcel volumes continued double-digit expansion through 2025, prompting converters to re-engineer box designs for automated sortation. Visy’s Brisbane plant can output 1 million recycled-content cartons daily, each printable in real time to reflect SKU-level personalization.[2]Visy Industries, “Investment Updates,” visy.com.au The shift is concentrating growth among large, automated sites, while smaller firms are pushed to niche runs or regional accounts. Remote logistics in Western Australia and the Northern Territory further favour micro-flute constructions that lower freight costs per cubic meter, a specification that was rare a decade ago but is now mainstream for national e-commerce accounts.
Government Single-Use Plastic Bans Fuelling Paper Substitution
State regulations banning polystyrene food ware and lightweight bags are converging on paper as the default alternative. Victoria’s CDS Vic processed more than 1 billion containers in its first year, and Queensland’s 2023 decision to include wine and spirits was the first in Australia to apply deposits to premium beverages. Tasmania’s 2025 rollout completes nationwide container-deposit coverage, forcing mills to improve aqueous coatings so cartons remain kerbside-recyclable without polyethylene liners. Early data reveal that liquid paperboard redemption trails glass, highlighting both an opportunity for high-barrier innovation and a need for clearer consumer messaging.
Corporate Circular-Economy Targets Accelerating Fibre-Based Innovation
Global brand pledges for net-zero and plastic reduction translate into procurement standards that reward fibre substrates. Tetra Pak’s 80%-paper aseptic design cuts carbon footprint one-third relative to foil laminates, strengthening the business case for cellulose-based barrier research. Local trials, such as MasterFoods’ paper sauce sachet with 58% less plastic, prove that format migration can reach even high-viscosity condiments. The Australian Packaging Covenant Organisation’s eco-modulation fees reinforce the economic logic by penalizing hard-to-recycle configurations, giving converters a monetary rationale for CAPEX in dispersion-coating and de-inking lines.
Restraints Impact Analysis*
| Restraint | (~) % Impact on CAGR Forecast | Geographic Relevance | Impact Timeline |
|---|---|---|---|
| Volatility in Domestic Pulp and Recovered Paper Prices | -0.70% | National, import-dependent mills in New South Wales, Victoria | Short term (≤ 2 years) |
| Competition from Emerging Bio-Based Plastics | -0.30% | National, food-service and FMCG segments | Medium term (2-4 years) |
| Limited Australian Recycling Infrastructure Capacity | -0.50% | National, pronounced in South Australia, Tasmania, Northern Territory | Medium term (2-4 years) |
| Rising Energy Costs Squeezing Mill Margins | -0.40% | National, energy-intensive mills in Victoria, New South Wales | Short term (≤ 2 years) |
| Chronic Shortage of Skilled Maintenance Staff Limiting Mill Uptime | -0.20% | National, regional mills outside capital cities | Long term (≥ 4 years) |
| Source: Mordor Intelligence | |||
Volatility in Domestic Pulp and Recovered Paper Prices
Australian pulp imports dropped 30.2% year-ended February 2024, yet average landed cost rebounded to USD 670 per tonne after strikes in Finland and Chile constrained global supply, exposing mills to currency and commodity risk simultaneously.[3]Australian Bureau of Statistics, “International Trade in Goods and Services,” abs.gov.au Recovered-paper swings are sharper: Victoria’s mixed-paper price collapse in early 2023 reversed only when export-license fees of USD 12,790 per new permit (AUD 19,090) took effect in July 2024. Mills thus face unpredictable input costs that complicate long-term supply contracts and scramble CAPEX planning when margins must absorb de-inking or landfill disposal for contaminated loads.
Limited Australian Recycling Infrastructure Capacity
Export bans on mixed paper diverted volumes into domestic channels already running near capacity, with 1.3 million tonnes of fibre still landfilled in 2024 despite a 66% recovery rate. Visy’s USD 28.5 million (AUD 42.5 million) Coolaroo upgrade added 180,000-tonne pulping capacity in Victoria, yet Tasmania, the Northern Territory, and regional Western Australia remain reliant on long-haul freight to reach processing nodes. Mandatory recycled-content targets of 60% in Year 1 and 75% by 2040 will tighten material supply further, pressuring states to co-invest in sortation and de-inking or risk shortfalls that inflate costs and erode competitiveness.[4]Department of Climate Change Energy the Environment and Water, “National Packaging Targets Consultation,” dcceew.gov.au
*Our forecasts treat driver/restraint impacts as directional, not additive. The impact forecasts reflect baseline growth, mix effects, and variable interactions.
Segment Analysis
By Material Grade: Virgin Fibre Captures Premium Growth
Virgin pulp substrates represented the minority share in 2025 yet are forecast to grow 4.93% CAGR through 2031 as pharmaceutical and premium-beverage brands demand certified-clean inputs to meet traceability rules set by the Therapeutic Goods Administration. The Australia paper packaging market size for virgin fibre formats is therefore expanding even as eco-modulation fees reward post-consumer content. In response, integrated players are blending higher-quality recovered streams with imported kraft to balance purity and cost.
Recycled fibre still accounted for 64% of 2025 revenue thanks to mature corrugated demand and retailer mandates, but contamination and odor concerns limit use in unit-dose healthcare packaging. Tetra Pak’s foil-free aseptic carton relies on virgin kraft for coating adhesion, while Zipform’s 95%-fibre bottle likewise specifies virgin to achieve burst strength needed for carbonated drinks. Unless domestic recovery infrastructure can lift purity rates, converters will continue to rely on blended solutions that temper virgin growth without displacing it outright.


By Product Type: Flexible Paper Surges on Barrier Wins
Corrugated remained the revenue anchor at 48.5% of the 2025 Australia paper packaging market share, yet flexible formats are projected to expand at 5.01% CAGR, the fastest among product types. Breakthroughs in dispersion-coated liners enabled HelloFresh’s kerbside-recyclable insulation pouch and BioPak’s PFAS-free hot-cup barrier, converting applications once locked into polyethylene laminates.
Folding cartons benefit from serialization mandates but grow more slowly, while liquid cartons face redemption-rate headwinds that spur technical refinements such as 2-4 g m-² aqueous coatings. Meanwhile, e-commerce shifts are steering corrugated design toward lighter grammages and micro-flute profiles that reduce freight cost per delivered item. The net result is a portfolio diversification in which converters balance high-volume board with high-margin barrier pouches.
By End-User Industry: Healthcare Leads Growth Curve
Food maintained a 37.2% revenue share in 2025, yet pharmaceuticals are poised for 5.22% CAGR on the back of unit-level serialization and tamper-evident mandates. The Australia paper packaging market size for healthcare cartons will therefore rise faster than any other end use, creating demand spikes for low-migration virgin substrates and digital print capability for variable data.
Premium spirits, personal care, and household items are also tilting toward paper as retailers enforce single-material shelf-ready guidelines. Coles’ adoption of VektroPack and Woolworths’ multi-year CAPEX on fresh-produce handling underscore how private-label clout translates into supplier compliance, pushing converters to tailor barrier features for moisture or oil resistance while hitting recycled-content thresholds.

By Packaging Format: Primary Rises in a Secondary World
Secondary packaging commanded 46.8% of 2025 revenue, reflecting its dominance in retail and e-commerce logistics. Yet primary formats are forecast to grow 4.83% CAGR as fibre bottles, serialized folding cartons, and kerbside-recyclable pouches displace plastic. Visy’s Brisbane site, geared for one-piece flow and rapid changeover, exemplifies how high-output corrugated remains indispensable even as unit-dose innovations capture headlines.
Tertiary transit solutions expand more modestly given the rise of reusable plastic crates in closed loops. However, demand spikes for pallet-grade sheets still surface in remote mining and agriculture where wood crate alternatives fail cost or sustainability screens. Overall, converters now stage portfolios across three formats, allocating capital to whichever captures the next regulatory or retailer push.
Geography Analysis
New South Wales and Victoria together remained the demand core in 2025, absorbing e-commerce parcels and hosting the densest FMCG hubs. Visy’s Brisbane megasite nonetheless elevates Queensland’s role as a production springboard for eastern-seaboard fulfilment, signalling a northward shift in capacity deployment. South Australia’s 76.4% container-return rate showcases how early policy fosters stable feedstock, while the ACT’s 22% redemption for liquid paperboard flags that multilayer formats still confuse consumers, curtailing fiber recovery.
Tasmania’s mid-2025 container-deposit launch made Australia the first continent with 100% CDS coverage, anchoring demand for high-barrier cartons designed for deposit loops. Western Australia and the Northern Territory continue to wrestle with freight premiums that favour lower-basis-weight corrugated, encouraging mills to adopt micro-flute technology that trims shipping mass without sacrificing compression strength.
Infrastructure gaps remain stark: Victoria gained 180,000 tonnes of new pulping capacity from Visy in 2023, yet Tasmania and northern regions still haul recovered fiber long distances, adding cost and carbon. If mandatory 75% recycled-content rules pass by 2027, states lacking sortation will face material deficits that could inflate converter costs and erode competitiveness until new plants come online.
Regulatory Landscape
Australia paper packaging operates under a tightening mix of co-regulation and emerging mandatory stewardship. APCO continues to administer the Australian Packaging Covenant under the National Environment Protection (Used Packaging Materials) Measure 2011 (NEPM), while the Commonwealth packaging-reform process is moving toward nationally consistent regulation following DCCEEW-led consultation, in which a large majority of respondents supported a Commonwealth-led approach.
At the state level, New South Wales enacted the Product Lifecycle Responsibility Act 2025 (No 22), creating a stewardship framework with powers that can extend to packaging design, labeling, and supply obligations for brand owners. Federally, the Extended Producer Responsibility Scheme for Packaging (No Time to Waste) Bill 2026 was introduced on 13 May 2026 and referred to the Senate Environment and Communications Legislation Committee, signaling stronger extended-producer-responsibility direction alongside chemicals controls implemented via IChEMS that can restrict substances used in packaging, including in food-contact applications.
Competitive Landscape
The market is moderately consolidated, with the top four players holding a bit more than half of 2025 revenue. Visy’s USD 1.34 billion (AUD 2 billion) decade program spans recycling, board, and glass, positioning it to supply closed-loop fiber and capitalize on e-commerce expansion. Amcor’s USD 13 billion Berry Global deal adds rigid plastics globally but leaves Australian fiber films largely untouched, offering little direct challenge to domestic board specialists. Orora’s USD 87.1 million (AUD 130 million) cans expansion underscores a pivot into aluminium, ceding some corrugated share to integrated recyclers and mid-tier converters.
Pratt Industries continues to import know-how from its U.S. plants, focusing on 100% recycled linerboard to meet retailer mandates. Niche innovators such as Zipform and BioPak pursue barrier breakthroughs the former with a 95%-paper bottle and the latter with PHA-lined cups certified for home composting, but scale remains contingent on brand adoption and consumer perception shifts.
The Smurfit Kappa and WestRock merger will raise the bar on global cost efficiency, pushing Australian converters to emphasize short-run agility, high-graphic print, and localized recovery networks to defend margins.
Australia Paper Packaging Industry Leaders
Visy Industries Holdings Pty Ltd
Amcor plc
Orora Limited
Abbe Corrugated Pty Ltd
Pro-Pac Packaging Limited
- *Disclaimer: Major Players sorted in no particular order

Market Opportunities and Future Outlook
Policy and compliance changes are creating clear whitespace around recyclability-by-design, chemical restrictions, and traceability. The May 2026 introduction of the Extended Producer Responsibility Scheme for Packaging (No Time to Waste) Bill 2026, alongside DCCEEW-led packaging-regulation reform, is pushing brand owners and converters toward packaging that can be evidenced through reporting, clearer labeling, and design-for-recovery. This reinforces demand for fibre formats aligned to APCO guidance and the Australasian Recycling Label system.
A second opportunity band sits in domestic capacity, regionalization, and higher-purity recovered-fibre streams as export and contamination controls tighten. The Recycling and Waste Reduction (Export-Waste Paper and Cardboard) Rules 2024, including a 5% contamination threshold taking effect in July 2026 for exported regulated waste paper and cardboard, increases the value of better sorting and de-inking and supports local processing investments. Visy’s AUD 30 million upgrade to its 100% recycled paper mill on Gibson Island in September 2025 and the opening of a packaging hub in Devonport, Tasmania in February 2026 illustrate this shift, while Opal also announced a new cartons manufacturing facility in Moorebank, New South Wales (27,233 square meters) targeted for operations in 2026. Technical whitespace is also visible in barrier and food-contact compliance, as APCO advanced PFAS phase-out discussions in 2026, increasing demand for fibre-based coatings and functional barriers that keep packs recyclable while meeting performance requirements in food and healthcare packaging.
Recent Industry Developments
- May 2026: Parliament of Australia introduced the Extended Producer Responsibility Scheme for Packaging (No Time to Waste) Bill 2026 and referred it to the Senate Environment and Communications Legislation Committee. The bill signals a move toward stronger national stewardship obligations, increasing the compliance emphasis on packaging design, labeling, and reporting across brand owners and converters.
- February 2026: Visy opened a new packaging hub in Devonport, Tasmania to supply cardboard packaging for local food, beverage, and agricultural producers. The investment adds regional converting capability and supports shorter lead times and reduced freight dependence for primary producers outside mainland manufacturing corridors.
- September 2025: Visy completed a AUD 30 million upgrade to its 100% recycled paper mill on Gibson Island, Queensland. The upgrade increases the range of recycled-paper options available to packaging customers, strengthening domestic recovered-fibre utilization amid tighter quality and recycled-content requirements.


Research Methodology Framework and Report Scope
Market Definition and Coverage
For this study, the market covers the value of paper-based packaging sold and used in Australia, including formats such as cartons, corrugated boxes, flexible paper packaging, and liquid cartons across major end uses.
Scope exclusions: We exclude non-paper packaging materials (such as plastics, metal, and glass) and any packaging-related machinery or printing equipment revenues.
Segmentation Overview
- By Material Grade
- Virgin Fibre-Based
- Recycled Fibre-Based
- By Product Type
- Folding Cartons
- Corrugated Boxes
- Flexible Paper Packaging
- Liquid Cartons
- By End-User Industry
- Beverage
- Food
- Pharmaceutical and Healthcare
- Personal Care and Household Care
- Other End-User Industries
- By Packaging Format
- Primary Packaging
- Secondary Packaging
- Tertiary / Transit Packaging
Data Sources, Market Sizing, and Validation
Desk Research
Desk research was used to build a factual base for Australia packaging demand and supply signals, then assumptions were stress-tested in follow-up calls. We reviewed public sources such as the Australian Bureau of Statistics for manufacturing and trade series, the Australian Packaging Covenant Organisation updates for packaging targets and reporting, and government environment department publications tied to waste, recycling, and policy changes.
To link packaging demand to end markets, we also referenced customs and trade statistics, peer reviewed packaging and materials journals, and industry body websites focused on paper, fiber, and recycling. Company annual reports, investor presentations, and press releases were used to understand capacity moves, pricing commentary, and product mix changes. In addition, we used a paid subscription for company financials and another for shipment level import and export data to cross-check directionally where public datasets were not granular enough. These desk sources are illustrative, and we also relied on other public materials for cross-checking, clarification, and validation.
Primary Interviews and Surveys
Primary interviews and structured surveys were conducted with packaging converters, raw material participants, distributors, and large end users serving food, beverage, personal care, and healthcare. The discussions were used to confirm what buyers are actually purchasing in paper formats, how prices are moving, and whether substitution to paper is happening in practice versus only being announced. Inputs were then used to tighten the assumptions applied in the Australia model.
Distribution of primary research fieldwork respondents
| Company type | Respondent position |
|---|---|
| Top tier: 33% | CXOs: 13% |
| Mid tier: 49% | Functional/Unit leaders: 31% |
| Smaller Players: 18% | Managers: 56% |
Market-Sizing & Forecasting
Sizing was built using a top-down approach where end-market demand indicators in Australia were translated into paper packaging consumption value, then checked against supply-side reality. The model starts with packaging format demand (primary, secondary, and transit) and then allocates value into paper product formats using mix shares validated through interviews.
Key inputs used (as examples) included corrugated and carton demand from e-commerce and retail shipment patterns, food and beverage volume trends, recycling and recovered paper availability signals, announced capacity additions and closures, and observed price movements for paper grades and converted packaging. Average selling prices were not kept flat, instead a stepwise ASP logic was applied by format where contract resets and input cost pass-through are common. Where a segment had limited public disclosure, gaps were handled using conservative interpolation.
For forecasting, scenario analysis was used because packaging demand in Australia is closely influenced by policy, substitution timelines, and cost cycles. The base case was shaped by primary feedback on price pass-through timing, recycled content targets, and customer switching behavior, then corroborated with selective bottom-up checks using sampled ASP times volume for a set of packaging formats to keep totals realistic.
Data Validation & Update Cycle
Before sign-off, outputs were tested through multiple checks, including comparisons against independent demand signals such as trade flows, packaging consumption proxies, and announced capacity utilization direction. When the model produced a sharp step change that could not be explained by costs, regulation, or end-use volume, the assumption was flagged and reworked, and sources were re-contacted when the gap remained material.
Each report is put through a multi-step analyst review so definitions, units, and currency treatment stay consistent across years. The study is refreshed annually, with interim updates when a major policy change, a large capacity event, or a sustained pricing swing is observed. Right before delivery, a final pass is performed so the published numbers reflect the latest available public data and validated market feedback.
Mordor Intelligence's Australia Paper Packaging Market Size Versus Other Published Estimates
Published market values for Australia paper packaging can differ even when the topic sounds the same, because the cut of the market and the timing of price updates are not aligned. Differences also show up when one estimate leans more on shipments and another relies more on end-use demand signals, which affects what each model counts as true consumption.
A common gap driver is how paper packaging formats are grouped, for example whether liquid cartons and flexible paper packaging are fully counted or treated as a smaller add-on. Another driver is the handling of currency timing and ASP progression, since packaging prices often reset in steps during the year and using a single annual average can pull the value up or down. By keeping an annual refresh rhythm, applying format-level ASP steps, and re-checking outliers through follow-up calls, Mordor Intelligence arrives at a 2025 value that is less sensitive to short-lived price spikes and more tied to validated demand patterns.
Benchmark comparison
| Source | Market Size | Gaps in Research Methodology |
|---|---|---|
| Mordor Intelligence | USD 6.68 B (2025) | |
| Global Consultancy A | USD 6.08 B (2023) | Uses an earlier base year and a longer historical window, so later price resets and recent mix shift toward transit packaging may be under-reflected in the starting value. |
| Industry Publisher B | USD 6.19 B (2025) | Broader paper and paperboard packaging scope with different type groupings and a slower price update cadence, which can dilute format-level ASP movements specific to cartons and corrugated. |
Across the three figures, most of the spread is explained by timing and what each model assumes for price pass-through by format, followed by smaller but meaningful scope boundaries around paper-based formats. Using clear format definitions, repeatable demand indicators, and structured checks with market participants helps keep the estimate traceable to inputs that can be re-tested when conditions change.


Key Questions Answered in the Report
What is the forecast value of the Australia paper packaging market by 2031?
It is projected to reach USD 8.43 billion, growing at a 4.18% CAGR between 2026 and 2031.
Which segment will record the fastest growth through 2031?
Pharmaceutical and healthcare applications are expected to expand at a 5.22% CAGR thanks to serialization rules.
How large is the corrugated box share in 2025?
Corrugated boxes commanded 48.5% of total revenue in 2025.
Why are flexible paper formats gaining traction?
Barrier-coating breakthroughs now allow fibre pouches and insulation to replace polyethylene laminates without sacrificing performance.
Which company is investing most heavily in Australian recycling capacity?
Visy is leading with a USD 1.34 billion decade-long program that spans paper, board, and glass recovery assets.
What is the main risk to growth for converters?
Volatile pulp and recovered-paper prices create margin uncertainty that can delay capital projects.
Page last updated on:


 Your data is secure and never sold or shared.


