
Market Overview
| Study Period | 2020 - 2031 |
|---|---|
| Forecast Data Period | 2026 - 2031 |
| Base Year Market Size (2025) | 4.63 Billion tonnes |
| Market Volume (2026) | 5.01 Billion tonnes |
| Market Volume (2031) | 7.39 Billion tonnes |
| Growth Rate (2026 - 2031) | 8.11 % |
| Market Concentration | Medium |
Major Players *Disclaimer: Major Players sorted in no particular order Image © Mordor Intelligence. Reuse requires attribution under CC BY 4.0. | |
Australia Paper And Paperboard Packaging Market Analysis by Mordor Intelligence
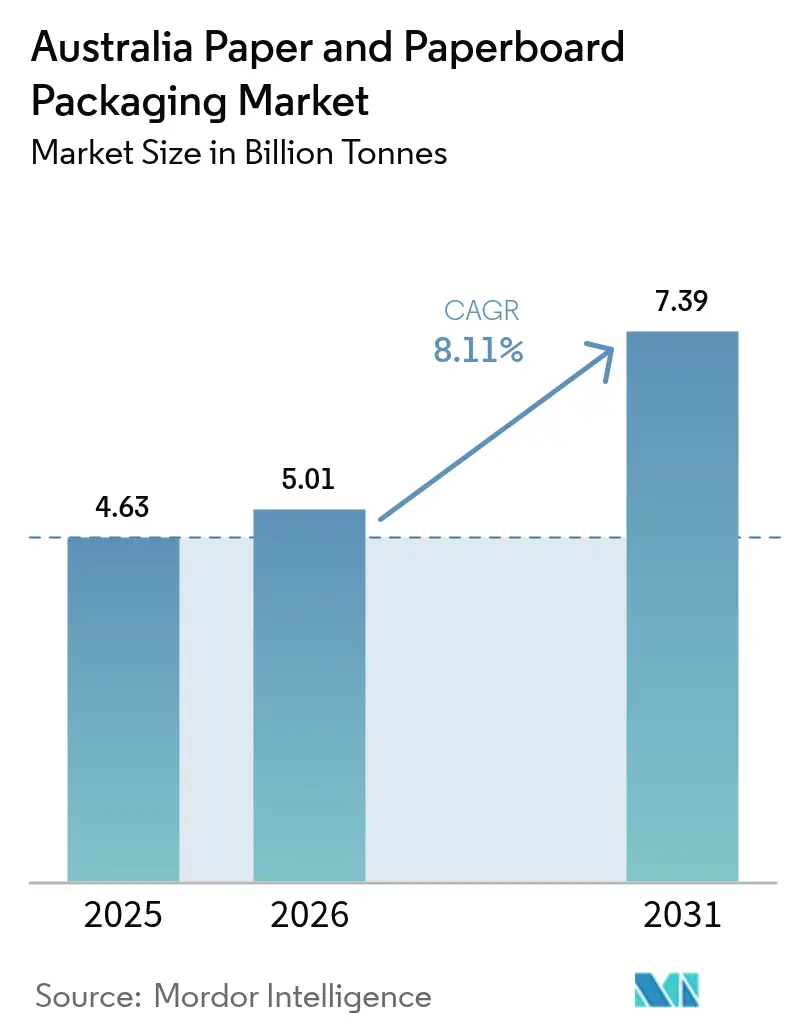
The Australia paper and paperboard packaging market size is expected to grow from 4.63 billion tonnes in 2025 to 5.01 billion tonnes in 2026 and is forecast to reach 7.39 billion tonnes by 2031 at 8.11% CAGR over 2026-2031. Growth stems from national plastic-replacement mandates, a sharp rise in online retail parcels, and brand owner commitments to circular-economy goals. State-level bans on single-use plastics, together with Australia’s 100% recyclability target for packaging by 2025, have tilted material choice toward fiber substrates. E-commerce spending of USD 69 billion in 2024 fueled corrugated box demand, while retailer interest in shelf-ready formats supported secondary packs. At the same time, mandatory recycled-content thresholds taking effect from 2026 incentivize vertically integrated fiber recovery and favor producers that control collection networks. Competitive dynamics have intensified after the July 2024 Smurfit WestRock merger and Opal’s deployment of high-speed digital presses, spurring industrywide investment in automation and print-on-demand capability.[1]
Key Report Takeaways
- By product type, corrugated boxes captured 41.68% of the Australia paper and paperboard packaging market share in 2025.
- By material grade, Australia paper and paperboard packaging market size for the virgin folding boxboard segment is projected to grow at 8.62% CAGR between 2026-2031.
- By packaging format, primary retail packs captured 36.12% of the Australia paper and paperboard packaging market share in 2025.
- By end-user industry, Australia paper and paperboard packaging market size for the e-commerce and retail segment is projected to grow at 9.74% CAGR between 2026-2031.
Note: Market size and forecast figures in this report are generated using Mordor Intelligence’s proprietary estimation framework, updated with the latest available data and insights as of 2026.
Australia Paper And Paperboard Packaging Market Trends and Insights
Drivers Impact Analysis*
| Driver | (~) % Impact on CAGR Forecast | Geographic Relevance | Impact Timeline |
|---|---|---|---|
| Rising demand from on-the-go food service | +1.2% | National, concentrated in urban centers | Short term (≤ 2 years) |
| Brand owner shift toward plastic-replacement goals | +1.8% | National, led by multinational FMCG companies | Medium term (2-4 years) |
| E-commerce parcel volume surge post-2025 | +2.1% | National, strongest in NSW, Victoria, Queensland | Short term (≤ 2 years) |
| Mandatory recycled-content targets (2026 onward) | +1.5% | National regulatory framework | Medium term (2-4 years) |
| Automation of digital print lines in SME converters | +0.9% | Regional manufacturing hubs | Long term (≥ 4 years) |
| Retailer adoption of shelf-ready packaging mandates | +0.8% | National retail chains | Medium term (2-4 years) |
| Source: Mordor Intelligence | |||
Rising Demand from On-the-Go Food Service
Single-serve and takeaway consumption continue to climb as quick-service restaurant chains and delivery platforms proliferate across metropolitan areas. Foldable cartons and grease-resistant wraps are displacing polystyrene clamshells, satisfying both regulatory bans and consumer preference for fiber-based packs. MasterFoods’ paper squeeze packs cut plastic content by 58% and illustrate brand willingness to pivot fast when legislative or reputational pressure looms.[2] Converter backlogs for coated folding boxboard confirm sustained order momentum, while portability requirements encourage barrier-coating innovation rather than thickness increases. The upshot is durable volume growth in small-format paper substrates that command premium price points and protect food safety.
Brand Owner Shift Toward Plastic-Replacement Goals
Global FMCG companies active in Australia continue reshaping portfolios to reach science-based emissions targets and to pre-empt reputational risk. The Australian Packaging Covenant Organisation reported a 40% reduction in problematic single-use plastics versus the 2017-18 baseline, with the void predominantly filled by recyclable or compostable paper solutions. Amcor’s tie-up with Kolon Industries to develop chemically recycled polymers underscores how incumbents hedge bets across material types, yet the same R&D program bolsters paper’s role by dematerializing rigid plastic from secondary packs. Liquid cartons and rigid paperboard gift boxes benefit most, capturing spend that once flowed into PET jars and thermoformed trays.
E-commerce Parcel Volume Surge Post-2025
Australia Post delivered a record 1.3 billion parcels in 2024, equal to USD 69 billion in online spend, and warehouse build-outs continue for click-and-collect fulfillment. Corrugated flute demand tracks these parcel flows, prompting Visy and Opal to commission robotic case erectors and in-line print-inspect systems that raise throughput. Retailers negotiate lighter flute profiles to control freight costs, pushing mills toward higher performance kraft liners and white-top duplex boards. Subscription models for cosmetics and meal kits add seasonal volatility, yet also lift graphics requirements that justify premium inkjet overprint. Net impact is an outsized 2.1% boost to the Australia paper and paperboard packaging market CAGR during 2025-30.
Mandatory Recycled-Content Targets (2026 Onward)
Federal rules that step recycled fiber percentages up each year after 2026 pressure converters to lock in post-consumer bale contracts early. Average packaging recycled-fiber content rose from 40% to 44% between 2021 and 2023 but must climb faster in linerboard grades to remain compliant. Producers with vertically integrated material recovery facilities, such as Visy, can arbitrage bale-price swings and capture brand owner volumes tied to exact PCR quotas. Smaller sheet plants reliant on virgin kraft pulp face margin compression and potential share loss unless they join cooperative procurement pools. The regulatory certainty also accelerates capital spending on de-inking and anaerobic digestion plants, deepening entry barriers for new mills.
Restraints Impact Analysis*
| Restraint | (~) % Impact on CAGR Forecast | Geographic Relevance | Impact Timeline |
|---|---|---|---|
| Volatile OCC and kraft pulp pricing swings | -1.4% | National, affecting all manufacturers | Short term (≤ 2 years) |
| Import competition from low-cost Asian mills | -1.1% | National, concentrated in commodity grades | Medium term (2-4 years) |
| Logistics bottlenecks on east-coast ports | -0.8% | NSW, Victoria, Queensland ports | Short term (≤ 2 years) |
| Brand hesitancy over pack integrity in humid climate | -0.6% | Tropical and subtropical regions | Long term (≥ 4 years) |
| Source: Mordor Intelligence | |||
Volatile OCC and Kraft Pulp Pricing Swings
Old corrugated cardboard and kraft pulp trade in U.S. dollars, exposing Australian converters to currency and freight shocks that hit gross margins quickly. The latest pulp-cycle corrections wiped 18% off benchmark prices, while bale scarcity in 2024 pushed domestic OCC above long-run averages. Australian Paper’s acquisition of Orora Fibre assets illustrates a pre-emptive shield against volatility, allowing internal pulp supply and liner conversion under one roof. Even so, small sheet plants without hedging tools remain exposed, curbing capacity-expansion appetite and shaving an estimated 1.4% from the sector’s compound growth rate.
Import Competition from Low-Cost Asian Mills
Freight-on-board rates from Southeast Asia to Australian ports remain competitive and, when paired with lower labor and energy costs, enable Asian linerboard to land below domestic cost curves. ACCC assessments indicate Kraft linerboard is globally traded and easily importable, so local mills must differentiate through service windows and specialty print finishes rather than unit cost. Test liner and fluting medium grades are most exposed, prompting some converters to pivot into micro-flute retail packs or quick-response digital runs where proximity outweighs price.
*Our forecasts treat driver/restraint impacts as directional, not additive. The impact forecasts reflect baseline growth, mix effects, and variable interactions.
Segment Analysis
By Product Type: Corrugated Dominance Meets Flexible Innovation
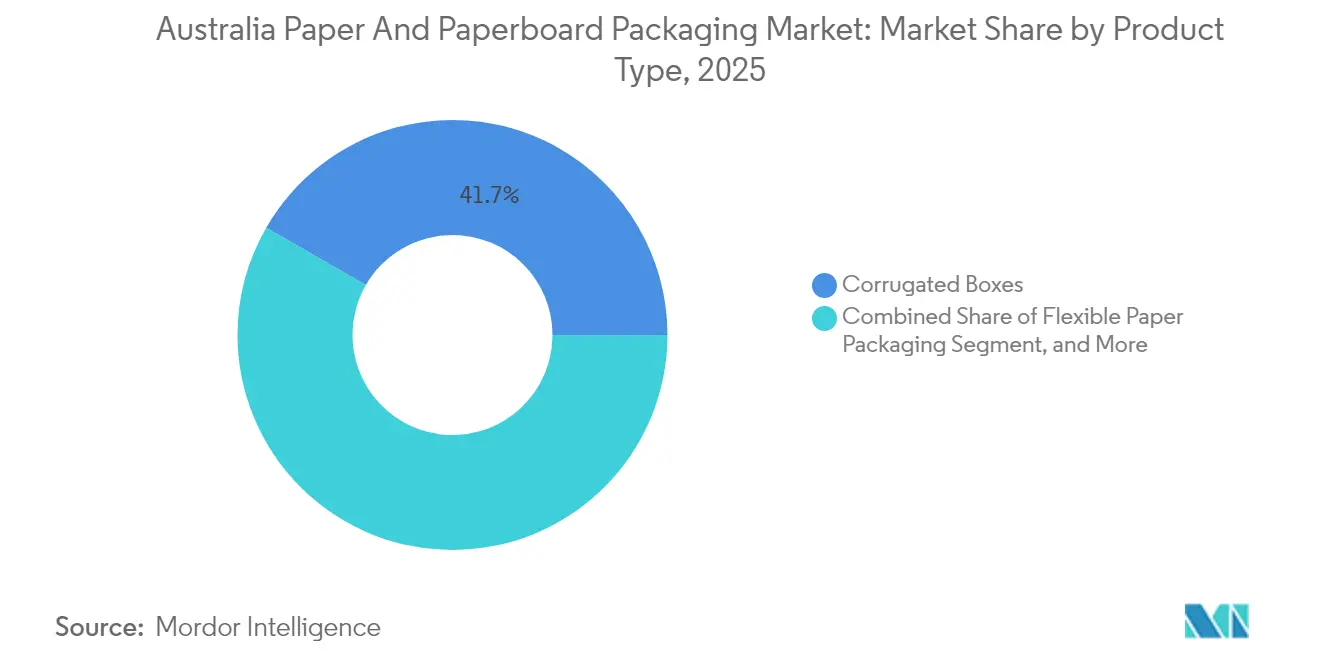
The corrugated segment accounted for 41.68% of the 2025 volume, firmly anchoring the Australia paper and paperboard packaging market. Continued e-commerce parcel growth has mills running near capacity, while premium white-top liners fetch higher margins as online retailers seek shelf-ready aesthetics. Flexible paper packaging, although smaller, is the volume rocket its 8.85% CAGR through 2031 outpaces every other segment as brand owners trade metallized poly for fiber-based pouches compatible with kerbside recycling. Folding cartons hold steady in confectionery and pharma, benefiting from precise die-cut registration that supports automated filling lines. Liquid cartons grow on the back of dairy processors adopting renewable sealants, whereas rigid paperboard boxes defend premium personal-care niches despite material cost inflation. The divergent trajectories underscore why the Australia paper and paperboard packaging market size gains breadth even as legacy grades mature.
Corrugated demand also reflects board grade migration: B-flute dominance gives way to lighter E-flute micro-profiles that meet parcel strength criteria at reduced fiber weights. Flexible sub-segments such as wax-free grease-resistant wraps expand into hot food delivery, riding the on-the-go dining wave. Brand winnow pressure forces converters to integrate digital print modules that execute shorter SKU runs, further blurring the line between corrugated and folding carton applications. Net effect is an environment in which no single product type loses absolute tonnage, yet share shifts toward formats that balance sustainability with logistics efficiency, sustaining top-line growth for the Australia paper and paperboard packaging market.

By Material Grade: Kraft Liner Leadership Amid Virgin Board Growth
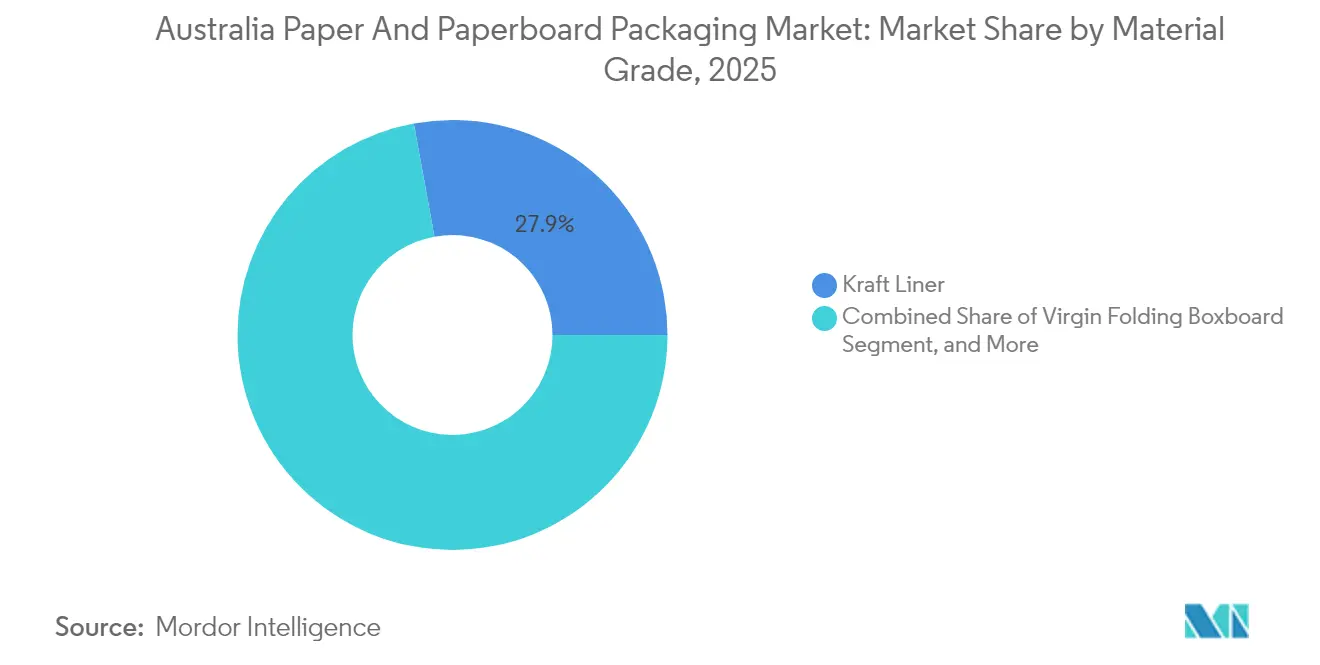
Kraft liner retained 27.88% of total tonnage in 2025, underpinning the structural role of corrugated shippers. Recycled linerboard covers the compliance side, but premium e-commerce boxes increasingly specify virgin or hybrid grades to support print-rich front panels. Virgin folding boxboard, though with a smaller base, accelerates at an 8.62% CAGR as cosmetics, nutraceuticals, and boutique confectionery emphasize tactile unboxing experiences that justify higher grammage. Test liner and fluting medium remain cost-play staples but see margin pressure from Asian imports, prompting local mills to hike recycled content ratios. White-top duplex grades flourish in beverage multipacks where billboard real estate translates directly into brand lift. Overall, material-grade interplay shows sustainability rules steering buyers toward recycled or responsibly sourced virgin fiber, adding depth to the Australia paper and paperboard packaging market share race.
The policy tailwind also provokes capital upgrades: high-yield chemi-thermomechanical processes, oxygen delignification, and closed-loop water circuits enter mill investment plans to cut energy intensity and meet brand ambition scopes. Integrated players that operate both kraft pulping and paper conversion lines hedge against pulp-price peaks, boosting segment resilience. Conversely, stand-alone converters reliant on sheet-fed stock face working-capital drains when pulp surges. Each dynamic shapes procurement strategy across the Australia paper and paperboard packaging industry, influencing grade selection and negotiating leverage.
By Packaging Format: Primary Retail Packs Lead Subscription Growth
Primary retail packs held 36.12% volume in 2025 as supermarkets, pharmacies, and convenience chains dominated consumer touchpoints. They run the gamut from windowed folding cartons for baked goods to litho-laminated corrugated for electronics. Subscription e-commerce packs, the clear growth champion at 9.12% CAGR, mirror the subscription boom in beauty, athleisure, and meal-prep services. These boxes often integrate tear-strips, digital print customization, and returnability features that underwrite repeat orders, expanding the Australia paper and paperboard packaging market size in value terms. Secondary transit packs advance in lockstep with omnichannel fulfillment, adopting shelf-ready perforations that slice retail labor costs. Shelf-ready packs themselves gain ground through grocery mandates aimed at planogram compliance and faster replenishment. Industrial bulk packs trail but remain essential to mining, agriculture, and manufacturing, where pallet stability trumps marketing aesthetics.
Format diffusion reflects digital-print economics: Opal’s new large-format inkjet lines drive variable data coding at scale, enabling marketers to regionalize artwork without halting corrugator flow. Meanwhile, eco-modulated fees embedded in Extended Producer Responsibility schemes nudge brands toward design-for-recycling formats, penalizing laminates or extrusions that inhibit fiber recovery. The result is a dynamic shift in pack engineering, cementing the Australia paper and paperboard packaging market as a front-line beneficiary of omnichannel retail and regulatory eco-fees.
By End-User Industry: Food Sector Stability Meets E-Commerce Acceleration
Food applications secured 31.55% volume share in 2025, leveraging broad SKU diversity and constant throughput from ready-meal, bakery, and fresh-produce channels. Biobased coatings extend shelf life without compromising recyclability, keeping paper competitive against PET trays. Beverage follows, driven by gable-top and aseptic carton adoption in dairy and juice. Pharmaceutical and healthcare segments stay niche but price-rich, demanding anti-tamper features and barrier laminations. Personal-care and household-care categories adopt paper wraps and tubes for premium lotions and detergents, chipping away at HDPE bottles. E-commerce and retail, while smaller, is the headline-grabber, racing at a 9.74% CAGR as more categories shift toward direct-to-consumer models that amplify corrugated and mailer demand. Industrial goods round out the palette, their requirements tethered to export freight cycles.
Cross-industry synergies emerge: the same grease-resistant chemistry perfected for quick-service wraps migrates into cosmetic blotter packs, demonstrating technology spillover that multiplies fiber-based use cases. Retailers’ carbon accounting embeds Scope 3 packaging emissions, making paper’s lower footprint a procurement lever. As a result, every end-use sees at least token substitution of plastic, reinforcing upward momentum for the Australia paper and paperboard packaging market.
Geography Analysis
New South Wales held the largest regional slice of the Australia paper and paperboard packaging market in 2025, bolstered by Sydney’s role as the country’s pre-eminent e-commerce fulfillment hub and by a robust waste-levy framework that penalizes landfill disposal. State freight-reform programs improve last-mile parcel flow, yet port congestion at Botany still inflates container dwell times, occasionally constraining raw-material supply. Victoria follows closely, leveraging Melbourne’s diversified manufacturing base and an aggressive single-use-plastic ban that propels substitution toward paper packs in takeaway food and quick-service retail venues. The state’s recycling credit scheme further increases bale availability, easing mill procurement of recovered fiber.
Queensland’s demand pivots on agricultural exports, tourism, and a USD 29 billion manufacturing blueprint that earmarks USD 79.1 million for advanced-technology grants through 2030. The program incentivizes robotics and digital print lines in regional converters, raising capacity outside traditional southern clusters. South Australia illustrates innovation depth: Detmold Group’s consolidated HQ and factory bring 240 staff under one roof in Adelaide, expanding specialized takeaway packaging output for domestic and Asian markets. Western Australia and Tasmania remain smaller but report double-digit growth from seafood, timber, and boutique food exports packaged in kraft or white-top carton board. Geographic supply chains map closely to fiber sources: plantation pine and recovered paper streams feed integrated mills in NSW and Victoria, while proximity to port infrastructure supports export-oriented corrugators in Queensland. Cross-Tasman capacity ties emerge as Opal’s New Zealand sites harmonize digital-print workflows with eastern-seaboard factories, shortening lead times across the ditch. Population concentration ensures the three eastern states together consume 75% of national tonnage, but policy-driven manufacturing rebalancing should lift share in regional centers over the decade, extending the footprint of the Australia paper and paperboard packaging market.
Regulatory Landscape
Australia packaging sustainability obligations are primarily governed through the co-regulatory National Environment Protection (Used Packaging Materials) Measure 2011 (NEPM), alongside the Australian Packaging Covenant Organisation (APCO) framework. Under this system, businesses with AUD 5 million or more in annual turnover participate via APCO (with annual reporting and action plans aligned to the National Packaging Targets) or meet applicable state and territory requirements under the NEPM.
The policy direction is moving from voluntary and co-regulatory arrangements toward tighter national rules. Environment ministers agreed in 2022 to reform packaging regulation around circular economy design principles, and the Australian Government ran public consultation on reform options in October 2024. In May 2026, the Extended Producer Responsibility Scheme for Packaging (No Time to Waste) Bill 2026 was introduced to the Senate (13 May 2026) and referred to committee, reinforcing regulatory momentum around EPR, recycled-content obligations (including the national paper recycled-content goal), and strengthened packaging design requirements.
Value Chain Analysis
The value chain starts with fiber inputs (virgin pulp and recovered paper such as OCC), followed by containerboard and paperboard manufacturing, corrugated and carton converting, printing/finishing, and distribution into end users including food, beverage, e-commerce and retail, and industrial goods. Recovered-fiber collection and sorting is a critical upstream step because recycled-content thresholds from 2026 onward place greater weight on access to consistent, quality bales, while east-coast port and logistics constraints can still affect imported pulp, chemicals, and machinery inputs.
Vertical integration is a defining feature in Australia, with the largest producers combining recycling, paper/board making, and downstream converting to stabilize feedstock costs and compliance. Industry consolidation has also reshaped the chain: in November 2025, Abbe Group acquired Oji Fibre Solutions Australian corrugated packaging operations (including Packaging Queensland, Packaging New South Wales, Packaging Victoria, and Oji Cardboard Carton Solutions), reinforcing a market structure dominated by integrated players (including Visy and Opal). Downstream, APCO functions as the coordinating co-regulatory body that links brand owners, converters, recyclers, and reprocessors through reporting requirements and design guidance aligned to the 2025 National Packaging Targets and ongoing reform discussions.
Competitive Landscape
Market concentration is moderate, anchored by integrated giants Visy, Opal, and the newly formed Smurfit WestRock. The July 2024 merger between Smurfit Kappa and WestRock created a global behemoth with purchasing heft that could reset linerboard contract pricing for Asia-Pacific customers. Visy counters through automation: 11 technical-systems sites now deploy robotic palletizers, end-of-line carton erectors, and vision-guided case packers that cut unit labor cost and standard deviation in box strength. Opal’s focus lies in digital printing, where newly installed Kissel+Wolf Revo and iECHO cutters enable lot-size-one runs, satisfying e-commerce branding needs while minimizing waste.
Vertical integration shapes competitive posture. Australian Paper’s Orora Fibre buyout secures kraft liner input and neutralizes pulp-price whipsaws. Visy’s 150-site recycling network feeds mill furnaces with steady post-consumer fiber, ensuring compliance with recycled-content mandates ahead of 2026 thresholds. Import pressure from Asian mills keeps commodity-grade margins thin, encouraging local players to chase value-added niches such as barrier-coated trays, digital variable-data corrugate, and subscription-box design services. New entrants face hefty capital hurdles, but niche disruptors emerge in molded-fiber and paper-based rigid UT cartons, indicating persistent innovation flow.
Collaboration is a rising theme. Amcor’s joint R&D with Kolon Industries on chemically recycled PET illustrates how hybrid material platforms can coexist with fiber packs, broadening sustainability toolkits for brand owners. Supplier-retailer taskforces around shelf-ready mandates encourage converters to co-engineer designs that collapse logistics cost across SKU ranges. Overall, the competitive arena centers on speed-to-market, PCR compliance, and automation, reinforcing structural advantages for scale players yet leaving room for specialized challengers targeting high-margin micro-segments within the Australia paper and paperboard packaging market.
Australia Paper And Paperboard Packaging Industry Leaders
-
Opal Group
-
Visy Industries Holdings Pty Ltd
-
Oji Holdings Corporation
-
Pro-Pac Packaging Ltd
-
Mondi plc
- *Disclaimer: Major Players sorted in no particular order

Market Opportunities and Future Outlook
Compliance-driven demand for higher recycled content and design-for-recycling has created whitespace in domestic recovered-fiber supply, sorting quality, and recycled-fiber utilization upgrades (for example, de-inking and process capability that enables higher recycled share without compromising performance in humid or cold-chain applications). A concrete inflection point is export regulation for recovered paper: from 1 July 2026, waste paper and cardboard export licences require evidence that contamination does not exceed 5%, pushing stronger quality control and traceability across collection and MRF operations and supporting investment cases for better sorting, bale verification, and chain-of-custody data.
On the converting side, opportunities center on capacity additions and higher-value formats linked to e-commerce, shelf-ready retail, and foodservice substitution away from single-use plastics. Visy opened an 8,500 square meter packaging hub in Devonport, Tasmania in February 2026 as part of a AUD 20 million investment to supply local food, beverage, and agricultural customers, illustrating regional manufacturing build-out close to end users. Digital and data-enabled packaging is another active pathway: Opal Packaging Plus partnered with Phantm in February 2026 to develop a packaging intelligence platform, aligning with rising transparency needs under APCO reporting and broader packaging-reform direction while enabling converters and brand owners to manage material choices, performance, and compliance documentation at SKU level.
Recent Industry Developments
- July 2026: Visy concluded a year-long trial with partners including Meat and Livestock Australia and GS1 Australia to test fiber-based insulation (Visycell) for meat export packaging, linking sustainability outcomes with improved traceability. The program highlights product development beyond standard corrugated shippers and supports export-oriented use cases where packaging performance and data standards are procurement requirements.
- February 2026: Visy opened an 8,500 square meter Packaging Hub in Devonport, Tasmania to supply cardboard packaging for local agriculture, food, and beverage customers. The site strengthens regional supply resilience and shortens lead times for Tasmanian producers that rely on consistent packaging availability.
- November 2024: MasterFoods began trialing recyclable paper-based single-serve Squeeze-On tomato sauce packs at its Wyong plant, reducing plastic content by 58%. The trial supports wider adoption of fiber-based primary packs in on-the-go foodservice applications where plastic restrictions and brand sustainability commitments are driving material substitution.
Research Methodology Framework and Report Scope
Market Definition and Coverage
This market covers paper and paperboard packaging consumed in Australia, counted as packaging material converted into common formats used to pack, ship, and display goods across major end-use industries.
Scope exclusions: We exclude non-packaging paper products (such as printing and writing paper, tissue, and hygiene grades) and durable non-paper packaging materials.
Segmentation Overview
- By Product Type
- Folding Cartons
- Corrugated Boxes
- Flexible Paper Packaging
- Liquid Cartons
- Rigid Paperboard Boxes
- By Material Grade
- Kraft Liner
- Test Liner
- Fluting Medium
- White-top Duplex
- Virgin Folding Boxboard
- Recycled Paperboard
- By Packaging Format
- Primary Retail Packs
- Secondary Transit Packs
- Shelf-Ready Packs
- Subscription E-commerce Packs
- Industrial Bulk Packs
- By End-user Industry
- Beverage
- Food
- Pharmaceutical and Healthcare
- Personal Care and Household Care
- E-commerce and Retail
- Industrial Goods
Data Sources, Market Sizing, and Validation
Desk Research
Desk work starts with building the demand context for paper-based packaging in Australia, and we then align it with measurable signals like manufacturing output, trade flows, and recycling availability. Public sources that typically help anchor the model include Australian Bureau of Statistics releases, Australian Customs trade statistics, Department of Climate Change, Energy, the Environment and Water publications, and packaging and recycling bodies such as APCO and related industry associations.
After that, we add company-level context from annual reports, investor presentations, and credible press coverage to understand capacity additions, mill conversions, and major product mix shifts. We also use paid subscriptions that help with company financials and intelligence, patent lookups, and shipment-level import and export cuts where a public series is not detailed enough. The sources listed above are illustrative only, and many other public documents and datasets were reviewed to collect inputs, cross-check assumptions, and close clarity gaps.
Primary Interviews and Surveys
Primary work is used to pressure-test what we see in published data, especially where packaging mix and channel shifts are not visible in a single public table. We spoke with stakeholders across converters, material suppliers, distributors, and large buyers in food, beverage, retail, and e-commerce so that our sizing inputs matched on-the-ground ordering patterns and the pace of substitution between formats.
Distribution of primary research fieldwork respondents
| Company type | Respondent position |
|---|---|
| Top tier: 26% | CXOs: 15% |
| Mid tier: 58% | Functional/Unit leaders: 31% |
| Smaller Players: 16% | Managers: 54% |
Market-Sizing & Forecasting
The core model is built as a top-down demand pool that reconstructs packaging consumption in tonnes, using Australia-specific production and trade signals and then mapping them to paper and paperboard packaging usage. To keep the totals realistic, we corroborate them with selective bottom-up approximations, such as sampled converter throughput checks, format-level volume benchmarks, and ASP-to-volume logic where value figures exist but need to be translated into tonnes.
Inputs are chosen because they leave a footprint in real-world data series. In this market, some of the most useful indicators include apparent consumption based on production plus imports minus exports, packaging format mix shifts (for example, corrugated versus cartons), recycled fiber availability and recovery trends, e-commerce shipment intensity and secondary pack demand, and policy-led material switching that changes paper share in packaged goods. When a bottom-up line is not observable, we fill the gap with bounded ranges agreed in interviews and keep the assumption visible so it can be challenged and updated.
For forecasting, scenario analysis is used because demand depends on several moving parts that do not move in a straight line, such as retail volume, industrial activity, and the speed of fiber substitution. The forward view is built from those drivers, and then the trajectory is reconciled with expert expectations on format growth, recycled-content adoption timing, and capacity constraints.
Data Validation & Update Cycle
Validation is done through multiple checks so the final series does not rely on one dataset or one assumption. We compare the model outputs against independent signals such as trade movements, manufacturing indicators, and visible packaging activity in key end-use sectors, and unusual jumps are reviewed until a clear reason is documented.
Before sign-off, assumptions and calculations are reviewed in steps, with targeted re-contacts triggered when a conversion, closure, regulation change, or an outlier in trade data would materially affect the totals. Reports are refreshed annually, and interim updates are made when events are large enough to shift demand, pricing logic, or product mix. Right before delivery, a final pass is completed so the client receives the most current view available.
Mordor Intelligence's Australia Paper and Paperboard Packaging Market Sizing Compared With Other Published Estimates
Published market sizes for Australia paper and paperboard packaging do not always match because the underlying unit of measurement and the inclusion rules can change from one publisher to another. Differences also come from how imports and exports are treated, whether secondary and transit packs are counted, and how aggressively substitution trends are assumed to play out in the forecast.
In practice, the biggest gaps usually show up around scope and conversion logic, especially when one estimate is value-based and another is volume-based, or when paper packaging is mixed with broader paper products. Currency timing can also change reported values, and refresh cadence matters because packaging demand can move quickly after policy changes, retail shifts, or capacity expansions.
Benchmark comparison
| Source | Market Size | Gaps in Research Methodology |
|---|---|---|
| Mordor Intelligence | USD 4.63 B (2025) | |
| Industry Association A | USD 6.10 B (2025) | This figure is typically framed in value terms and may bundle paper packaging with adjacent paper product spend, which can inflate totals when converted back to a packaging-only view. |
| Regional Consultancy B | USD 3.90 B (2025) | This estimate appears narrower on what is counted as packaging, and it can understate demand if it relies mainly on local production and does not fully adjust for packaging imports, exports, and format mix. |
The table shows a wide spread in 2025 totals, and in Mordor Intelligence's model the market is tracked in tonnes for paper and paperboard packaging formats only, which reduces errors from price swings and avoids pulling in non-packaging paper categories. When the scope is kept consistent and the demand signals are checked against trade and format shifts, the resulting size is easier to trace, explain, and update with repeatable steps as conditions change.
Key Questions Answered in the Report
How large is the Australia paper and paperboard packaging market today?
The market handled 5.01 billion tonnes of packaging in 2026 and is forecast to reach 7.39 billion tonnes by 2031.
What CAGR is expected for paper and paperboard packaging demand in Australia?
Aggregate demand is projected to climb at an 8.11% CAGR between 2026 and 2031.
Which product type leads volume consumption?
Corrugated boxes topped the list with 41.68% share in 2025, buoyed by e-commerce parcel growth.
What regulation most influences material selection?
The mandate for 100% recyclable, compostable, or reusable packaging by 2025 plus recycled-content thresholds kicking in from 2026 drive fiber substitution for plastic.
Who are the dominant companies in Australian paper packaging?
Visy Industries, Opal Group, and the combined Smurfit WestRock lead, with strong positions in corrugated and folding carton segments.
Where is demand growing fastest regionally?
New South Wales sees the greatest absolute volumes, but Queensland posts the fastest growth due to manufacturing grants and e-commerce network expansion.