
Market Overview
| Study Period | 2021 - 2031 |
|---|---|
| Forecast Data Period | 2026 - 2031 |
| Base Year Market Size (2025) | USD 11.72 Billion |
| Market Size (2026) | USD 12.18 Billion |
| Market Size (2031) | USD 14.79 Billion |
| Growth Rate (2026 - 2031) | 3.94 % |
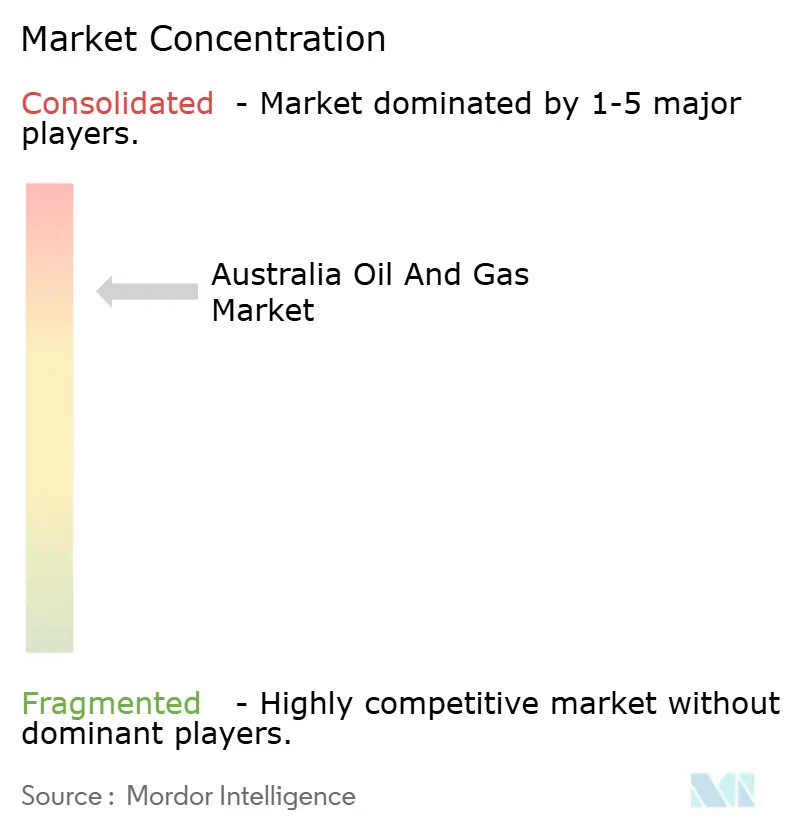
| Market Concentration | High |
Major Players *Disclaimer: Major Players sorted in no particular order Image © Mordor Intelligence. Reuse requires attribution under CC BY 4.0. | |
Australia Oil And Gas Market Analysis by Mordor Intelligence
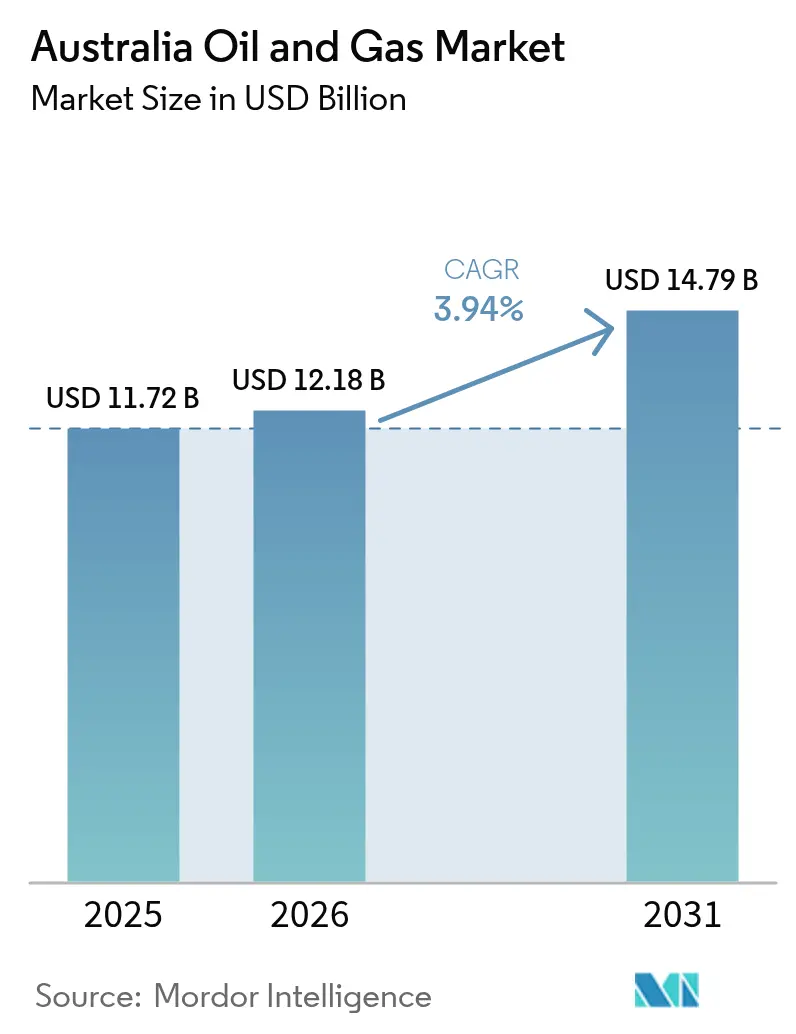
The Australia Oil And Gas Market size was valued at USD 11.72 billion in 2025 and estimated to grow from USD 12.18 billion in 2026 to reach USD 14.79 billion by 2031, at a CAGR of 3.94% during the forecast period (2026-2031).
A USD 60 billion decommissioning backlog, rapid adoption of digital oil-field systems that cut offshore operating spending by as much as 83%, and surging off-grid demand from critical minerals mining are redefining competitive priorities within the Australian oil and gas market. Heightened domestic gas shortages, an expanding Asian LNG customer base, and tightening Scope 1 caps under the Safeguard Mechanism drive upstream capital toward CCS-ready blue-hydrogen schemes, while infrastructure bottlenecks in Eastern Australia sustain premium pipeline tariffs. Offshore Western Australia remains the production nucleus, yet onshore coal seam gas and Northern Territory shale prospects provide shorter-cycle growth options that help stabilize supply variance. Intensifying renewable penetration, meanwhile, compresses gas-fired power margins and underscores the need for integrated carbon-management services that preserve the long-term relevance of the Australian oil and gas market.
Key Report Takeaways
- By sector, upstream operations held 74.31% of Australia's oil and gas market share in 2025, and their 4.38% CAGR to 2031 is the fastest among core value-chain activities.
- By location, offshore assets commanded 85.40% of 2025 revenue and are forecast to expand at a 4.18% CAGR on the back of large-scale digital operations rollouts.
- By service, construction services captured 46.55% of the revenue in 2025, while decommissioning is set to lead growth at a 5.42% CAGR through 2031, as end-of-life platforms transition into dismantling programs.
Note: Market size and forecast figures in this report are generated using Mordor Intelligence’s proprietary estimation framework, updated with the latest available data and insights as of 2026.
Market Trends and Insights
Drivers Impact Analysis of Australia Oil And Gas Market*
| Driver | (~) % Impact on CAGR Forecast | Geographic Relevance | Impact Timeline |
|---|---|---|---|
| Rising domestic & Asian LNG demand | +1.20% | National, with concentration in Western Australia and Queensland | Medium term (2-4 years) |
| Expansion of pipeline & gas-storage infrastructure | +0.80% | National, with focus on Eastern Australia gas corridors | Long term (≥ 4 years) |
| CCS-linked blue-hydrogen projects unlocking new gas off-take | +0.60% | South Australia, Northern Territory, Western Australia | Long term (≥ 4 years) |
| Digital oil-field & remote-ops cutting offshore OPEX | +0.90% | Offshore Western Australia, Bass Strait, Browse Basin | Short term (≤ 2 years) |
| Fast-track exploration permits under NOPTA reforms | +0.40% | Commonwealth offshore waters | Medium term (2-4 years) |
| Critical-minerals boom driving diesel & LNG off-grid use | +0.50% | Western Australia, Northern Territory, Queensland | Medium term (2-4 years) |
| Source: Mordor Intelligence | |||
Rising Domestic & Asian LNG Demand
Domestic wholesale gas prices averaged USD 12-15 per gigajoule in 2024, almost twice the level of exported cargo benchmarks, highlighting the tight local balance that sustains premium contract prices and assures robust cash flows for exporters. Industrial buyers are increasingly securing long-term deals to shield their operations from volatility, which locks in forward revenue for producers but perpetuates supply tension that shapes policy debates around reservation schemes. Japan and South Korea are sourcing Australian LNG for blue-hydrogen conversion, extending the commodity’s strategic role beyond power generation and amplifying future off-take certainty within the Australian oil and gas market. Streamlined NOPSEMA approvals for expansion trains shorten cycle times, although regional community pushback continues to challenge schedule adherence. The interplay of constrained domestic supply, resilient Asian demand, and regulatory facilitation supports sustained liquefied natural gas (LNG) utilization and underpins the growth outlook of the Australian oil and gas market.
CCS-linked Blue-Hydrogen Projects Unlocking New Gas Off-take
Santos commenced CO₂ injection at the Moomba CCS hub in September 2024, targeting 1.7 million t per year and positioning legacy gas assets for low-carbon hydrogen output that satisfies Safeguard Mechanism trajectories.(1) Converting the Bayu-Undan field into a regional carbon-storage site offers Southeast Asian emitters an affordable sequestration option, monetizing depleted reservoirs while extending LNG infrastructure relevance. Blue-hydrogen projects reach break-even at gas prices as much as 30% below liquefaction thresholds when carbon-credit revenue offsets capture expenditures, bolstering competitiveness against green variants in hard-to-abate industrial segments. Integrated CCS enables upstream operators to sell both molecules and decarbonization services, a dual-income structure that enhances project bankability. This paradigm shift recasts gas reserves from transition risk to transition enabler, strengthening investment appetite across the Australian oil and gas market.
Digital Oil-Field & Remote-Ops Cutting Offshore OPEX
Woodside’s Angel platform now requires 5,000 person-hours annually, compared to 30,000 before automation, validating how edge analytics and robotics shrink logistics footprints in remote basins. Predictive maintenance algorithms reduce unscheduled downtime, thereby improving recovery factors and extending reservoir economic life —a crucial advantage as Safeguard compliance raises cost baselines. The Scarborough field deploys uncrewed surface vessels for seismic and environmental monitoring, eliminating helicopter sorties, reducing weather-related deferrals by 40%, and cutting fuel burn that drives Scope 1 exposure. Local technology vendors such as Harvest Technology Group have installed digital twins across 15 operator portfolios, fostering a domestic service ecosystem that reduces reliance on foreign engineering talent. These proof points accelerate sector-wide adoption, making digital transformation an essential pillar of competitiveness in the Australian oil and gas market.
Fast-Track Exploration Permits Under NOPTA Reforms
NOPTA reforms trimmed exploration approval cycles from 18-24 months to roughly 12 months by enabling concurrent safety and environmental reviews, unlocking 82 wells drilled in 2024, of which 60 were appraisal wells with near-term tie-back potential.(2) Preference for applications embedding CCS or electrification strengthens the investment case for low-carbon supply, aligning exploration with national emissions objectives. The streamlined pathway eases capital deployment risk, particularly for smaller independents that previously struggled with protracted timeframes. Federal policy clarity contrasts with fragmented state regimes, yet even onshore moratoria are subject to review as supply security climbs in political priority. Faster permitting thus stimulates a broader prospect inventory, which reinforces long-term throughput for pipelines, LNG plants, and the wider Australian oil and gas market.
Restraints Impact Analysis of Australia Oil And Gas Market*
| Restraint | (~) % Impact on CAGR Forecast | Geographic Relevance | Impact Timeline |
|---|---|---|---|
| Accelerating renewable-power penetration | -0.70% | National, with strongest impact in South Australia and Tasmania | Medium term (2-4 years) |
| Declining conventional reserves → higher lift costs | -0.90% | Bass Strait, Carnarvon Basin, Cooper Basin | Long term (≥ 4 years) |
| Safeguard-Mechanism Scope-1 emission caps (2025-30) | -0.60% | National, affecting all major production facilities | Short term (≤ 2 years) |
| Community opposition delaying on-/off-shore projects | -0.40% | Northern Territory, New South Wales, Great Australian Bight | Medium term (2-4 years) |
| Source: Mordor Intelligence | |||
Accelerating Renewable-Power Penetration
Australia added 9.6 GW of renewable capacity in 2024, pushing South Australia's renewable generation to 70% and resulting in periods of negative wholesale prices, which reduce gas peaker run-time and revenue. Battery installations and pumped-hydro projects are increasingly supplying frequency control, thereby diminishing the ancillary-service income historically earned by gas turbines. State-sponsored renewable energy zones bypass thermal generation nodes, further eroding gas demand in new industrial parks. These trends reduce domestic offtake avenues for coal seam gas, intensifying reliance on export channels already capacity-constrained. Developers must therefore justify new gas projects on the merits of export and hydrogen alone, thereby elevating commercial risk and tempering growth prospects for the Australian oil and gas market.
Safeguard-Mechanism Scope-1 Emission Caps (2025-30)
The tightening of the Safeguard Mechanism introduces a 4.9% annual baseline decline, which will cost major operators USD 2-3 billion through 2030 under prevailing Australian Carbon Credit Unit pricing. For Santos, this equates to USD 400-500 million in yearly compliance, incentivizing asset rationalization and accelerated CCS deployment. Woodside earmarked USD 5 billion for abatement programs, illustrating the capital intensity needed to align pre-existing portfolios with regulatory trajectories. Smaller producers face proportionally higher burdens, which may trigger asset divestments or consolidation, thereby reshaping the competitive chessboard. While the mechanism ultimately steers the sector toward lower-carbon models, it constrains free cash flow for exploration and discretionary projects throughout the Australian oil and gas market.
*Our forecasts treat driver/restraint impacts as directional, not additive. The impact forecasts reflect baseline growth, mix effects, and variable interactions.
Australia Oil And Gas Market Segment Analysis
By Sector:
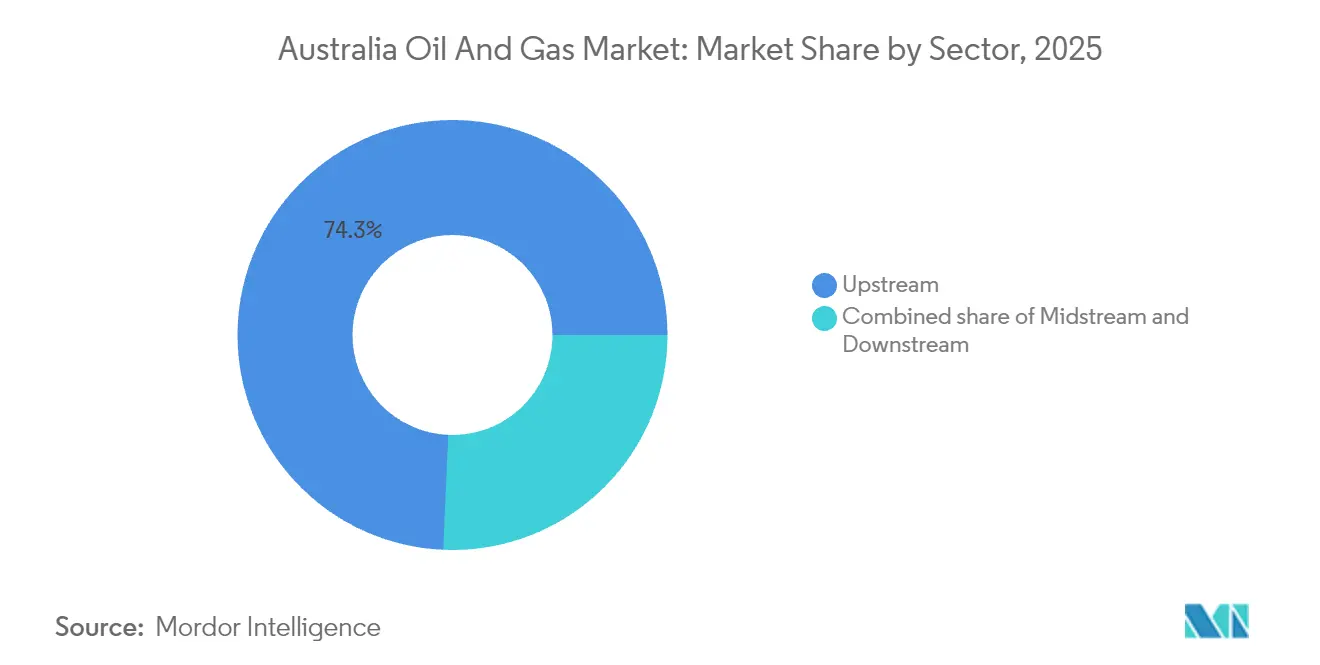
Upstream Dominance Drives Blue-Hydrogen TransitionThe upstream segment accounted for 74.31% of 2025 revenue within the Australian oil and gas market, and its 4.38% CAGR forecast to 2031 underscores how enhanced recovery techniques and carbon-capture projects underpin production resilience despite maturing fields. Blue-hydrogen initiatives, such as the Moomba hub and Bayu-Undan repurposing, stitch CCS economics into gas sales, enabling upstream operators to extract a higher realized value than traditional LNG alone. Midstream activities benefit from sustained throughput demand and pipeline tariff premiums that arise from Eastern Australia bottlenecks, yet expansion remains capital-intensive as route approvals confront landholder concerns. Downstream refining struggles with declining gasoline demand and renewable diesel mandates, but pivots toward petrochemical feedstocks and low-carbon fuels that leverage existing process units.
Upstream investment strategies now combine infill drilling, subsea tie-backs, and remote-asset management to keep lift costs from rising in depleted reservoirs, while carbon-credit revenue generated by CCS drives incremental returns that buffer volatile spot LNG prices. Midstream firms continue to implement loop and compression upgrades to enhance deliverability into southeastern hubs, where wholesale prices peak, a trend that reinforces pipeline revenue stability. By contrast, refining rationalization may accelerate as electric-vehicle uptake pressures gasoline margins, although residual demand from heavy transport preserves a core utilization floor. Collectively, these dynamics ensure the upstream segment remains the anchor of value creation, shaping strategic capital flows across the Australian oil and gas market.

By Location:
Offshore Assets Lead Digital TransformationOffshore installations captured 85.40% of market value in 2025 and are projected to record a 4.18% CAGR as autonomous operations, fiber-optic reservoir monitoring, and uncrewed surface vessels redefine cost structures and safety benchmarks. Federal jurisdiction provides permitting certainty that contrasts with onshore regulatory fragmentation, enabling large projects, such as Scarborough and Browse, to proceed under clearer environmental frameworks. Deep-water developments leverage shared floating production, storage, and offloading units to dilute capital overhead across adjacent fields, sustaining economies of scale that remain out of reach for many onshore ventures.
Onshore growth is nevertheless meaningful in Queensland’s coal seam gas sector, which supplies backfill feedstock to Gladstone LNG while reducing unit logistics costs through dense well clusters. The Beetaloo Basin holds significant shale potential, yet it carries a social license risk that elongates development timelines and may impose additional water management expenses. Victoria’s fracking ban and New South Wales’s exploration limits confine investor appetite, although incremental production from legacy Cooper Basin fields still offsets some eastern-seaboard demand. Overall, the offshore segment’s digital-enabled productivity gains strengthen its dominance, but onshore plays continue to provide short-cycle volumes that mitigate supply variability within the Australian oil and gas market.
By Service:
Decommissioning Emerges as Growth EngineConstruction and brownfield expansion services held a 46.55% share of 2025 expenditure, reflecting ongoing facility build-outs and maintenance across the North West Shelf, Gippsland, and Surat hubs. Yet decommissioning exhibits the highest momentum at a 5.42% CAGR through 2031, catalyzed by the government’s USD 60 billion Offshore Resources Decommissioning Roadmap and December 2024 formation of the Offshore Decommissioning Directorate, which clarified liability and tax-deductibility rules. Platform dismantling contracts, such as Allseas’s 12-unit Gippsland award and McDermott’s Harriet Alpha project, affirm the commercial scale and technical complexity of upcoming work scopes.
Contractors specializing in heavy-lift, subsea cutting, and rig recycling face a multi-decade backlog, while operators weigh partial removals against full-facility clearance to meet emerging environmental expectations. Concurrently, predictive-maintenance programs and integrity analytics extend asset life, where they also defer abandonment duty and smooth workforce utilization curves for service suppliers. Turnaround services remain essential for aging LNG trains and gas plants, although the person-hour intensity has decreased as robotics perform internal vessel inspections that previously required scaffolding and confined-space entry. The interplay of life-extension technology and statutory retirement milestones will shape the revenue mix of construction, maintenance, and dismantling, redefining service-sector competitiveness throughout the Australian oil and gas market.

Geography Analysis
Western Australia anchors export activity, with the North West Shelf, Pluto, and Ichthys ventures supplying steady LNG cargoes to North Asia while new digital platforms extend field life and efficiency. Scarborough’s first gas in October 2024 validated the unmanned-vessel surveillance model, reinforcing investor confidence in remote operations for frontier basins. The state’s established marine support infrastructure and federal regulatory clarity streamline project sanctioning, sustaining its primacy within the Australian oil and gas market.
Queensland’s coal seam gas industry underpins three Gladstone LNG plants, providing flexible backfill that mitigates reservoir decline elsewhere and supports domestic offtake through interconnected pipeline grids. High pipeline-tariff differentials across the Wallumbilla hub encourage spot-market arbitrage, while exploration expenditures rose 57.3% year-on-year to USD 390.1 million by December 2024, signaling renewed appraisal momentum. Eastern Australia’s tight supply, however, exposes manufacturers to elevated input costs, sparking political debate about reservation mechanisms that could redirect export volumes inward.
The Northern Territory’s Beetaloo Basin aims to commercialize shale gas, but development faces community resistance and water-use constraints that complicate approval timelines. South Australia’s Cooper Basin hosts the Moomba CCS-blue-hydrogen complex, positioning the state as a carbon-services hub that attracts regional emitters seeking reliable sequestration. Tasmania showcases near-100% renewable power generation, while maintaining a small LNG import capacity for industrial peaking, illustrating its geographic diversity in the energy mix. Victoria’s aging Bass Strait fields are facing depletion, prompting operators to consider near-term decommissioning or tie-backs to shared hubs, whereas New South Wales limits exploration to designated zones, constraining reserve replacement. These regional distinctions collectively influence capital allocation and supply security across the Australian oil and gas market.
Regulatory Landscape
Australia's offshore oil and gas activities in Commonwealth waters are primarily governed by the Offshore Petroleum and Greenhouse Gas Storage Act 2006 (OPGGS Act), with NOPSEMA regulating safety, well integrity, and environmental management, and NOPTA administering offshore titles and related data systems. The regulatory framework was refreshed with the Offshore Petroleum and Greenhouse Gas Storage (Resource Management and Administration) Regulations 2025, replacing the 2011 regulations to avoid a governance gap as the earlier instrument sunsetted.
In 2026, the approvals pathway continued to blend federal environmental decision-making with offshore environmental plan acceptance, keeping permit-ready compliance programs central to execution. For example, in March 2026 the federal government approved Australia Pacific LNG to develop up to 1,695 new gas wells in Queensland under environmental conditions and audit requirements. In April 2026, NOPSEMA accepted an environment plan tied to Chevron's Gorgon pipelines and wells. For large new supply projects, the EPBC Act process remains a critical gating item, and public reporting indicated the Browse gas project decision timeline was being worked toward mid-to-late 2026.
Competitive Landscape
Woodside, Santos, and a cohort of international majors dominate integrated operations; yet, market concentration remains moderate, as mid-tier independents capitalize on niche opportunities and new entrants pursue energy-transition strategies. The ADNOC-led consortium’s USD 18.7 billion bid for Santos, announced in November 2024, could recalibrate ownership patterns and intensify competitive pressure on LNG marketing channels if completed.(5) Strategic differentiation increasingly hinges on digital operations proficiency, with Woodside’s unmanned platforms and Santos’s CCS integration setting performance benchmarks that others rush to emulate.
Operators allocate larger shares of capital expenditure (capex) to emissions-reduction projects, as evidenced by Woodside’s USD 5 billion abatement commitment and Origin’s divestment of upstream assets to finance renewable growth, reflecting how shareholder expectations are pivoting toward decarbonization credentials. International oil companies leverage their global technology portfolios to secure project operatorship, as totalEnergies applies its floating offshore wind expertise to electrify remote platforms, thereby lowering Scope 1 emissions and meeting Safeguard trajectories. Simultaneously, local service firms specializing in autonomy, AI analytics, and heavy-lift decommissioning gain exportable expertise, reshaping competitive dynamics within the Australian oil and gas market supply chain.
Regulatory compliance costs under the Safeguard Mechanism act as a scale filter, advantaging capital-strong players who can fund offset projects or incorporate internal carbon prices into investment decisions. NOPSEMA’s safety oversight preserves operational standardization; however, the agency’s accelerated approvals reward project proponents who embed CCS or electrification into early design. As renewable penetration rises, gas producers with integrated hydrogen or carbon-management pathways secure superior market access, reinforcing a virtuous circle of technology leadership and policy alignment that is redefining the contours of rivalry across the Australian oil and gas market.
Australia Oil And Gas Industry Leaders
-
TotalEnergies SE
-
Chevron Corporation
-
BP PLC
-
Shell PLC
-
ExxonMobil Corporation
- *Disclaimer: Major Players sorted in no particular order
Australia Oil And Gas Market Companies Covered in this Report
- Woodside Energy Group Ltd
- Santos Ltd
- Chevron Corp
- Shell PLC
- ExxonMobil Corp
- ConocoPhillips Co
- TotalEnergies SE
- BP PLC
- INPEX Corp
- Origin Energy Ltd
- Beach Energy Ltd
- Cooper Energy Ltd
- Viva Energy Group Ltd
- Ampol Ltd
- APA Group
- Jemena Ltd
- BHP Group Ltd
- Senex Energy Ltd
- Horizon Oil Ltd
- Eni SpA
Market Opportunities and Future Outlook
Policy-led domestic supply security initiatives are creating a clearer whitespace for east coast gas contracting, compliance services, and infrastructure optimization. In May 2026, the federal government announced a Domestic Gas Reservation Mechanism requiring LNG exporters to set aside 20% of export volumes for the domestic market from 1 July 2027, with the Australian Energy Regulator (AER) designated to administer and enforce the mechanism. That same period included fuel-security funding commitments under the National Fuel Security Plan (AUD 11.9 billion over five years) and dedicated resourcing for the reservation mechanism, which supports opportunities across trading, compliance systems, and portfolio rebalancing toward domestic delivery.
Upstream and midstream opportunities are also tied to specific 2026 supply and asset actions. The March 2026 approval for up to 1,695 additional gas wells for the Australia Pacific LNG venture extends the operational runway for incremental coal seam gas feedstock into the east coast market. Meanwhile, Woodside's move to assume full operatorship of the Gippsland Basin Joint Venture and Kipper Unit Joint Venture tightens the linkage between mature offshore basins and domestic demand centers, with the transferred portfolio widely referenced as a major share of east coast domestic supply. Export-facing portfolio reshaping continues alongside these domestic drivers, including BP's June 2026 sale of a 5% stake in Browse to GS Energy, which maintains scope for specialist partners, financing structures, and emissions-aligned design changes under tightening Scope 1 constraints.
Recent Industry Developments in Australia Oil And Gas Market
- July 2026: Chevron Australia signed a five-year agreement to supply 46 petajoules of natural gas to Alinta Energy, with deliveries commencing in July 2027 from its equity interests in Gorgon, Wheatstone, and North West Shelf facilities. The deal improves domestic gas contracting visibility and links east coast and west coast supply security discussions more directly to LNG-linked portfolios.
- June 2026: Operatorship of the Gippsland Basin Joint Venture and Kipper Unit Joint Venture transferred from ExxonMobil to Woodside Energy, effective June 1, 2026. The handover concentrates operational control of mature offshore gas assets with a major domestic supplier, supporting brownfield life-extension, reliability programs, and potential debottlenecking decisions for the east coast market.
- April 2026: NOPSEMA approved an environment plan covering the operation of pipelines and wells associated with Chevron's Gorgon project. Regulatory acceptance reduces execution friction for ongoing offshore operations and sets the compliance baseline for related brownfield work aimed at sustaining LNG and domestic gas supply.
Australia Oil And Gas Market Report Scope and Research Methodology
Market Definition and Coverage
For this study, the Australia oil and gas market is sized as the value of activities linked to producing, moving, processing, and supplying oil and gas within Australia, across onshore and offshore assets, and across upstream, midstream, and downstream operations.
Scope exclusions: We do not count broader energy utilities, power generation, or renewable value chains that sit outside oil and gas operations.
Segments Covered in This Report
- By Sector
- Upstream
- Midstream
- Downstream
- By Location
- Onshore
- Offshore
- By Service
- Construction
- Maintenance and Turn-around
- Decommissioning
Data Sources, Market Sizing, and Validation
Desk Research
Desk research was first used to map the industry structure and to collect starting-point indicators that can be checked year to year. We mainly leaned on public datasets such as Geoscience Australia releases, Australian Government energy statistics, Australian Bureau of Statistics trade and industry tables, and state regulator publications for approvals and activity updates.
To translate activity into a defensible market value, we also reviewed company annual reports and investor presentations, operator and terminal updates, and credible press coverage for project timing and operating status. Where needed, a paid subscription for company financials and intelligence was used to cross-check revenue splits, and a patent database was referenced to sanity-check technology and project themes that can shift spending. These sources are illustrative only, and many other references were used for data collection, validation, and clarification as the model was built.
Primary Interviews and Surveys
Primary work focused on validating what is actually being spent in-country and when that spending hits the market, especially when public reporting is delayed. We spoke with a mix of operators, service providers, midstream and downstream stakeholders, and industry experts across key producing and consuming parts of Australia so assumptions on utilization, maintenance intensity, and project timing could be corrected.
The interviews were also used to align pricing logic to real contracting behavior (spot versus term) and to confirm whether capacity additions were already constrained by labor, permitting, or feedstock availability, which then fed directly into our final market build.
Distribution of primary research fieldwork respondents
| Company type | Respondent position |
|---|---|
| Top tier: 27% | CXOs: 16% |
| Mid tier: 57% | Functional/Unit leaders: 25% |
| Smaller Players: 16% | Managers: 59% |
Market-Sizing & Forecasting
Sizing started with a top-down reconstruction that links Australia oil and gas activity to observable signals, and then converts those signals into market value using realistic price and cost relationships. In practice, we tied the demand pool to indicators such as oil and gas production levels, LNG export volumes, major project start-up and decline schedules, refinery throughput, and midstream utilization where it is reported.
Once those inputs were set, the totals were corroborated through selective bottom-up checks, such as sampled project spend estimates, a limited roll-up of service activity where disclosure allows it, and price per unit assumptions applied to volumes, which were then compared against what interviewees see in current contracting cycles. When a sub-area had patchy disclosure, gaps were handled by using proxy variables (for example, utilization and maintenance cadence) and then re-testing the implied spend with industry feedback.
For forecasting, scenario analysis was applied around project timing, production profiles, and pricing paths, and the final trajectory was stress-tested so it does not overreact to a single short-term price swing. The forward view was adjusted where primary discussions signaled that commissioning timelines, decommissioning work, or turn-around schedules were likely to shift within the forecast window.
Data Validation & Update Cycle
Model outputs were checked against independent signals, including production and export trends, project milestone announcements, and consistency between volumes and implied revenue intensity. If a year-over-year change looked too sharp, the assumption set was reopened and, when needed, respondents were re-contacted to confirm whether the change was real or only a reporting effect.
Before sign-off, the work goes through multi-step analyst reviews so formulas, units, currency timing, and growth drivers are consistent across the market story and the numbers. The report is refreshed annually, and interim adjustments are made when material events occur, such as major project delays, regulatory shifts, or large price resets. Right before delivery, a final pass is completed so clients receive the latest updated view available at that time.
Mordor Intelligence's Australia Oil and Gas Market Size Compared With Other Published Estimates
Published market sizes for Australia oil and gas can look far apart because each publisher defines what is being counted, which year is treated as the base, and whether the figure is tied to operational activity or to broader industry revenue. Currency handling also matters, since some estimates use average exchange rates for a chosen year, while others mix periods or apply different inflation assumptions.
The main gap comes from whether the estimate is built around operational oil and gas activity across upstream, midstream, and downstream in Australia, versus being framed as total industry revenues or as a narrower spend pool, and Mordor Intelligence counts the market through activity-linked scope and volume signals (including onshore and offshore operations and related services like maintenance and decommissioning) rather than treating all sector revenues as the same market.
Benchmark comparison
| Source | Market Size | Gaps in Research Methodology |
|---|---|---|
| Mordor Intelligence | USD 11.72 B (2025) | |
| Industry Publisher A | USD 0.43 B (2025) | The estimate appears to represent a narrower spend pool within oil and gas, which can exclude large parts of value chain activity and can understate totals when compared with activity-linked sizing across upstream, midstream, and downstream. |
| Industry Profile B | USD 105.45 B (2022) | This figure is closer to a total industry revenue view for a different base year, and it can be inflated versus an activity-based model when upstream sales revenues and other revenue accounting choices are treated as the market size. |
The comparison shows that the spread is largely explained by scope and what the value is meant to represent, not by math errors. By keeping assumptions tied to observable activity drivers and then checking them with real-world contracting and utilization feedback, the final number stays easier to trace, repeat, and update when market conditions change.
Key Questions Answered in the Report
What is the current value of the Australia oil and gas market?
The Australia oil and gas market size reached USD 12.18 billion in 2026 and is forecast to keep expanding through 2031.
How fast is the sector growing over 2026-2031?
Aggregate revenue is projected to rise at a 3.94% CAGR as operators pursue higher-value, lower-carbon opportunities.
Which segment holds the largest revenue share?
Upstream operations led with 74.31% of Australia oil and gas market share in 2025, reflecting LNG export dominance.
Why is decommissioning considered a growth engine?
More than USD 60 billion in end-of-life offshore work has been identified, giving decommissioning a 5.42% CAGR through 2031.
How are emission regulations affecting investment?
Tightening Scope 1 caps under the Safeguard Mechanism redirect capital toward CCS, electrification, and digital optimization projects.
Where are new exploration permits being accelerated?
NOPTA reforms cut approval times in Commonwealth offshore waters by about 35%, stimulating renewed appraisal drilling activity.