
Market Overview
| Study Period | 2020 - 2031 |
|---|---|
| Forecast Data Period | 2026 - 2031 |
| Base Year Market Size (2025) | USD 1.89 Billion |
| Market Size (2026) | USD 1.96 Billion |
| Market Size (2031) | USD 2.32 Billion |
| Growth Rate (2026 - 2031) | 3.45 % |
| Market Concentration | Medium |
Major Players *Disclaimer: Major Players sorted in no particular order Image © Mordor Intelligence. Reuse requires attribution under CC BY 4.0. | |
Australia Office Furniture Market Analysis by Mordor Intelligence
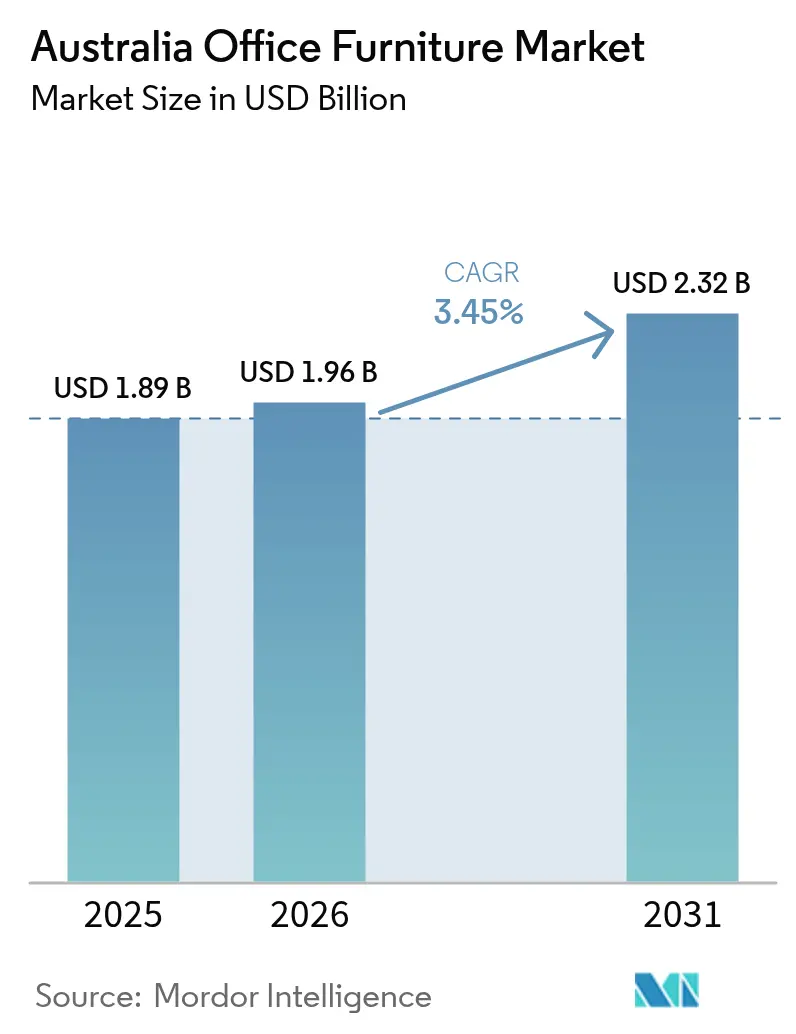
The Australia office furniture market size is expected to grow from USD 1.89 billion in 2025 to USD 1.96 billion in 2026 and is forecast to reach USD 2.32 billion by 2031 at 3.45% CAGR over 2026-2031. The measured growth reflects marked shifts toward hybrid work, stringent sustainability mandates, and rising wellness expectations that now shape every major corporate, government, and institutional procurement decision. Activity-based working models continue to gain ground, driving demand for modular, easily re-configurable furniture that can flex with fluctuating occupancy patterns. Government entities, wielding more than USD 46.7 billion (AUD 75 billion) in annual purchasing power, insist on circular-economy credentials, long warranties, and AFRDI certification as minimum entry requirements[1]. Meanwhile employers view ergonomics as an investment in productivity and risk mitigation, a stance underscored by the 44,000 serious injury claims recorded each year and dominated by musculoskeletal disorders[2]. These structural forces collectively protect baseline demand even as workstation density per employee trends lower.
Key Report Takeaways
- By product category, chairs led with 35.55% of the Australia office furniture market share in 2025 also chairs recorded the highest projected CAGR at 3.49% through 2031.
- By material, wood accounted for 45.00% of the Australia office furniture market share in 2025; plastic and polymer materials are forecast to expand at a 3.69% CAGR.
- By price range, the mid-range tier commanded 51.12% share of the Australia office furniture market size in 2025 whereas premium products are advancing at a 3.82% CAGR to 2031.
- By end-user, corporate offices contributed 41.02% to the Australia office furniture market in 2025, and hospitality and retail back-office spaces are projected to grow the fastest at 4.29% CAGR.
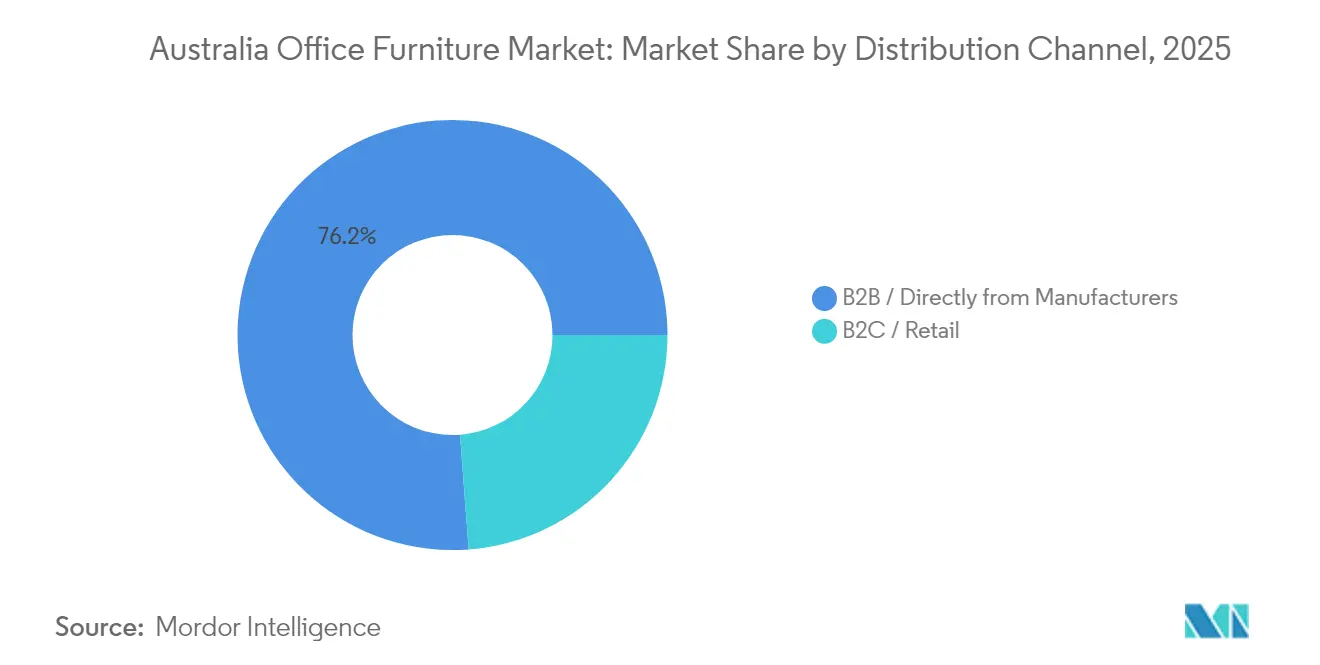
- By distribution channel, B2B direct-from-manufacturer sales represented 76.20% of the Australia office furniture market size in 2025 and are advancing at a 4.95% CAGR.
- By geography, New South Wales held 31.20% of the Australia office furniture market share in 2025; Queensland is set to log the quickest 4.53% CAGR through 2031.
Note: Market size and forecast figures in this report are generated using Mordor Intelligence’s proprietary estimation framework, updated with the latest available data and insights as of 2026.
Australia Office Furniture Market Trends and Insights
Drivers Impact Analysis*
| Driver | (~) % Impact on CAGR Forecast | Geographic Relevance | Impact Timeline |
|---|---|---|---|
| Hybrid & remote-working boom fuels demand for ergonomic furniture | +0.8% | National, concentrated in major cities | Medium term (2-4 years) |
| Corporate wellness initiatives prioritise posture-supportive seating | +0.6% | National, strongest in corporate sectors | Long term (≥ 4 years) |
| Government office-refurbishment pipeline | +0.4% | National, led by NSW and Victoria | Short term (≤ 2 years) |
| Green-lease clauses pushing circular-certified furniture uptake | +0.3% | Major cities, CBD locations | Medium term (2-4 years) |
| Subscription-based "furniture-as-a-service" models gain SME traction | +0.2% | Urban centres, SME clusters | Long term (≥ 4 years) |
| Smart-sensor-embedded desks offer workspace-analytics value | +0.2% | Technology hubs, large corporates | Long term (≥ 4 years) |
| Source: Mordor Intelligence | |||
Hybrid & Remote-Working Boom Fuels Demand for Ergonomic Furniture
Hybrid scheduling has become standard practice across Australia, pushing organizations to refresh layouts with agile zones that balance collaboration and focus. Modular desks, mobile dividers, and height-adjustable tables now serve as foundational components because facilities managers must rapidly re-configure floorplates without incurring costly refits. Chair specifications emphasize multi-point adjustability to support a rotating user base, and AFRDI certification is routinely stipulated to verify durability under heavy cycling. Employers increasingly subsidize home-office setups, extending demand beyond corporate towers into residences. Government case studies demonstrate quantifiable cost savings from flexible design that pairs unallocated seating with sit-stand desks, confirming that ergonomics can coexist with space consolidation[3].
Corporate Wellness Initiatives Prioritise Posture-Supportive Seating
Australia’s compensation framework incentivizes proactive risk management, and musculoskeletal disorders remain the number-one claim category. Companies therefore view premium chairs and sit-stand desks as preventative assets. AFRDI Level 6 seating that includes adjustable lumbar support, headrests, and dynamic tilt now forms the default specification for mid-to-large tenders. Price differentials of up to 60% over basic seating are tolerated because reduced absenteeism offsets capex. University studies that linked extended remote work with a 61% uptick in discomfort have prompted white-collar employers to extend bulk pricing to staff working from home, further widening the addressable base for certified seating.
Government Office-Refurbishment Pipeline
Federal and state departments continue rolling out multi-year fit-out programs that prioritize environmental reporting and lifecycle value. The Services Australia furniture panel requires suppliers to provide design, prototyping, installation, and documentation under a single umbrella contract, effectively favouring vendors with nationwide service coverage. Western Australia’s compulsory 10-year warranty on fit-out items raises the performance bar and embeds future maintenance revenue for compliant suppliers. These policies transform the public sector into a market-shaping customer that rewards manufacturers with in-country after-sales capabilities and cradle-to-grave product stewardship.
Green-Lease Clauses Pushing Circular-Certified Furniture Uptake
Premium office landlords now embed furniture reuse and take-back clauses into standard leases, compelling tenants to furnish space with items containing declared recycled content or validated refurbishment pathways. Circular specialists divert tens of thousands of kilograms from landfill by recovering, grading, and reselling office inventory, demonstrating a value chain that merges sustainability with cost efficiency. Corporate signatories to net-zero pledges rely on these services to shrink embodied-carbon footprints and avoid waste levies. Certifications such as GECA and FSC, once confined to wood products, now extend to entire workstation systems, making environmental provenance a competitive differentiator.
Restraints Impact Analysis*
| Restraint | (~) % Impact on CAGR Forecast | Geographic Relevance | Impact Timeline |
|---|---|---|---|
| Volatile wood, steel & foam prices squeeze manufacturer margins | -0.7% | National, manufacturing centres | Short term (≤ 2 years) |
| Activity-based working cuts work-station count per employee | -0.5% | Major cities, corporate sectors | Medium term (2-4 years) |
| Rising commercial real estate costs delay office fit-outs and expansions | -0.4% | CBDs of major cities (e.g., Sydney, Melbourne) | Medium term (2-4 years) |
| Import dependency exposes supply chains to shipping delays and currency fluctuations | -0.6% | Port cities, national distribution hubs | Short term (≤ 2 years) |
| Source: Mordor Intelligence | |||
Volatile Wood, Steel & Foam Prices Squeeze Manufacturer Margins
Input materials have experienced price swings far exceeding historical norms since 2022. Rising energy tariffs, shipping surcharges, and geopolitical trade actions drive cost spikes in steel frames, timber substrates, and polyurethane foams. A banking study shows that energy costs alone now contribute more than 20% of total steel production expense, eroding the savings traditionally gleaned from offshore sourcing[4]. Local manufacturers face a dilemma: absorb volatility and compress margins or pass costs to customers and risk losing tenders decided primarily on price. Extended government lead times offer limited relief because fixed-price contracts lock suppliers into exposures that last several years.
Activity-Based Working Cuts Work-Station Count Per Employee
The cultural shift away from one-desk-per-person arrangements structurally lowers baseline demand for conventional desks and task chairs. Occupancy analytics collected via IoT sensors show actual in-office rates averaging 35-50% on normal weekdays, allowing employers to comfortably de-densify. While organizations redirect some savings to collaboration zones and acoustic booths, those items carry a higher upfront cost but lower unit volumes. Suppliers therefore face a mixed revenue profile: fewer high-volume commodity orders counterbalanced by lumpier, design-intensive projects that demand bespoke solutions and longer sales cycles.
*Our forecasts treat driver/restraint impacts as directional, not additive. The impact forecasts reflect baseline growth, mix effects, and variable interactions.
Segment Analysis
By Product: Chairs Retain Dominance While Soft Seating Accelerates
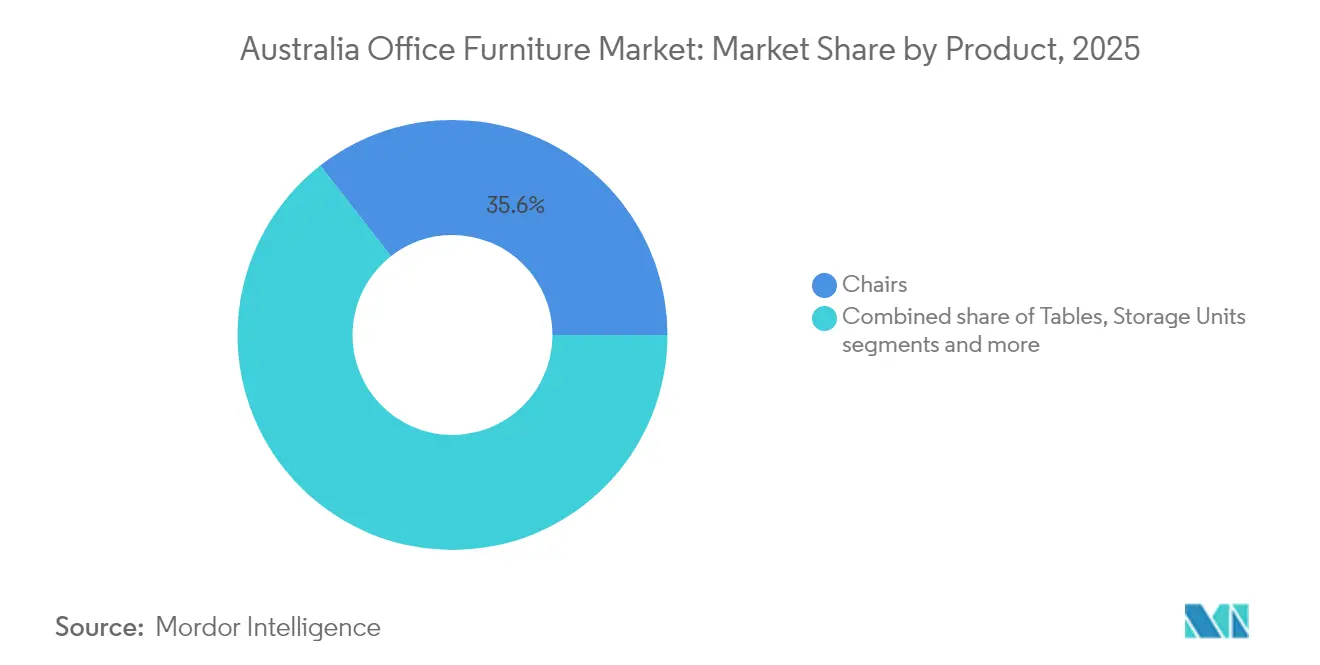
The Australia office furniture market size for chairs reached USD 672 million in 2025 and is expected to progress at a 3.49% CAGR to 2031. Chairs hold the largest Australia office furniture market share because every workplace strategy whether activity-based, hybrid, or traditional still mandates safe, posture-supportive seating. Key growth drivers include AFRDI certification requirements, corporate wellness mandates, and widespread home-office reimbursements. Premium operators such as Herman Miller and Steelcase concentrate on multi-point adjustability and breathable mesh to command price tags of USD 960 (AUD 1,500) per unit. At the same time, soft seating lines that feature modular sofas, ottomans, and lounge elements are growing faster because they cater to informal collaboration and hospitality-style zones.
The remainder of the product mix tables, storage, booths, and specialty pieces reflects a broader shift toward multipurpose components. Tables outfitted with power and data grommets see steady uptake as meeting spaces converge with digital collaboration suites. Storage is transitioning from bulky fixed cabinets to mobile caddies that support paper-light offices. Booths and acoustic pods mitigate noise in open plans and attract technology tenants. Collectively, these categories ride the same hybrid-work tailwinds but do not threaten chair leadership in absolute value terms.

By Material: Wood Leads but Polymer Gains Momentum
Wood-framed products accounted for 45.00% of the Australia office furniture market in 2025, supported by established supply chains and aesthetic preference for natural finishes. Sustainability guidelines now compel vendors to declare FSC or PEFC certification, nudging buyers toward engineered boards that yield higher recovery rates. Yet plastics and advanced polymers are the fastest-growing material group with a 3.69% CAGR. Innovation in bio-resins and closed-loop recycling allows polymer desks and chair shells to rival timber aesthetics while meeting circular-economy criteria. Suppliers highlight lighter weights and lower transport emissions to justify substitution.
Metal remains indispensable for structural integrity in height-adjustable desks and task-chair bases, though steel-price volatility challenges margin stability. Other materials such as acoustic felt made from recycled PET expand niche applications in phone booths and divider panels. The shifting mix obliges manufacturers to recalibrate sourcing networks and invest in multi-material production lines to remain competitive.
By Price Range: Mid-Range Rules, Premium Outpaces
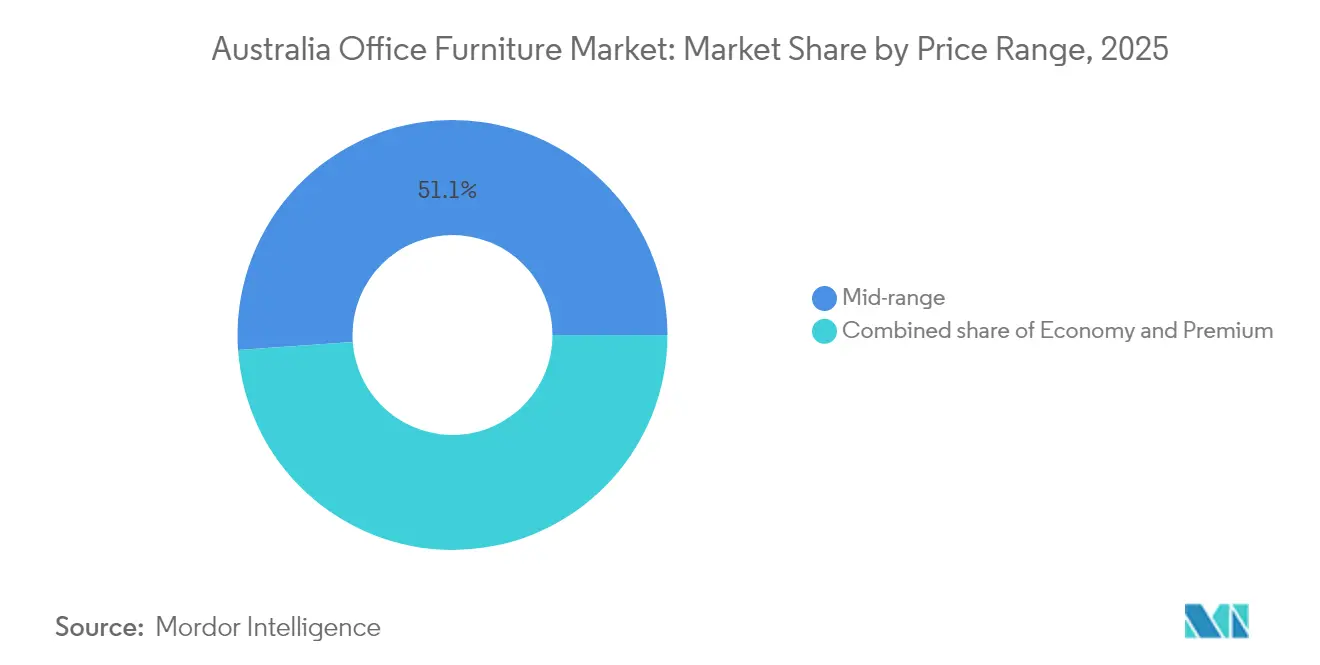
Mid-range solutions represented 51.12% of the Australia office furniture market size in 2025. They serve enterprise renewals and large-scale public tenders where value and compliance must balance fiscal prudence. Typical products price between USD 192 (AUD 300) and USD 450 (AUD 700) per seating unit and include five-year warranties. Premium products costing upward of USD 770 (AUD 1,200) for a task chair grow faster at 3.82% CAGR because employers link high-end ergonomics with talent attraction and brand equity. Premium purchases commonly integrate IoT sensors that capture real-time posture data and space utilization analytics, feeding corporate ESG dashboards. Economy offerings struggle to maintain share as raw-material inflation compresses cost structures and as more SMEs transition to subscription-based “furniture-as-a-service” plans that favor durable assets over disposable fittings.
Warranty length, modularity, and environmental certification now factor heavily in total cost-of-ownership calculations, blurring the line between traditional price tiers. Vendors able to document refurbishment pathways often command mid-tier price points while delivering premium sustainability scores, thereby widening their addressable audience.
By End-User: Corporate Offices Lead, Hospitality and Retail Surge
Corporate offices contributed 41.02% of market revenue in 2025. Demand centres on adaptable layouts that accommodate blended attendance patterns and dense video-conference scheduling. Employers invest in premium chairs, sit-stand desks, and occupancy-sensor-ready meeting pods to optimize space. However, hospitality and retail back-office spaces are the fastest-growing end-user group at 4.29% CAGR. These sectors upgrade legacy fit-outs to meet modern staff wellness standards and to support omnichannel operations that require flexible touchdown areas for merchandising and logistics teams.
Government and public agencies remain a stable anchor segment. Their long procurement cycles and stringent compliance rules create predictable demand for products meeting AFRDI Level 6, GECA certification, and 10-year warranties. Educational and healthcare buyers focus on durability, infection control, and accessibility, contributing steady but lower-growth revenue. The diverse end-user mix shields overall market value from sector-specific shocks and sustains baseline order flow for full-line manufacturers.
By Distribution Channel: B2B Direct Continues to Deepen
B2B direct-from-manufacturer relationships accounted for 76.20% of the Australia office furniture market in 2025, rising at a 4.95% CAGR. Sophisticated projects require bundled design, installation, and after-sales service, pushing buyers toward single-source contracts. Authorized dealers such as WorkArena leverage exclusive brand partnerships to simplify compliance paperwork and to coordinate multi-site rollouts. Retail and online channels cater mainly to micro-businesses and remote employees. Officeworks’ 171-store footprint ensures national reach but still positions the chain more as a “top-up” source than a full fit-out provider, a perception it hopes to change through its newly launched loyalty program.
Digital marketplaces that rely on drop-shipping models demonstrate the scalability of online routes, yet lead-time and assembly challenges limit their penetration into corporate accounts. Hybrid channel strategies where manufacturers maintain showrooms while integrating e-commerce portals for order tracking emerge as the norm.
Regulatory Landscape
Australia office furniture suppliers operate under a mix of mandatory consumer safety rules, import controls, and voluntary performance standards that are often written into tenders. A key recent change is the Consumer Goods (Toppling Furniture) Information Standard 2024 (registered 3 May 2024), which commenced on 4 May 2025 and is enforced by the Australian Competition and Consumer Commission (ACCC) under the Australian Consumer Law. The requirements cover warning labels, point-of-sale messaging, and anchoring instructions for specified storage furniture, and the ACCC has publicly highlighted high non-compliance rates in market surveillance.
For timber-based office furniture, importers and suppliers must maintain a written due diligence system under the Illegal Logging Prohibition Act 2012 and the updated Illegal Logging Prohibition Rules 2024, with records retained for at least five years. Imported wooden articles are also subject to Department of Agriculture, Fisheries and Forestry biosecurity controls via the BICON system, while commercial procurement commonly references AS/NZS standards (such as AS/NZS 4442:2018 for office desks and AS/NZS 4688:2018 for chairs) and third-party testing, including AFRDI Blue Tick certification, to manage durability, safety, and liability expectations in corporate and government fit-outs.
Value Chain Analysis
The Australia office furniture value chain runs from raw-material inputs (timber panels and veneer, steel components, foams, fabrics, and plastics/polymers) through conversion and assembly (local manufacturers focused on commercial systems and custom fit-outs, alongside importers supplying higher-volume standardized products). It then reaches downstream specification-led distribution.
Demand is channeled primarily through B2B direct contracting for large organizations, where projects bundle design, prototyping, delivery, installation, and after-sales support, and through dealer networks and omnichannel retailers serving SMEs and home-office buyers. Compliance and certification requirements influence multiple nodes of the chain, from timber-origin documentation for wood products to safety labeling obligations for certain furniture categories, which increases the need for traceability and quality assurance in sourcing and packaging. Industry bodies such as the Australian Furniture Association (AFA) provide compliance guidance and coordination through the AFA Regulatory Committee (AFARC), while third-party test and certification pathways (for example AFRDI against relevant AS/NZS benchmarks) help suppliers qualify for government and enterprise specifications that emphasize durability, warranties, and lifecycle value.
Competitive Landscape
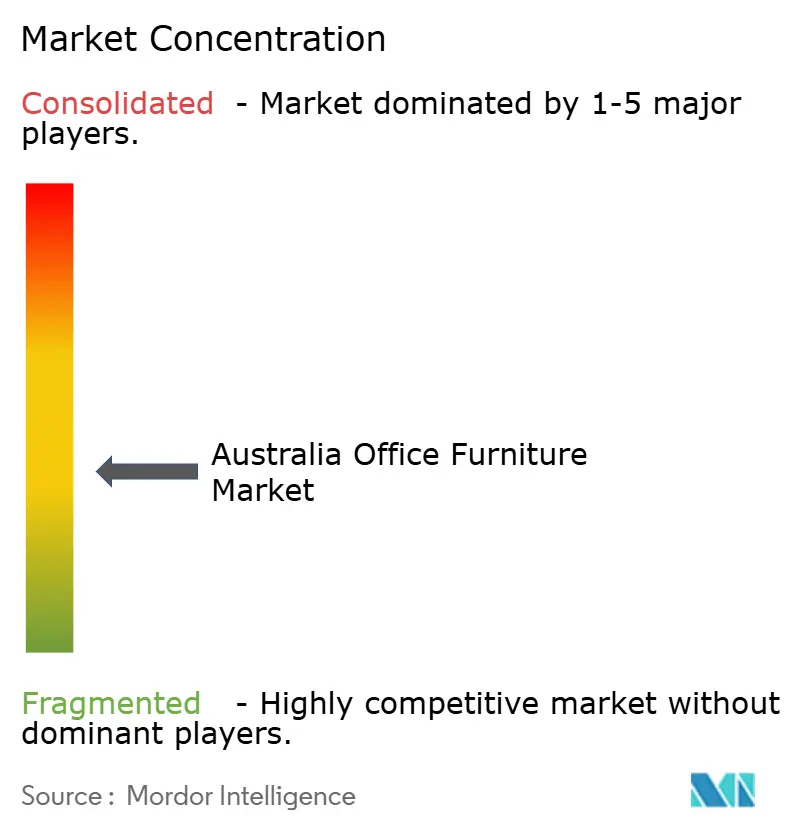
The Australia office furniture market shows moderate concentration, with the top five suppliers accounting for nearly half of total revenue. Officeworks holds the leading position, benefiting from its strong omnichannel presence and a growing portfolio of B2B services. FY2024 earnings rose 4.0% to USD 133.12 million (AUD 208 million) despite a softer furniture category, and management expects its 2025 loyalty program to deepen enterprise penetration. Herman Miller now operating under the MillerKnoll umbrella secures 10.0% share by pairing signature designs with authorized dealer services that satisfy government warranty criteria. IKEA Australia ranks third at 8.0%, leveraging flat-pack logistics and circular-economy pledges to resonate with cost-sensitive SME buyers.
Specialized players create white-space differentiation through technology and sustainability. Butlr integrates thermal sensors into chair bases, providing anonymized usage data and facilitating real-time occupancy dashboards. Egans achieves 80% landfill diversion across an annual volume of 120,000 furniture pieces via remanufacturing, catering to corporations that must document waste-reduction targets. Multinationals face regional profit pressure: Steelcase’s APAC revenues fell 8% organically in FY2025, highlighting how price-sensitive public tenders and shipping costs erode margins.
Strategic alliances have become common. Manufacturers partner with prop-tech firms to embed sensors, while circular specialists collaborate with landlords to streamline defits. The convergence of furniture, data analytics, and environmental compliance redefines competitive advantage beyond mere product aesthetics or price.
Australia Office Furniture Industry Leaders
-
Officeworks
-
IKEA Australia
-
Winc Australia
-
Steelcase
-
Herman Miller / MillerKnoll (WorkArena)
- *Disclaimer: Major Players sorted in no particular order
Market Opportunities and Future Outlook
Sustainability-led procurement and reporting are creating near-term whitespace for suppliers that can document low-impact materials, traceable sourcing, and end-of-life pathways across full fit-outs, not only individual products. Mandatory sustainability reporting standards under AASB S2 (effective from January 2026 for covered entities) increase attention on Scope 3 impacts tied to workplace operations and fit-outs, which supports the commercial value of documented recycled content, FSC-aligned wood inputs, and measurable refurbishment or take-back outcomes.
Supply-chain risk management is also shifting buying criteria toward local availability and serviceability, especially for multi-site and regional projects where lead times can drive project overruns. Industry reporting in May 2026 pointed to procurement preference moving toward vendors with local stock-holding capacity, and company actions such as Krost opening a Brisbane showroom (March 2026) and new local manufacturing activity in Perth (March 2026) highlight a pathway for faster delivery, configuration support, and after-sales coverage. At the same time, hybrid-work layouts continue to push specification toward higher-performance acoustic solutions and modular systems, which supports opportunities for suppliers that can package furniture, acoustic components, and installation into single-source contracts aligned to corporate and public-sector compliance expectations.
Recent Industry Developments
- June 2026: Winc Australia confirmed a partnership with Choice Hotels Asia-Pac to support deliveries across more than 120 properties. The move strengthens Winc’s penetration in hospitality and multi-site accounts that typically require standardized, repeatable ordering and coordinated logistics, adjacent to back-office furniture needs.
- October 2025: IKEA Australia expanded its zero-emission delivery footprint into additional regional postcodes, supported by a new leasing model with CarBon Leasing for four Volvo FL long-range electric trucks. This investment supports service levels outside major metro areas and reinforces sustainability-led differentiation in bulky product delivery.
- November 2024: Officeworks launched a same-day printing service across 45 stores nationwide by installing Konica Minolta AccurioPress C4080 digital press systems. The rollout broadens in-store business services that bundle with workplace purchases and strengthens Officeworks’ role in serving small businesses and hybrid workers through a single destination.
Research Methodology Framework and Report Scope
Market Definition and Coverage
For this study, the market covers office furniture sales in Australia, measured in value, across furniture bought for workplaces and office setups, including seating, desks, workstations, storage, and related items.
Scope exclusions: We exclude non-furniture fit-out work (such as electrical, HVAC, flooring, and building construction) and small office supplies that are not durable furniture.
Segmentation Overview
- By Product
- Chairs
- Employee Chairs
- Meeting Chairs
- Guest Chairs
- Tables
- Conference Tables
- Desks
- Other Tables
- Storage Units
- Filing Cabinets
- Bookcases & Shelving
- Sofas/Soft Seating
- Booths & Office Dividers
- Other Office Furniture (Stools, Reception Area Furniture, Accessories, Others)
- Chairs
- By Material
- Wood
- Metal
- Plastic & Polymer
- Other Materials
- By Price Range
- Economy
- Mid-range
- Premium
- By End-user
- Corporate Offices
- Healthcare Offices
- Educational Institutions
- Government & Public Offices
- Hospitality & Retail Back-office
- Others
- By Distribution Channel
- B2C / Retail
- Home Centers
- Specialty Furniture Stores
- Online
- Other Channels
- B2B / Direct from Manufacturers
- B2C / Retail
- By Geography
- New South Wales
- Victoria
- Queensland
- Western Australia
- South Australia
- Tasmania
- Australian Capital Territory & Northern Territory
Data Sources, Market Sizing, and Validation
Desk Research
We start by mapping the supply and demand context for office furniture in Australia so the sizing model is anchored to real economic and trade signals. Public sources used for this include, such as the Australian Bureau of Statistics for construction, business conditions, and state-level activity, and the Australian Border Force and customs trade statistics for furniture import and export movements. To keep product definitions consistent, reference standards and classifications are checked using sources such as the Australian Government legislation and standards portals and relevant industry association pages for furniture and workplace design.
Company annual reports, investor presentations, and reputable business press are then reviewed to understand pricing direction, channel shifts, and capacity or footprint changes that can move the market. Where available, we also use paid subscriptions for company financials and intelligence, patent databases, and import or export shipment-level views to cross-check direction of change and spot gaps. The desk sources listed here are not exhaustive, and many other public and paid sources are also used for data collection, validation, and research clarification.
Primary Interviews and Surveys
Our primary work focuses on validating what is being purchased, how buyers are budgeting, and how pricing is moving across major product lines, since public data alone does not explain mix shifts very well. We speak with stakeholders across manufacturers, distributors, large buyers, and workplace decision-makers, and responses are balanced across Australia to reflect differences in demand across key states and territories.
Distribution of primary research fieldwork respondents
| Company type | Respondent position |
|---|---|
| Top tier: 27% | CXOs: 22% |
| Mid tier: 51% | Functional/Unit leaders: 20% |
| Smaller Players: 22% | Managers: 58% |
Market-Sizing & Forecasting
The main sizing path uses a top-down approach where office furniture demand is reconstructed from Australia workplace activity and replacement cycles, and it is then distributed across product groups based on observed purchasing patterns. In practice, we tie the model to variables such as office-using employment, business counts by industry, commercial office occupancy and fit-out activity, furniture import values and volumes, and price movement for key categories like seating and workstations.
To keep totals realistic, results are corroborated with selective bottom-up approximations. This includes sampled average selling prices multiplied by estimated unit volumes for major categories, channel checks with distributors, and revenue range roll-ups for a small set of representative suppliers where disclosure allows it. Where parts of the market are hard to observe directly, gaps are handled by using conservative penetration and replacement assumptions that are then reviewed through interviews, before being locked into the final model.
For forecasting, we rely on scenario analysis supported by a simple multivariate view of the main drivers, since office utilization, construction timing, and procurement cycles can shift faster than long-run averages. Assumptions on volumes and prices are stress-tested against expert expectations on hybrid work adoption, refurbishment cadence, and sustainability-led product substitution, and then the final forecast curve is chosen for consistency with the full set of signals.
Data Validation & Update Cycle
We validate results by triangulating the modeled market value against independent signals, including trade flows, construction and fit-out indicators, and supplier commentary on order pipelines. If an output looks unusual, such as a sudden jump in implied pricing or an unrealistically high per-worker spend, it is flagged and rechecked, and then the assumptions are revisited until the variance is explainable.
Before sign-off, the work goes through multi-step analyst review with checks on year-to-year continuity, currency consistency, and state-level splits. Reports are refreshed annually, and interim updates are made when material events occur, such as sharp changes in import pricing, policy shifts affecting building activity, or major channel disruptions. Before delivery, an analyst performs a final pass so clients receive the latest updated view.
Mordor Intelligence's Australia Office Furniture Market Size Versus Other Published Estimates
Published market sizes for Australia office furniture often differ because the scope boundary is not always the same, and the checks used to validate volumes and pricing are not always explained. Differences also come from the timing of currency conversion, how replacement demand is treated, and whether the estimate is tied to observable activity in offices or to broader furniture spending.
Import and export movements for furniture, along with state-level workplace and fit-out indicators, are the evidence points used to keep the 2025 value aligned to a realistic demand pool in Mordor Intelligence's estimate, instead of letting broad furniture categories inflate the total.
Benchmark comparison
| Source | Market Size | Gaps in Research Methodology |
|---|---|---|
| Mordor Intelligence | USD 1.89 B (2025) | |
| Trade Journal A | USD 1.14 B (2024) | Uses a narrower demand base tied to reported market value for a specific year and may undercount contract-led corporate refresh cycles and parts of imported volume captured through distributor channels. |
| Industry Brief B | USD 1.80 B (2024) | Often blends office furniture with adjacent workplace interiors or broader furniture spend, and the price and mix progression is less transparent, which can shift the total depending on what is included. |
The spread across published figures is mainly explained by what is counted as office furniture, how channel coverage is treated, and how prices are rolled forward from the base year. By tying the size to observable activity signals and then checking totals with practical supplier and channel feedback, the estimate remains traceable to clear inputs and repeatable steps.
Key Questions Answered in the Report
What is the current value of the Australia office furniture market?
The market stands at USD 1.96 billion in 2026.
How fast is demand for premium ergonomic chairs growing?
Premium seating is expanding at a 3.82% CAGR through 2031.
Which Australian state generates the highest furniture revenue?
New South Wales led with 31.20% share in 2025.
Why are circular-certified products gaining traction among Australian tenants?
Green-lease clauses and federal procurement rules require recycled content and take-back programs, pushing buyers toward circular solutions.
Which distribution channel dominates sales to large organizations?
B2B direct-from-manufacturer sales hold 76.20% share and continue to rise.
How does activity-based working influence workstation demand?
Shared-desk models reduce the number of dedicated desks but increase spending on collaborative pods and modular elements.