
Market Overview
| Study Period | 2021 - 2031 |
|---|---|
| Forecast Data Period | 2026 - 2031 |
| Base Year Market Size (2025) | USD 6.22 Billion |
| Market Size (2026) | USD 6.52 Billion |
| Market Size (2031) | USD 8.27 Billion |
| Growth Rate (2026 - 2031) | 4.85 % |
| Market Concentration | Medium |
Major Players *Disclaimer: Major Players sorted in no particular order Image © Mordor Intelligence. Reuse requires attribution under CC BY 4.0. | |
Australia Nutraceuticals Market Analysis by Mordor Intelligence
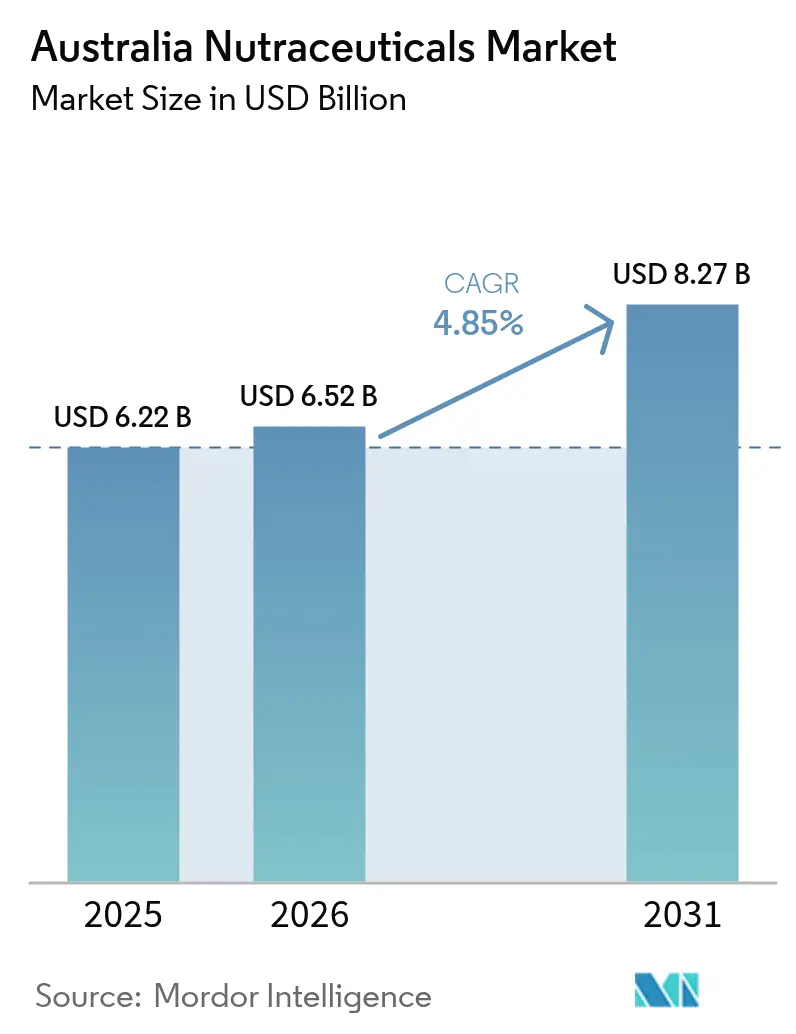
The Australia nutraceuticals market size was valued at USD 6.22 billion in 2025, is expected to grow to USD 6.52 billion in 2026, and is projected to reach USD 8.27 billion by 2031, registering a compound annual growth rate (CAGR) of 4.85% during the period 2026–2031. The market's growth is primarily driven by increasing consumer focus on preventive healthcare, heightened awareness of immune resilience, and a growing preference for proactive wellness management. Consumers are incorporating dietary supplements, functional foods, and fortified beverages into their daily routines to enhance immunity, digestive health, cognitive function, metabolic balance, and overall well-being. Furthermore, rising participation in fitness and sports activities is boosting the demand for protein supplements, performance enhancers, and recovery-oriented formulations, contributing to the market's expansion.
Key Report Takeaways
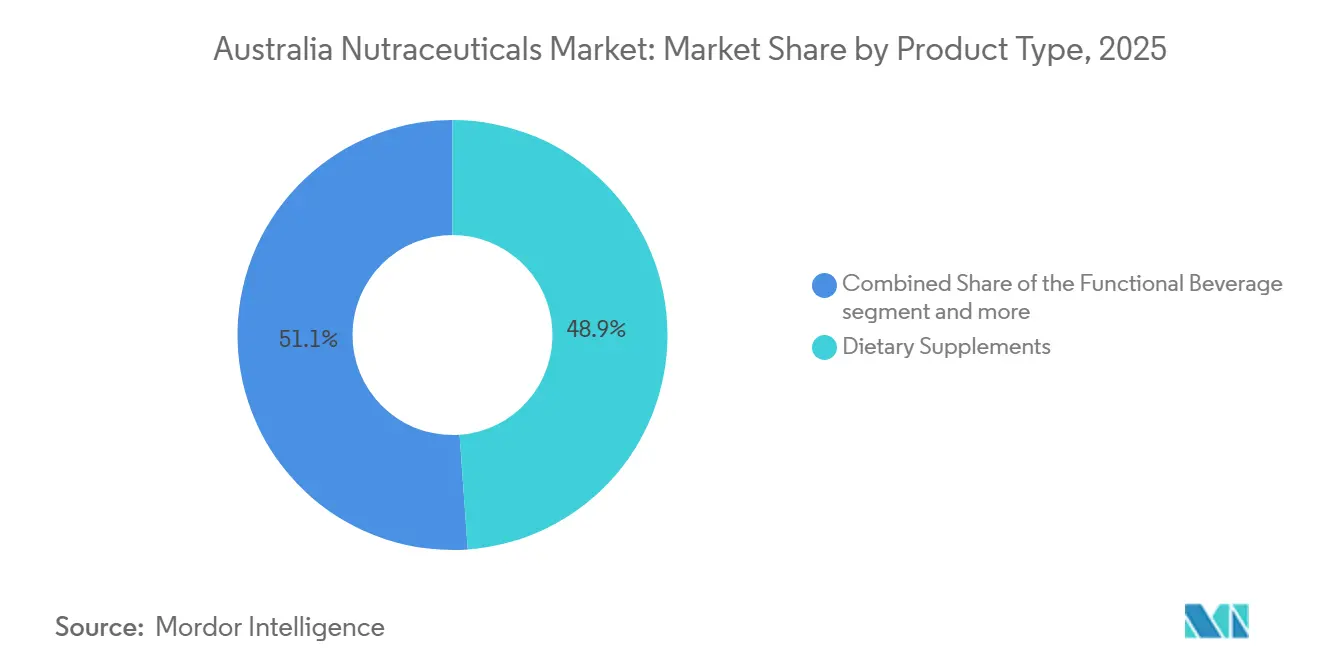
- By product type, dietary supplements led with 48.87% of Australia nutraceuticals market share in 2025. Functional beverages are forecast to post the fastest growth at a 5.65% CAGR through 2031, outpacing category averages.
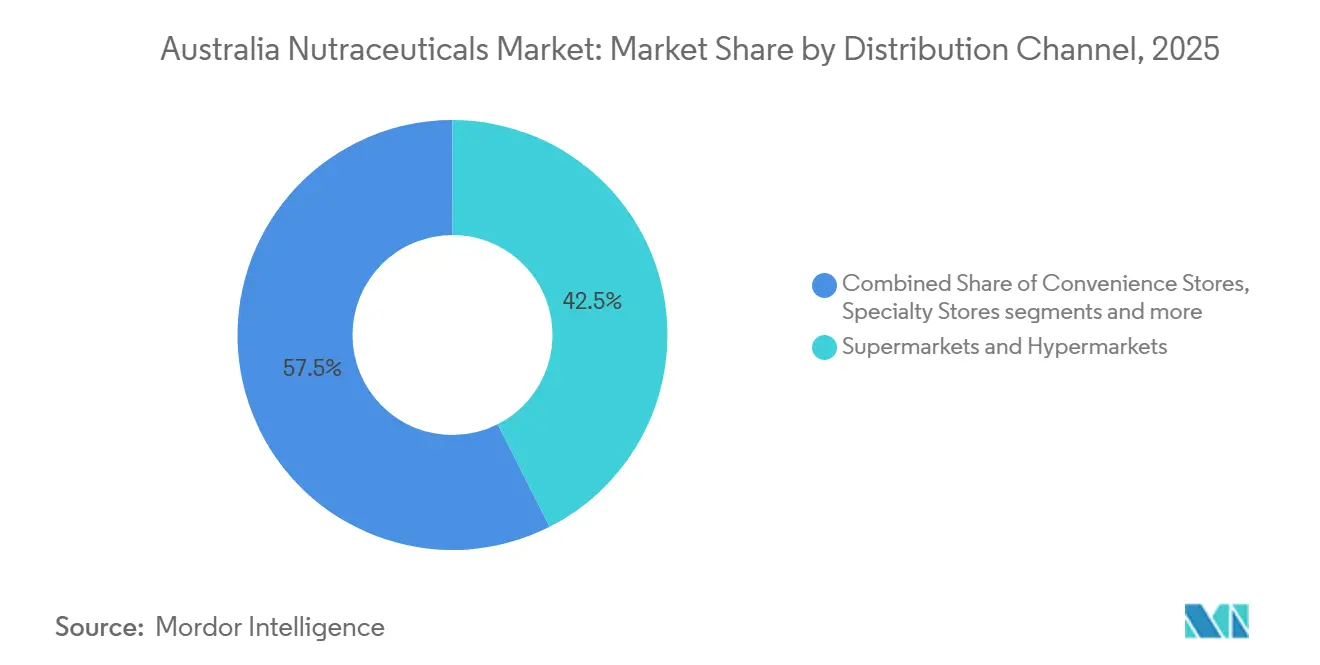
- By distribution channel, supermarkets and hypermarkets commanded 42.54% value in 2025, whereas online retail stores are projected to expand at a 6.12% CAGR, the quickest among all channels.
Note: Market size and forecast figures in this report are generated using Mordor Intelligence’s proprietary estimation framework, updated with the latest available data and insights as of 2026.
Australia Nutraceuticals Market Trends and Insights
Drivers Impact Analysis*
| Driver | (~) % Impact on CAGR Forecast | Geographic Relevance | Impact Timeline |
|---|---|---|---|
| Continued demand for immune-support products | +1.2% | Australia (national, with urban concentration in Sydney, Melbourne, Brisbane) | Medium term (2-4 years) |
| Increasing prevalence of chronic diseases such as diabetes | +1.5% | Australia (national, higher in regional areas with aging demographics) | Long term (≥ 4 years) |
| Popularity of plant-based and vegan nutraceuticals | +0.9% | Australia (urban centers, coastal regions with higher health consciousness) | Medium term (2-4 years) |
| Surge in sports nutrition and performance-enhancing supplements | +0.8% | Australia (national, concentrated in 18-49 age cohort) | Short term (≤ 2 years) |
| Sustainability, provenance and ethical sourcing | +0.6% | Australia (export-oriented brands, urban consumers) | Long term (≥ 4 years) |
| Technological advancements in product formulations | +0.7% | Australia (national, driven by Research and Development hubs in Melbourne, Sydney) | Medium term (2-4 years) |
| Source: Mordor Intelligence | |||
Continued demand for immune-support products
Consumer emphasis on immune health continues to drive the growth of the nutraceuticals market in Australia. Post-pandemic, the focus on preventive health strategies persists, sustaining demand for immune-support supplements such as vitamin C, vitamin D, zinc, elderberry, echinacea, and probiotics. Increased awareness of seasonal illnesses, respiratory health, and overall well-being has led to the widespread adoption of daily immune supplementation across various age groups. Furthermore, advancements in delivery formats, including gummies, effervescent tablets, powders, and functional beverages, have enhanced accessibility and convenience, appealing to younger consumers and those with lifestyle-oriented preferences. As preventive healthcare gains further importance in Australia, immune-support products remain a key growth driver within the nutraceuticals market, creating more opportunities for innovation and market expansion.
Increasing prevalence of chronic diseases such as diabetes
The increasing prevalence of chronic diseases, particularly diabetes, is a key factor driving the growth of the nutraceuticals market in Australia. As lifestyle-related health conditions become more widespread, consumers are increasingly seeking dietary supplements and functional nutrition products to enhance health management and mitigate associated risks. For example, the International Diabetes Federation reported that in 2024, 7.4% of adults were living with diabetes, underscoring the rising burden of metabolic disorders [1]. This growing prevalence is significantly boosting demand for nutraceutical products aimed at blood sugar management, cardiovascular health, weight control, and metabolic balance. Additionally, the adoption of preventive supplementation strategies under medical supervision by individuals with diabetes or pre-diabetic conditions is further driving consistent and sustained product demand, highlighting the critical role of nutraceuticals in proactive health management.
Popularity of plant-based and vegan nutraceuticals
The rising adoption of plant-based and vegan lifestyles is a significant driver of the nutraceuticals market in Australia. Growing consumer demand for clean-label, sustainably sourced, and cruelty-free products has increased the popularity of plant-derived vitamins, minerals, herbal extracts, algae-based omega-3, and botanical protein supplements. Consumers are actively seeking alternatives to animal-based ingredients such as gelatin capsules, fish oil, and whey protein. This has encouraged manufacturers to develop vegan capsules, pea and rice protein blends, and plant-based bioactives. The trend is further supported by greater awareness of environmental sustainability and ethical consumption, particularly influencing purchasing decisions among younger demographics and urban populations. Additionally, plant-based nutraceuticals are being marketed not only to vegans but also to flexitarians and health-conscious consumers, who view botanical ingredients as more natural and easier to digest.
Surge in sports nutrition and performance-enhancing supplements
The increasing adoption of fitness and active lifestyles is significantly driving the market, particularly in the areas of sports nutrition and performance-enhancing supplements. The growing participation in gym workouts, strength training, endurance sports, and recreational fitness activities is further accelerating demand for products such as protein powders, branched-chain amino acids (BCAAs), creatine, electrolyte blends, recovery supplements, and functional hydration solutions. According to the Australian Sports Commission (ASC), approximately 6.73 million people in Australia engaged in fitness or gym activities in 2024, highlighting a robust and expanding consumer base for sports-focused nutraceuticals [2]. This high level of participation continues to strongly enhance demand for products aimed at muscle recovery, endurance improvement, weight management, and performance optimization, creating sustained growth opportunities for the market.
Restraints Impact Analysis*
| Restraint | (~) % Impact on CAGR Forecast | Geographic Relevance | Impact Timeline |
|---|---|---|---|
| Stringent regulatory framework | -0.8% | Australia (national, affecting all manufacturers and importers) | Long term (≥ 4 years) |
| Complex ingredient approval and reformulation risks | -0.5% | Australia (national, higher impact on innovative formulations) | Medium term (2-4 years) |
| Increasing scrutiny on health claims | -0.6% | Australia (national, digital advertising most affected) | Short term (≤ 2 years) |
| Market saturation and brand proliferation | -0.7% | Australia (urban markets, pharmacy and online channels) | Medium term (2-4 years) |
| Source: Mordor Intelligence | |||
Stringent regulatory framework
A stringent regulatory framework serves as a significant restraint in the Australian nutraceuticals market. Companies are required to enhance their compliance with strict safety, labeling, formulation, and health-claim regulations before commercializing their products. Oversight by authorities such as Food Standards Australia New Zealand (FSANZ), along with complementary therapeutic goods regulations, enforces rigorous standards on ingredient approvals, permissible health claims, contaminant limits, and advertising practices. These regulations often extend product development timelines and increase compliance costs, particularly for smaller manufacturers and new entrants. Additionally, frequent updates to ingredient standards, novel food approvals, and the need for evidence-based substantiation of functional claims may require reformulation or further clinical validation, delaying market entry.
Complex ingredient approval and reformulation risks
Complex ingredient approval processes and reformulation requirements present significant challenges in the Australian nutraceuticals market. Manufacturers must ensure that all active ingredients, excipients, and health claims meet regulatory standards prior to commercialization, which can extend product development timelines. Approval processes for novel foods, botanical extracts, probiotics, and bioactive compounds often demand extensive safety data, stability testing, and scientific validation. Reformulation challenges are particularly pronounced for global brands adapting products to the Australian market, as ingredient concentrations and health claims permitted elsewhere may not comply with local regulations. Changes in emerging safety evaluations or updated evidence requirements can lead to additional testing costs, packaging modifications, or even temporary product withdrawals. These complexities contribute to operational uncertainty, increase compliance costs, and may delay innovation cycles.
*Our forecasts treat driver/restraint impacts as directional, not additive. The impact forecasts reflect baseline growth, mix effects, and variable interactions.
Segment Analysis
By Product Type: Functional Beverages Accelerate as Convenience Trumps Capsules
Dietary supplements accounted for 48.87% of the total market share in 2025, emerging as the leading category due to their integration into daily health routines and preventive healthcare practices. This position is supported by sustained consumer demand for vitamins, minerals, herbal supplements, probiotics, omega-3 fatty acids, and condition-specific formulations targeting areas such as immunity, bone health, heart health, digestive wellness, sleep, and cognitive function. Regulatory oversight by the Therapeutic Goods Administration enhances consumer confidence in listed (AUST L) products, fostering trust and encouraging repeat purchases. Growing awareness of micronutrient deficiencies, lifestyle-related health concerns, and the increasing focus on immune resilience continue to drive consistent growth in this category.
Functional beverages are projected to grow at a CAGR of 5.65% through 2031, reflecting a rising consumer preference for convenient, ready-to-consume wellness solutions that combine nutrition with functionality. This segment includes fortified drinks, protein beverages, and probiotic drinks that address needs such as immunity, hydration, gut health, cognitive performance, and sports recovery. Increasing demand for on-the-go nutrition, clean-label formulations, and reduced-sugar or naturally sweetened beverages is driving product innovation. The shift away from traditional carbonated soft drinks toward health-oriented alternatives further supports growth in this category. Additionally, advancements in ingredient technologies, such as stable probiotics, plant-based proteins, adaptogens, and nootropic compounds, are enabling manufacturers to deliver clinically relevant benefits in beverage formats.

By Distribution Channel: E-Commerce Disrupts Pharmacy Gatekeepers
Supermarkets and hypermarkets accounted for 42.54% of the total distribution share in 2025, maintaining their leading position due to strong consumer footfall, a wide product assortment, and convenience-driven purchasing behavior. Their competitive pricing strategies, frequent promotional campaigns, loyalty programs, and in-store visibility further bolster sales volumes. Additionally, these outlets offer the convenience of combining grocery and health-related purchases in a single trip, encouraging impulse buying and repeat purchases. The increasing availability of clean-label, plant-based, and condition-specific nutraceutical products within these stores has further enhanced category penetration among mainstream shoppers.
Online retail stores are projected to grow at a CAGR of 6.12% through 2031 in the Australia nutraceuticals market, supported by increasing digital engagement, convenience-led purchasing behavior, and the adoption of direct-to-consumer strategies by supplement brands. Australia's robust digital infrastructure significantly contributes to this growth. For example, according to the International Telecommunication Union (ITU), 96.1% of Australia’s population was using the internet in 2024, reflecting near-universal digital access and a highly connected consumer base [3]. This high level of internet penetration facilitates online discovery, product comparison, subscription models, and access to detailed ingredient transparency, all of which are key factors influencing nutraceutical purchasing decisions.
Geography Analysis
Australia's nutraceuticals market exhibits significant geographic concentration in major metropolitan areas such as Sydney, Melbourne, and Brisbane. These cities experience higher per-capita nutraceutical consumption compared to the national average, driven by elevated health awareness, dense retail networks, greater penetration of gyms and wellness centers, and a strong pharmacy presence. The well-developed omnichannel retail ecosystem in these urban hubs, encompassing supermarkets, specialty health stores, and digital commerce platforms, enhances product visibility and accessibility. Additionally, the multicultural demographics of these cities contribute to diversified demand across categories such as herbal supplements, probiotics, sports nutrition, and functional beverages, fostering category growth and product innovation.
Outside the primary metropolitan areas, cities like Perth, Adelaide, and Canberra are experiencing steady growth in nutraceutical adoption. These markets are witnessing increasing demand for condition-specific supplements, plant-based formulations, and sports nutrition products, supported by rising lifestyle awareness and the expansion of organized retail infrastructure. Canberra, in particular, demonstrates strong demand for premium and clinically validated formulations, attributed to higher levels of health literacy. Meanwhile, Perth and Adelaide benefit from the growth of pharmacy networks and supermarket-led health aisles, which further support market expansion.
In regional and semi-urban areas such as Newcastle, Wollongong, Townsville, and Hobart, the nutraceutical market is characterized by a higher proportion of elderly residents and a greater prevalence of chronic health conditions. This demographic profile drives above-average penetration of supplements targeting bone health, cardiovascular support, and immunity. However, the limited availability of specialty retail outlets in these areas restricts in-store product variety. As a result, pharmacy chains and online retail channels play a critical role in ensuring consistent product supply and accessibility. E-commerce and mail-order pharmacy services are increasingly essential in bridging geographic gaps and meeting consumer demand in these regions.
Regulatory Landscape
Australia does not regulate nutraceuticals under a single standalone category. Products are covered either under the Therapeutic Goods Administration (TGA) framework as therapeutic goods (including complementary medicines entered on the Australian Register of Therapeutic Goods as listed medicines, such as AUST L products) or under Food Standards Australia New Zealand (FSANZ) as foods regulated by the Australia New Zealand Food Standards Code, depending on composition, presentation, and intended claims. The TGA Food-Medicine Interface Guidance Tool is commonly used to determine the correct pathway and manage misclassification risk, particularly for borderline formats such as gummies, powders, and fortified beverages.
Regulatory requirements tighten around ingredients, labeling, and the substantiation of health claims. FSANZ requirements for nutrition and health claims (including Standard 1.2.7) shape how functional foods and beverages communicate benefits, while TGA-listed complementary medicines require sponsor-held evidence and remain subject to risk-based post-market compliance activity. As an update to compliance conditions, the Therapeutic Goods (Permissible Ingredients) Determination (No. 1) 2026 commenced on 1 March 2026, updating requirements for ingredients used in listed medicines, and the TGA published Compliance Principles for 2026 and 2027 to reinforce proactive, risk-based enforcement.
Competitive Landscape
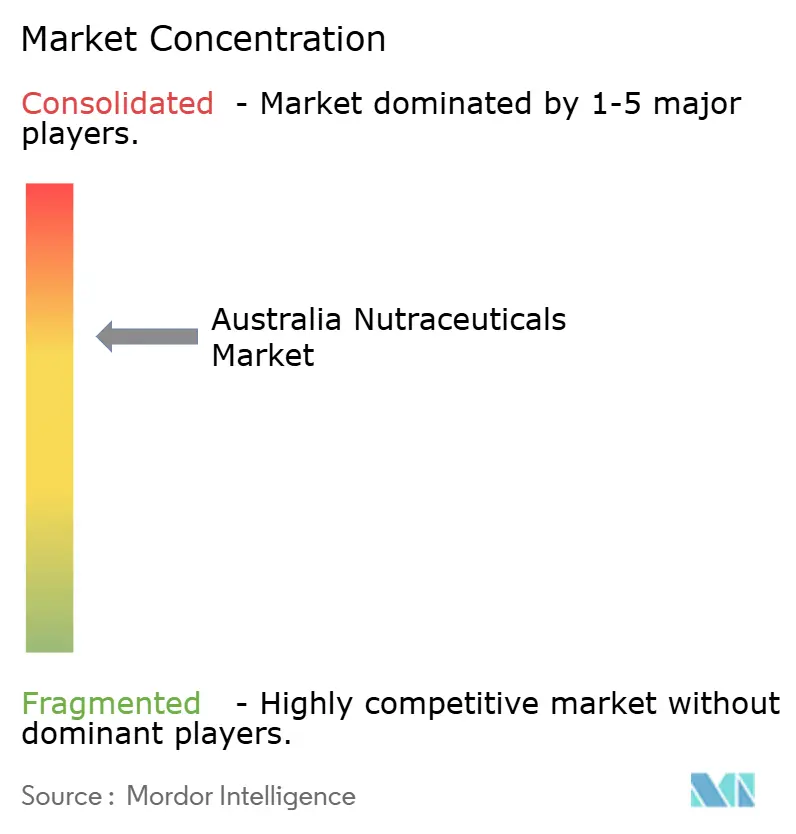
The Australian nutraceuticals market demonstrates moderate concentration, with a combination of multinational corporations and established domestic brands competing in dietary supplements, functional foods, and functional beverages. Key global players, including Herbalife Nutrition Ltd., General Mills, Inc., PepsiCo, Inc., Nestlé S.A., and Haleon plc, maintain a significant presence through diversified product portfolios, established distribution networks, and strong brand equity in health and wellness categories. These companies utilize economies of scale, research and development (R&D) capabilities, and regulatory expertise to sustain their competitive positions. Additionally, they are expanding their premium, condition-specific, and clean-label offerings to align with shifting consumer preferences.
Market competition is driven by ongoing product innovation, strategic partnerships with retailers and pharmacies, and diversification into adjacent health categories. Large food and beverage companies are increasingly fortifying products with vitamins, minerals, probiotics, and botanical extracts to strengthen their presence in functional nutrition. Meanwhile, supplement-focused companies prioritize clinically validated ingredients and adherence to Australia’s regulatory standards to build consumer trust. The presence of private-label brands in supermarkets further intensifies price competition, prompting differentiation through formulation quality, innovative packaging, and targeted health benefits.
Emerging opportunities in the market are centered on delivery innovation and demographic-specific targeting. Companies are adopting AI-driven recommendation engines, personalized supplement quizzes, subscription-based auto-replenishment models, and direct-to-consumer (DTC) e-commerce platforms to improve customer retention and lifetime value. The integration of technology allows brands to collect consumer data, refine product recommendations, and provide tailored wellness solutions for specific segments, including women’s health, aging populations, sports nutrition users, and plant-based consumers.
Australia Nutraceuticals Industry Leaders
-
Herbalife Nutrition Ltd.
-
General Mills, Inc.
-
PepsiCo, Inc.
-
Nestlé S.A.
-
Haleon plc
- *Disclaimer: Major Players sorted in no particular order
Market Opportunities and Future Outlook
Opportunities are concentrated in products and channels where consumers are already shifting behavior toward convenience, customization, and condition-led wellness. Functional beverages and sports-linked formulations fit demand tied to fitness and gym participation (6.73 million people in 2024, per the Australian Sports Commission), while online discovery and repeat purchase mechanics align with Australia having 96.1% internet penetration in 2024 (ITU). Within supplements, growth is most visible in compliant, format-led innovation (gummies, effervescents, ready-to-mix powders) that fits within TGA and FSANZ claim boundaries while improving adherence and ease of use.
On the supply side, building manufacturing capability and scaling infrastructure supports local manufacturing and ingredient innovation. Australia has 81 TGA-licensed complementary medicine manufacturing facilities (concentrated in New South Wales, Victoria, and Queensland), and the Central Coast Food Manufacturing Innovation Hub opened in July 2026 to help SMEs access commercial production facilities and specialist support for scaling. Industry programs and platforms such as the Food and Beverage Accelerator (FaBA) at the University of Queensland, along with government mechanisms including the Industry Growth Program and the National Reconstruction Fund, support advanced manufacturing and ingredient innovation, including precision fermentation and commercialization. Given industry commentary on heavy reliance on imported nutraceutical ingredients (around 90%), converting agricultural by-products into nutraceutical bioactives also presents a practical domestic sourcing opportunity, alongside export-oriented product development.
Recent Industry Developments
- June 2026: Biome Australia signed a binding commercial manufacturing agreement with Specialty Probiotics Australia to transition its Activated Probiotics range to onshore production. The agreement moves a core probiotic portfolio toward domestic supply, supporting tighter quality control and reducing exposure to offshore inventory and lead-time risk.
- December 2025: Wanderlust introduced six plant-based supplements manufactured in Australia, spanning everyday nutrition, herbal support, and condition-specific formulas. The introduction adds to competitive intensity in clean-label and plant-based positioning while reinforcing local manufacturing as a differentiation lever on shelves and online.
- October 2024: FSANZ maintained heightened emphasis on compliant nutrition and health-claim use under the Australia New Zealand Food Standards Code (including Standard 1.2.7), shaping how functional foods and beverages are marketed. This continued scrutiny has prompted brands to invest more in claim substantiation, clearer labeling, and product reformulation where borderline therapeutic implications could trigger regulatory action.
Research Methodology Framework and Report Scope
Market Definition and Coverage
For this study, the Australia nutraceutical market is defined as the value of functional foods, functional beverages, and dietary supplements sold for nutritional support and health benefits through retail and other sales channels within Australia.
Scope exclusions: We exclude prescription medicines and clinical nutrition that is sold mainly as medical treatment (including hospital-only products).
Segmentation Overview
- By Product Type
- Functional Food
- Cereals
- Bakery and Confectionery
- Dairy
- Snacks
- Other Functional Foods
- Functional Beverage
- Energy Drinks
- Sports Drinks
- Fortified Juice
- Dairy and Dairy-Alternative Beverages
- Other Functional Beverages
- Dietary Supplements
- Vitamins and Minerals
- Botanicals
- Enzymes
- Fatty Acids
- Proteins
- Other Dietary Supplements
- Functional Food
- By Distribution Channel
- Supermarkets and Hypermarkets
- Convenience Stores
- Specialty Stores
- Online Retail Stores
- Other Distribution Channels
Data Sources, Market Sizing, and Validation
Desk Research
Desk work starts with building the demand context and the product rulebook, so the later sizing model does not mix nutraceuticals with medicines or general packaged food. We referenced public sources such as the Australian Bureau of Statistics for population and spending indicators, the Department of Health and Aged Care and the Therapeutic Goods Administration for regulatory definitions around listed complementary medicines, and Food Standards Australia New Zealand for fortification and labeling context.
To keep assumptions realistic, we also reviewed trade and customs statistics (for example, series similar to UN Comtrade style classifications) for supplement-related imports, plus association and retailer materials that indicate channel shifts toward pharmacies, grocery, and online. Company annual reports and investor presentations were used to validate category focus and price-positioning logic. A paid subscription for company financials and a separate news and filings database were used selectively to cross-check revenue references, expansions, and material product launches. These are illustrative examples, and we also consulted other public sources to collect, validate, and clarify inputs.
Primary Interviews and Surveys
Primary work was used to test what was not fully visible in public datasets, especially category mix by channel, typical price bands, and how promotions affect realized selling prices. We spoke with a spread of manufacturers, brand owners, importers, distributors, retailers, and packaging or ingredient-linked experts across Australia, then revisited a few contacts when the early range looked inconsistent with the broader evidence.
Distribution of primary research fieldwork respondents
| Company type | Respondent position |
|---|---|
| Top tier: 38% | CXOs: 12% |
| Mid tier: 47% | Functional/Unit leaders: 28% |
| Smaller Players: 15% | Managers: 60% |
Market-Sizing & Forecasting
Sizing was built using a top-down and bottom-up approach, where retail and consumption signals were first translated into an Australia-wide demand pool and then checked against supplier and channel reality. The top-down side uses category-level consumption and retail indicators, followed by allocation into functional foods, functional beverages, and dietary supplements based on the observed mix in Australia.
To keep the model practical, we tracked a few market fingerprints and updated them over the period, including adult and aging-population share, health-and-wellness participation signals, online share progression versus store-based sales, and product price movement by format (powders, capsules, ready-to-drink). We also used category cues such as sports and energy drink cycles, seasonal immune-support peaks, and the shifting role of pharmacies and specialty stores in supplements. Bottom-up checks were done using sampled brand revenue ranges, channel checks on shelf prices and promotion depth, and segment volume proxies when a clean value series was not available. Where a gap existed, assumptions were filled using conservative share ranges, then confirmed in follow-up calls.
For forecasting, we relied mainly on scenario analysis supported by a light multivariate regression view, where growth is explained through a small set of drivers like income trends, demographic mix, and channel shifts, and then adjusted based on expert expectations for category momentum and pricing behavior.
Data Validation & Update Cycle
Before finalizing, outputs are triangulated against independent signals, including import patterns for supplement-linked categories, public company commentary on Australia performance, and retail channel direction. When a segment grows too fast or too slow versus its demand drivers, we recheck for mix errors, double counting across channels, and unrealistic price movement, then adjust and revalidate assumptions.
A second analyst review is completed before sign-off so the logic remains consistent across categories and years. The report is refreshed on an annual cycle, and an interim update is triggered when there is a material regulation change, a major channel shift, or a price shock that meaningfully changes the outlook. Right before delivery, we run a final pass to ensure the latest public indicators are reflected.
Mordor Intelligence's Australia Nutraceutical Market Sizing Compared With Other Published Estimates
Published market values for Australia nutraceuticals can differ more than buyers expect, even when the titles look similar. The spread usually comes from what is counted as nutraceuticals, which sales channels are included, how prices are converted into USD, and whether the latest year is refreshed after major inflation or promotion swings.
The main gap comes from scope overlap, where Mordor Intelligence counts only functional foods, functional beverages, and dietary supplements sold in Australia, and it avoids folding in adjacent health categories that sit closer to OTC medicine or broader packaged food. Differences also show up when one estimate uses an aggressive price escalation path without separating list price from realized price after discounts, or when Australia is bundled with New Zealand and then back-allocated using broad ratios.
Benchmark comparison
| Source | Market Size | Gaps in Research Methodology |
|---|---|---|
| Mordor Intelligence | USD 6.22 B (2025) | |
| Industry Publisher A | USD 7.09 B (2024) | This estimate uses a different base year and can embed a faster near-term price and demand step-up, which lifts the starting value versus a mix-checked 2025 model. |
| Global Consultancy B | USD 11.51 B (2024) | This figure is published for Australia plus New Zealand, and it typically includes a wider product basket, so the combined geography and broader scope inflate the total when compared with Australia-only nutraceutical categories. |
The table shows that year choice, geography coverage, and what gets treated as nutraceuticals are the biggest drivers of variance. By keeping category definitions tight, checking channel mix, and using realistic realized-price assumptions, the final number stays traceable to inputs that can be rechecked and repeated each year.
Key Questions Answered in the Report
How large will Australia nutraceuticals market size be by 2031?
It is forecast to reach USD 8.27 billion by 2031, expanding at a 4.85% CAGR over 2026-2031.
Which product category is growing fastest?
Functional beverages are projected to expand the quickest at a 5.65% CAGR to 2031.
Why is online retail important for Australian nutraceutical brands?
Online retail stores are expected to post a 6.12% CAGR, allowing brands to bypass pharmacy gatekeepers and offer personalized subscriptions.
What drives demand for children’s nutraceuticals?
Post-pandemic immunity concerns and micronutrient gaps are pushing parents toward probiotic and vitamin formulations tailored to pediatric needs.