| Study Period | 2017 - 2030 |
| Base Year For Estimation | 2024 |
| Forecast Data Period | 2025 - 2030 |
| Market Size (2025) | USD 396.4 Million |
| Market Size (2030) | USD 648.5 Million |
| CAGR (2025 - 2030) | 10.34 % |
| Market Concentration | Medium |
Major Players*Disclaimer: Major Players sorted in no particular order |

Australia Non-Dairy Milk Market Analysis
The Australia Non-Dairy Milk Market size is estimated at 396.4 million USD in 2025, and is expected to reach 648.5 million USD by 2030, growing at a CAGR of 10.34% during the forecast period (2025-2030).
The Australian non-dairy milk market is experiencing significant transformation driven by evolving consumer preferences and retail modernization. Supermarkets and hypermarkets dominate the distribution landscape, accounting for 73% of the value share in 2022, with major chains like Woolworths and Coles expanding their footprint through over 3,500 combined stores nationwide. This retail expansion has been accompanied by enhanced product placement strategies, dedicated shelf space for plant-based milk alternatives, and the introduction of private label offerings. The strategic positioning of these products in large-scale retail environments has significantly influenced consumer purchasing decisions, particularly in urban areas where store accessibility is high.
The digitalization of retail channels has emerged as a crucial market development, supported by Australia's robust digital infrastructure with an internet penetration rate of 91% in 2022. Online grocery platforms are revolutionizing the shopping experience through mobile-optimized apps, subscription services, and personalized recommendations. The emergence of specialized plant-based milk delivery platforms such as The FruitBox, MILKRUN, and Milkbasket has created new avenues for market growth. These platforms are implementing innovative features like scheduled deliveries, subscription models, and real-time inventory tracking to enhance customer convenience and retention.
The foodservice sector is witnessing a remarkable shift in consumer preferences, with plant-based beverages capturing approximately half of café drink sales. Major coffee chains are responding by expanding their plant-based beverage menus, introducing innovative pairings such as specialty lattes, and offering multiple dairy alternatives. This trend has prompted foodservice establishments to enhance their barista training programs and invest in equipment specifically designed for dairy-free milk preparation, ensuring optimal texture and taste in coffee-based beverages.
The market is characterized by continuous product innovation and diversification, with manufacturers focusing on clean-label products and enhanced nutritional profiles. Retailers are allocating increased shelf space to accommodate a growing variety of non-dairy milk alternatives, including new flavors and fortified variants. The off-trade channel has emerged as a dominant force, commanding over 85% of the value share in plant-based milk sales in 2022. This channel's success is attributed to strategic product positioning, competitive pricing strategies, and the ability to offer a comprehensive range of options under one roof, catering to increasingly sophisticated consumer preferences.
Australia Non-Dairy Milk Market Trends
Vegan influence drives the plant-based milk consumption in the country
- The consumption of different types of plant milk in Australia has been on the rise for the past few years due to the growing vegan population. There are even vegan music festivals conducted in numerous Australian cities. Australia has the third-highest percentage of vegans per capita globally. As of 2022, there are 2.5 million vegans and vegetarians in the country.
- Several vegan celebrities in Australia, particularly celebrity chefs, have played a significant role in bringing plant-based lifestyles into the mainstream of dining and food culture. This is increasing the inclusion of soy milk, especially in the daily diet, as it replaces conventional milk, is strengthening consumption patterns across the country.
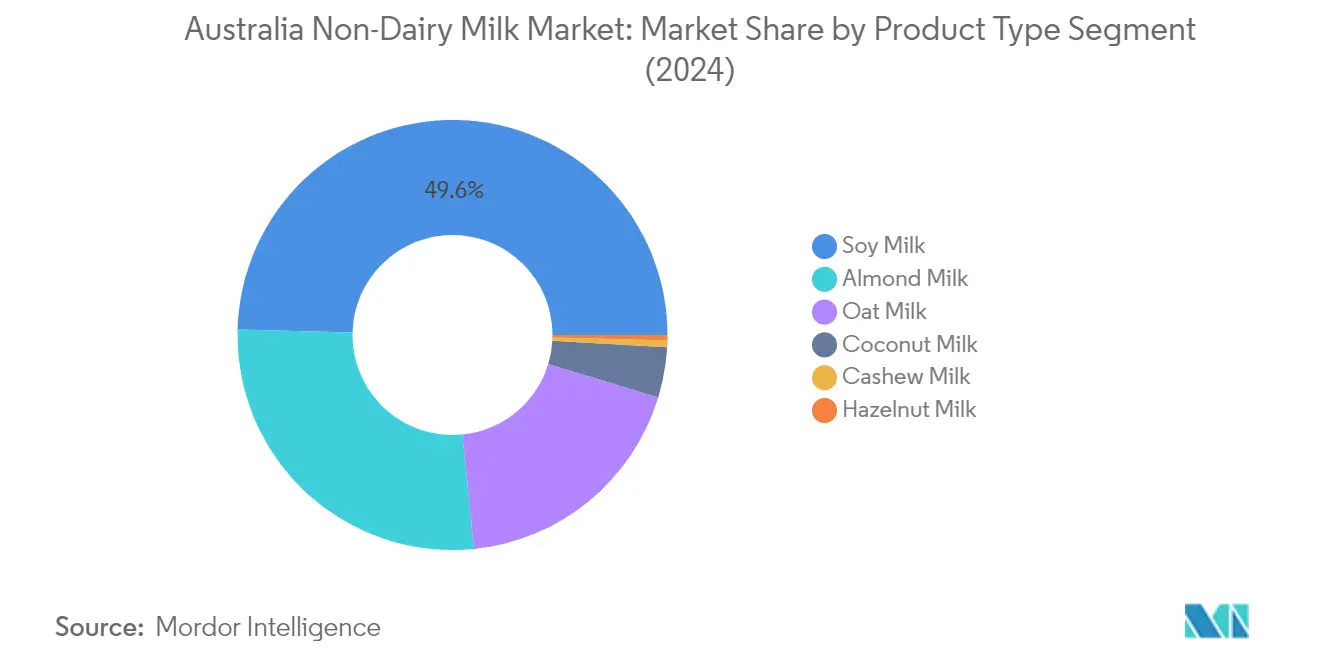
- According to the Australian Bureau of Statistics, consumers drink about half a metric cup of milk alternatives per person every week. The most popular plant-based milk in Australia is currently soy milk (which occupies almost half the market), followed by almond milk, oat milk, and coconut milk.
- Consumers, especially those allergic to milk, are keen to consume plant-based milk products. Cow milk allergy is one of the common food allergies in young children. As of 2022, in Australia, around 1 in 50 babies and young children showed signs of an allergy to cow's milk. Also, 45% of consumers are actively trying to reduce the number of animal products they consume. Thus, the per capita consumption of plant-based milk in Australia is estimated to increase by 4.74% during 2022-2023.
- Australians choose plant-based diets and lifestyles due to various factors ranging from ethical, political, environmental, religious, or economic reasons. Thus, the per capita consumption is expected to grow significantly during the forecast period.

Understand The Key Trends Shaping This Market
Download PDF
OTHER KEY INDUSTRY TRENDS COVERED IN THE REPORT
- Production of raw materials in the plant-based milk market captivated by the production of oat and almond
Segment Analysis: Product Type
Soy Milk Segment in Australia Non-Dairy Milk Market
Soy milk continues to dominate the Australian non-dairy milk market, commanding approximately 50% of the total market share in 2024. The segment's strong position is primarily driven by its high protein content, nutritional benefits, and widespread acceptance among health-conscious consumers. The growing lactose-intolerant population and increasing awareness of soy milk's health benefits, including its omega-3 fatty acids content and potential to reduce the risk of various diseases, have contributed to its market leadership. Supermarkets and hypermarkets remain the primary distribution channels for soy milk, with major retailers offering various flavors, including vanilla, chocolate, and unsweetened varieties, to cater to diverse consumer preferences.
Coconut Milk Segment in Australia Non-Dairy Milk Market
The coconut milk segment is experiencing remarkable growth in the Australian market, projected to expand at the highest rate among all plant-based milk alternatives during 2024-2029. This growth is primarily attributed to coconut milk's extended shelf life, excellent nutritional profile, and versatile applications in both beverages and food preparation. The segment's popularity is further enhanced by its natural electrolyte content and healthy fat composition, making it an attractive option for health-conscious consumers. The increasing adoption of coconut milk in cafes and restaurants, particularly in specialty coffee preparations, is also driving its market expansion. Additionally, manufacturers are introducing innovative variants and packaging formats to meet evolving consumer preferences and lifestyle needs.
Remaining Segments in Australia Non-Dairy Milk Market
The Australian non-dairy milk market features several other significant segments, including almond milk, oat milk, cashew milk, and hazelnut milk, each catering to specific consumer preferences and dietary requirements. Almond milk maintains its position as the second-largest segment, particularly popular among consumers seeking low-calorie dairy alternatives. Oat milk has gained significant traction in the coffee industry due to its creamy texture and barista-friendly properties. Cashew milk and hazelnut milk, while smaller in market share, are carving out their niches by appealing to consumers looking for unique flavors and nutritional profiles. These segments collectively contribute to the market's diversity and cater to various consumer preferences, dietary restrictions, and usage occasions.
Segment Analysis: Distribution Channel
Off-trade Segment in Australia Non-Dairy Milk Market
The off-trade distribution channel dominates the Australian non-dairy milk market, accounting for approximately 86% of the total market value in 2024. This significant market share is primarily driven by supermarkets and hypermarkets, which serve as the primary retail outlets for plant-based milk products. The channel's dominance is supported by the extensive network of major retail chains like Woolworths Group, Coles, Aldi, and Independent Grocers of Australia, which collectively constitute over 80% of the Australian grocery market. These retailers provide consumers with a wide selection of milk alternative varieties and flavors, while also offering convenient mobile-optimized shopping apps that enhance the purchasing experience. The growth of this segment is further bolstered by the rising adoption of online grocery shopping platforms and the expansion of specialty stores that cater to health-conscious consumers seeking premium plant-based milk alternatives.
On-trade Segment in Australia Non-Dairy Milk Market
The on-trade channel represents a vital segment of the Australian non-dairy milk market, primarily driven by the increasing adoption of plant-based milk alternatives in cafes, restaurants, and other foodservice establishments. Major coffee chains like Starbucks, Blue Tokai Coffee, Costa Coffee, and Third Wave Coffee Roaster are actively expanding their plant-based milk menu options, particularly in beverages such as lattes, espresso-based drinks, smoothies, and cocktails. The segment's growth is supported by the rising consumer preference for plant-based milk alternatives in coffee shops, with approximately 25% of Australian cafe customers opting for plant-based milk options. The channel's development is further enhanced by the extensive network of coffee shops across the country, with major chains like Costa Coffee operating over 450 outlets and Starbucks maintaining more than 61 locations in Australia.
Australia Non-Dairy Milk Industry Overview
Top Companies in Australia Non-Dairy Milk Market
Leading companies in the Australian non-dairy milk industry are focusing heavily on product innovation and strategic expansion to maintain their competitive positions. Companies are consistently launching new plant-based milk variants, particularly in premium and specialized segments like barista editions and organic options. Operational agility is demonstrated through the development of robust supply chain networks and partnerships with local farmers for ingredient sourcing. Strategic moves include significant investments in research and development to create innovative formulations and enhance product attributes. Market expansion strategies involve strengthening distribution networks across both modern and traditional retail channels, with particular emphasis on supermarket chains and specialty stores. Companies are also investing in marketing campaigns to educate consumers about the benefits of dairy-free alternatives and sustainability initiatives.
Market Led by Established Global Players
The Australian non-dairy milk market exhibits a balanced mix of global conglomerates and local specialists, with international players holding significant market share through established brands and distribution networks. Global companies leverage their extensive research capabilities and international market experience to introduce innovative products, while local players capitalize on their understanding of regional preferences and established relationships with domestic retailers. The market shows moderate consolidation with a few key players dominating the landscape, particularly in the soy and almond milk segments.
The competitive environment is characterized by strategic partnerships and collaborations rather than aggressive merger and acquisition activities. Companies are focusing on vertical integration strategies, particularly in securing raw material supplies and strengthening distribution networks. Local manufacturers are increasingly partnering with international players to expand their product portfolios and market reach, while global companies are investing in local production facilities to better serve the Australian market and reduce operational costs.
Innovation and Distribution Drive Market Success
For incumbent companies to maintain and increase their market share, focus needs to be placed on continuous product innovation, particularly in developing new flavors and functional benefits. Investment in sustainable packaging solutions and organic ingredients will become increasingly important as consumer awareness grows. Companies must also strengthen their presence across various distribution channels, particularly in the growing online retail segment, while maintaining strong relationships with traditional retail partners. Building strong brand equity through targeted marketing campaigns and consumer education initiatives will be crucial for long-term success.
New entrants and smaller players can gain ground by focusing on niche segments and specialized product offerings that address specific consumer needs or dietary requirements. Developing strong relationships with specialty retailers and health food stores can provide an alternative route to market. Companies must also consider potential regulatory changes regarding labeling requirements and health claims, while maintaining flexibility in their operations to adapt to changing market conditions. Success will depend on the ability to differentiate products through unique value propositions while maintaining competitive pricing strategies and efficient production processes. The plant-based milk market continues to evolve, offering opportunities for innovation and growth.
Australia Non-Dairy Milk Market Leaders
-
Blue Diamond Growers
-
Oatly Group AB
-
PureHarvest
-
Sanitarium Health and Wellbeing Company
-
Vitasoy International Holdings Ltd
- *Disclaimer: Major Players sorted in no particular order

Need More Details on Market Players and Competitors?
Download PDF
Australia Non-Dairy Milk Market News
- September 2022: Vitasoy launched a plant-based milk range Plant+, which includes oat and almond milk varieties with zero cholesterol, low sugar, and high calcium.
- September 2022: Vitasoy launched the Vitasoy Plant+ range of plant milk in the Singaporean market. These plant-based milk products are available in almond, oat, and soy varieties and are high in calcium and low in sugar with zero cholesterol.
- August 2022: Sanitarium launched a new master brand campaign for its plant-based milk brand, So Good.
Free With This Report
We provide a comprehensive and exhaustive set of data pointers for global, regional, and country-level metrics that illustrate the fundamentals of the dairy alternatives industry. With the help of 45+ free charts, clients can access in-depth market analysis based on per capita consumption numbers and production data of raw materials for dairy alternatives, through granular level segmental information supported by a repository of market data, trends, and expert analysis. Data and analysis on dairy alternative products, categories of dairy alternative products, product types, etc., are available in the form of comprehensive reports as well as excel based data worksheets.


Australia Non-Dairy Milk Market Report - Table of Contents
1. EXECUTIVE SUMMARY & KEY FINDINGS
2. REPORT OFFERS
3. INTRODUCTION
- 3.1 Study Assumptions & Market Definition
- 3.2 Scope of the Study
- 3.3 Research Methodology
4. KEY INDUSTRY TRENDS
- 4.1 Per Capita Consumption
-
4.2 Raw Material/commodity Production
- 4.2.1 Dairy Alternative - Raw Material Production
-
4.3 Regulatory Framework
- 4.3.1 Australia
- 4.4 Value Chain & Distribution Channel Analysis
5. MARKET SEGMENTATION (includes market size in Value in USD and Volume, Forecasts up to 2030 and analysis of growth prospects)
-
5.1 Product Type
- 5.1.1 Almond Milk
- 5.1.2 Cashew Milk
- 5.1.3 Coconut Milk
- 5.1.4 Hazelnut Milk
- 5.1.5 Oat Milk
- 5.1.6 Soy Milk
-
5.2 Distribution Channel
- 5.2.1 Off-Trade
- 5.2.1.1 Convenience Stores
- 5.2.1.2 Online Retail
- 5.2.1.3 Specialist Retailers
- 5.2.1.4 Supermarkets and Hypermarkets
- 5.2.1.5 Others (Warehouse clubs, gas stations, etc.)
- 5.2.2 On-Trade
6. COMPETITIVE LANDSCAPE
- 6.1 Key Strategic Moves
- 6.2 Market Share Analysis
- 6.3 Company Landscape
-
6.4 Company Profiles (includes Global Level Overview, Market Level Overview, Core Business Segments, Financials, Headcount, Key Information, Market Rank, Market Share, Products and Services, and Analysis of Recent Developments).
- 6.4.1 Blue Diamond Growers
- 6.4.2 Califia Farms LLC
- 6.4.3 Minor Figures Limited
- 6.4.4 Noumi Ltd
- 6.4.5 Oatly Group AB
- 6.4.6 PureHarvest
- 6.4.7 Sanitarium Health and Wellbeing Company
- 6.4.8 Vitasoy International Holdings Ltd
7. KEY STRATEGIC QUESTIONS FOR DAIRY AND DAIRY ALTERNATIVE CEOS
8. APPENDIX
-
8.1 Global Overview
- 8.1.1 Overview
- 8.1.2 Porter’s Five Forces Framework
- 8.1.3 Global Value Chain Analysis
- 8.1.4 Market Dynamics (DROs)
- 8.2 Sources & References
- 8.3 List of Tables & Figures
- 8.4 Primary Insights
- 8.5 Data Pack
- 8.6 Glossary of Terms
You Can Purchase Parts Of This Report. Check Out Prices For Specific Sections
Get Price Break-up Now
List of Tables & Figures
- Figure 1:
- PER CAPITA CONSUMPTION OF NON-DAIRY MILK, KG, AUSTRALIA, 2017 - 2029
- Figure 2:
- PRODUCTION VOLUME OF AUSTRALIA NON-DAIRY MILK MARKET - RAW MATERIAL, METRIC TONNES, AUSTRALIA, 2017 - 2021
- Figure 3:
- VOLUME OF NON-DAIRY MILK, METRIC TONNES, BY AUSTRALIA, 2017 - 2029
- Figure 4:
- VALUE OF NON-DAIRY MILK, USD MN, BY AUSTRALIA, 2017 - 2029
- Figure 5:
- VOLUME OF NON-DAIRY MILK MARKET BY PRODUCT TYPE, METRIC TONNES, AUSTRALIA, 2017 - 2029
- Figure 6:
- VALUE OF NON-DAIRY MILK MARKET BY PRODUCT TYPE, USD MN, AUSTRALIA, 2017 - 2029
- Figure 7:
- VOLUME SHARE OF NON-DAIRY MILK MARKET BY PRODUCT TYPE, %, AUSTRALIA, 2017 VS 2023 VS 2029
- Figure 8:
- VALUE SHARE OF NON-DAIRY MILK MARKET BY PRODUCT TYPE, %, AUSTRALIA, 2017 VS 2023 VS 2029
- Figure 9:
- VOLUME OF ALMOND MILK MARKET, METRIC TONNES, AUSTRALIA, 2017 - 2029
- Figure 10:
- VALUE OF ALMOND MILK MARKET, USD MN, AUSTRALIA, 2017 - 2029
- Figure 11:
- VALUE SHARE OF ALMOND MILK MARKET, BY DISTRIBUTION CHANNEL, %, AUSTRALIA, 2022 VS 2029
- Figure 12:
- VOLUME OF CASHEW MILK MARKET, METRIC TONNES, AUSTRALIA, 2017 - 2029
- Figure 13:
- VALUE OF CASHEW MILK MARKET, USD MN, AUSTRALIA, 2017 - 2029
- Figure 14:
- VALUE SHARE OF CASHEW MILK MARKET, BY DISTRIBUTION CHANNEL, %, AUSTRALIA, 2022 VS 2029
- Figure 15:
- VOLUME OF COCONUT MILK MARKET, METRIC TONNES, AUSTRALIA, 2017 - 2029
- Figure 16:
- VALUE OF COCONUT MILK MARKET, USD MN, AUSTRALIA, 2017 - 2029
- Figure 17:
- VALUE SHARE OF COCONUT MILK MARKET, BY DISTRIBUTION CHANNEL, %, AUSTRALIA, 2022 VS 2029
- Figure 18:
- VOLUME OF HAZELNUT MILK MARKET, METRIC TONNES, AUSTRALIA, 2017 - 2029
- Figure 19:
- VALUE OF HAZELNUT MILK MARKET, USD MN, AUSTRALIA, 2017 - 2029
- Figure 20:
- VALUE SHARE OF HAZELNUT MILK MARKET, BY DISTRIBUTION CHANNEL, %, AUSTRALIA, 2022 VS 2029
- Figure 21:
- VOLUME OF OAT MILK MARKET, METRIC TONNES, AUSTRALIA, 2017 - 2029
- Figure 22:
- VALUE OF OAT MILK MARKET, USD MN, AUSTRALIA, 2017 - 2029
- Figure 23:
- VALUE SHARE OF OAT MILK MARKET, BY DISTRIBUTION CHANNEL, %, AUSTRALIA, 2022 VS 2029
- Figure 24:
- VOLUME OF SOY MILK MARKET, METRIC TONNES, AUSTRALIA, 2017 - 2029
- Figure 25:
- VALUE OF SOY MILK MARKET, USD MN, AUSTRALIA, 2017 - 2029
- Figure 26:
- VALUE SHARE OF SOY MILK MARKET, BY DISTRIBUTION CHANNEL, %, AUSTRALIA, 2022 VS 2029
- Figure 27:
- VOLUME OF NON-DAIRY MILK MARKET BY DISTRIBUTION CHANNEL, METRIC TONNES, AUSTRALIA, 2017 - 2029
- Figure 28:
- VALUE OF NON-DAIRY MILK MARKET BY DISTRIBUTION CHANNEL, USD MN, AUSTRALIA, 2017 - 2029
- Figure 29:
- VOLUME SHARE OF NON-DAIRY MILK MARKET, BY DISTRIBUTION CHANNEL , %, AUSTRALIA, 2017 VS 2023 VS 2029
- Figure 30:
- VALUE SHARE OF NON-DAIRY MILK MARKET, BY DISTRIBUTION CHANNEL , %, AUSTRALIA, 2017 VS 2023 VS 2029
- Figure 31:
- VOLUME OF NON-DAIRY MILK MARKET BY SUB DISTRIBUTION CHANNELS, METRIC TONNES, AUSTRALIA, 2017 - 2029
- Figure 32:
- VALUE OF NON-DAIRY MILK MARKET BY SUB DISTRIBUTION CHANNELS, USD MN, AUSTRALIA, 2017 - 2029
- Figure 33:
- VOLUME SHARE OF NON-DAIRY MILK MARKET, BY SUB DISTRIBUTION CHANNELS , %, AUSTRALIA, 2017 VS 2023 VS 2029
- Figure 34:
- VALUE SHARE OF NON-DAIRY MILK MARKET, BY SUB DISTRIBUTION CHANNELS , %, AUSTRALIA, 2017 VS 2023 VS 2029
- Figure 35:
- VOLUME OF NON-DAIRY MILK MARKET SOLD VIA CONVENIENCE STORES, METRIC TONNES, AUSTRALIA, 2017 - 2029
- Figure 36:
- VALUE OF NON-DAIRY MILK MARKET SOLD VIA CONVENIENCE STORES, USD MN, AUSTRALIA, 2017 - 2029
- Figure 37:
- VALUE SHARE OF NON-DAIRY MILK MARKET, SOLD VIA CONVENIENCE STORES, BY CATEGORY , %, AUSTRALIA, 2022 VS 2029
- Figure 38:
- VOLUME OF NON-DAIRY MILK MARKET SOLD VIA ONLINE RETAIL, METRIC TONNES, AUSTRALIA, 2017 - 2029
- Figure 39:
- VALUE OF NON-DAIRY MILK MARKET SOLD VIA ONLINE RETAIL, USD MN, AUSTRALIA, 2017 - 2029
- Figure 40:
- VALUE SHARE OF NON-DAIRY MILK MARKET, SOLD VIA ONLINE RETAIL, BY CATEGORY , %, AUSTRALIA, 2022 VS 2029
- Figure 41:
- VOLUME OF NON-DAIRY MILK MARKET SOLD VIA SPECIALIST RETAILERS, METRIC TONNES, AUSTRALIA, 2017 - 2029
- Figure 42:
- VALUE OF NON-DAIRY MILK MARKET SOLD VIA SPECIALIST RETAILERS, USD MN, AUSTRALIA, 2017 - 2029
- Figure 43:
- VALUE SHARE OF NON-DAIRY MILK MARKET, SOLD VIA SPECIALIST RETAILERS, BY CATEGORY , %, AUSTRALIA, 2022 VS 2029
- Figure 44:
- VOLUME OF NON-DAIRY MILK MARKET SOLD VIA SUPERMARKETS AND HYPERMARKETS, METRIC TONNES, AUSTRALIA, 2017 - 2029
- Figure 45:
- VALUE OF NON-DAIRY MILK MARKET SOLD VIA SUPERMARKETS AND HYPERMARKETS, USD MN, AUSTRALIA, 2017 - 2029
- Figure 46:
- VALUE SHARE OF NON-DAIRY MILK MARKET, SOLD VIA SUPERMARKETS AND HYPERMARKETS, BY CATEGORY , %, AUSTRALIA, 2022 VS 2029
- Figure 47:
- VOLUME OF NON-DAIRY MILK MARKET SOLD VIA OTHERS (WAREHOUSE CLUBS, GAS STATIONS, ETC.), METRIC TONNES, AUSTRALIA, 2017 - 2029
- Figure 48:
- VALUE OF NON-DAIRY MILK MARKET SOLD VIA OTHERS (WAREHOUSE CLUBS, GAS STATIONS, ETC.), USD MN, AUSTRALIA, 2017 - 2029
- Figure 49:
- VALUE SHARE OF NON-DAIRY MILK MARKET, SOLD VIA OTHERS (WAREHOUSE CLUBS, GAS STATIONS, ETC.), BY CATEGORY , %, AUSTRALIA, 2022 VS 2029
- Figure 50:
- VOLUME OF NON-DAIRY MILK MARKET SOLD VIA ON-TRADE, METRIC TONNES, AUSTRALIA, 2017 - 2029
- Figure 51:
- VALUE OF NON-DAIRY MILK MARKET SOLD VIA ON-TRADE, USD MN, AUSTRALIA, 2017 - 2029
- Figure 52:
- VALUE SHARE OF NON-DAIRY MILK MARKET, SOLD VIA ON-TRADE, BY CATEGORY , %, AUSTRALIA, 2022 VS 2029
- Figure 53:
- MOST ACTIVE COMPANIES BY NUMBER OF STRATEGIC MOVES, COUNT, AUSTRALIA, 2017 - 2029
- Figure 54:
- MOST ADOPTED STRATEGIES, COUNT, AUSTRALIA, 2017 - 2029
- Figure 55:
- VALUE SHARE OF MAJOR PLAYERS, %, AUSTRALIA
Australia Non-Dairy Milk Industry Segmentation
Almond Milk, Cashew Milk, Coconut Milk, Hazelnut Milk, Oat Milk, Soy Milk are covered as segments by Product Type. Off-Trade, On-Trade are covered as segments by Distribution Channel.| Product Type | Almond Milk | ||
| Cashew Milk | |||
| Coconut Milk | |||
| Hazelnut Milk | |||
| Oat Milk | |||
| Soy Milk | |||
| Distribution Channel | Off-Trade | Convenience Stores | |
| Online Retail | |||
| Specialist Retailers | |||
| Supermarkets and Hypermarkets | |||
| Others (Warehouse clubs, gas stations, etc.) | |||
| On-Trade | |||
Need A Different Region or Segment?
Customize Now
Market Definition
- Dairy Alternatives - Dairy alternatives are foods that are made from plant-based milk/oils instead of their usual animal products, such as cheese, butter, milk, ice cream, yogurt, etc. Plant-based or non-dairy milk alternative is the fast-growing segment in the newer food product development category of functional and specialty beverage across the globe.
- Non-Dairy Butter - Non dairy butter is a vegan butter alternative that is made from a mixture of plant oils. With an increase in alternative diets like vegetarianism, veganism, and gluten intolerance, plant butter is a healthy non-dairy substitute for normal butter.
- Non-Dairy Ice Cream - Plant based ice cream is a growing category. Non-dairy ice cream is a type of dessert made without any animal ingredients. This is typically considered a substitute for regular ice cream for those who cannot or do not eat animal or animal-derived products, including eggs, milk, cream, or honey.
- Plant-Based Milk - Plant based milks are milk substitutes that are made from nuts (e.g., hazelnuts, hemp seeds), seeds (e.g., sesame, walnuts, coconuts, cashews, almonds, rice, oats, etc.) or legumes (e.g., soy). Plant-based milk such as soy milk and almond milk have been popular in East Asia and the Middle East for centuries.
| Keyword | Definition |
|---|---|
| Cultured Butter | Cultured butter is prepared by having the raw butter go through chemical processing and has been added with certain emulsifiers and foreign ingredients. |
| Uncultured Butter | This type of butter is one which has not been processed in any way |
| Natural Cheese | The type of cheese in its most natural form. It is made from natural and simple products and ingredients, including fresh and natural salts, natural colors, enzymes, and high-quality milk. |
| Processed Cheese | Processed cheese undergoes the same processes as natural cheese; however, it requires more steps and many different forms of ingredients. Making processed cheese involves melting natural cheese, emulsifying it, and adding preservatives and other artificial ingredients or colorings. |
| Single Cream | Single cream contains around 18% fat. It’s a single layer of cream that appears over boiled milk. |
| Double Cream | Double cream contains 48% fat, more than double the amount of fat of single cream. It’s heavier and thicker than single cream |
| Whipping Cream | This has a much higher fat percentage than single cream (36%). Used to top cakes, pies, and puddings and as a thickener for sauces, soups, and fillings. |
| Frozen Desserts | Desserts that are meant to be eaten in frozen condition. E.g., sherbets, sorbets, frozen yogurts |
| UHT Milk (Ultra-high temperature milk) | Milk heated at a very high temperature. Ultra-high-temperature processing (UHT) of milk involves heating for 1–8 sec at 135–154°C. which kills the spore-forming pathogenic microorganism, resulting in a product with a shelf-life of several months. |
| Non-dairy butter/Plant-based butter | Butter made from plant-derived oil such as coconut, palm, etc. |
| Non-dairy Yogurt | Yogurt made from typically made from nuts, like almonds, cashews, coconuts, and even other foods like soybeans, plantains, oats, and peas |
| On-trade | It refers to restaurants, QSRs, and bars. |
| Off-trade | It refers to supermarkets, hypermarkets, on-line channels, etc. |
| Neufchatel cheese | One of the oldest kinds of cheese in France. It is a soft, slightly crumbly, mold-ripened, bloomy-rind cheese made in the Neufchâtel-en-Bray region of Normandy. |
| Flexitarian | It refers to a consumer preferring a semi-vegetarian diet, that is centered on plant foods with limited or occasional inclusion of meat. |
| Lactose Intolerance | Lactose intolerance is a reaction in digestive system to lactose, the sugar in milk. It causes uncomfortable symptoms in response to the consumption of dairy products. |
| Cream Cheese | Cream cheese is a soft and creamy fresh cheese with a tangy taste made from milk and cream. |
| Sorbets | Sorbet is a frozen dessert made using ice combined with fruit juice, fruit purée, or other ingredients, such as wine, liqueur, or honey. |
| Sherbet | Sherbet is a sweetened frozen dessert made with fruit and some sort of dairy product such as milk or cream. |
| Shelf stable | Foods that can be safely stored at room temperature, or "on the shelf," for at least one year and do not have to be cooked or refrigerated to eat safely. |
| DSD | Direct Store Delivery is the process in supply chain management wherein the product is delivered from manufacturing plant directly to the retailer. |
| OU Kosher | Orthodox Union Kosher is a kosher certification agency based in New York City. |
| Gelato | Gelato is a frozen creamy dessert made with milk, heavy cream and sugar. |
| Grass-fed Cows | Grass-fed cows are allowed to graze in pastures, where they eat a variety of grasses and clover. |
Need More Details on Market Definition?
Ask a Question
Research Methodology
Mordor Intelligence follows a four-step methodology in all our reports.
- Step-1: Identify Key Variables: In order to build a robust forecasting methodology, the variables and factors identified in Step 1 are tested against available historical market numbers. Through an iterative process, the variables required for market forecast are set, and the model is built on the basis of these variables.
- Step-2: Build a Market Model: Market-size estimations for the forecast years are in nominal terms. Inflation is not a part of the pricing, and the average selling price (ASP) is kept constant throughout the forecast period for each country.
- Step-3: Validate and Finalize: In this important step, all market numbers, variables, and analyst calls are validated through an extensive network of primary research experts from the market studied. The respondents are selected across levels and functions to generate a holistic picture of the market studied.
- Step-4: Research Outputs: Syndicated Reports, Custom Consulting Assignments, Databases & Subscription Platforms

Get More Details On Research Methodology
Download PDF


