
Australia Mining Logistics Market Size and Share
Market Overview
| Study Period | 2020 - 2031 |
|---|---|
| Forecast Data Period | 2026 - 2031 |
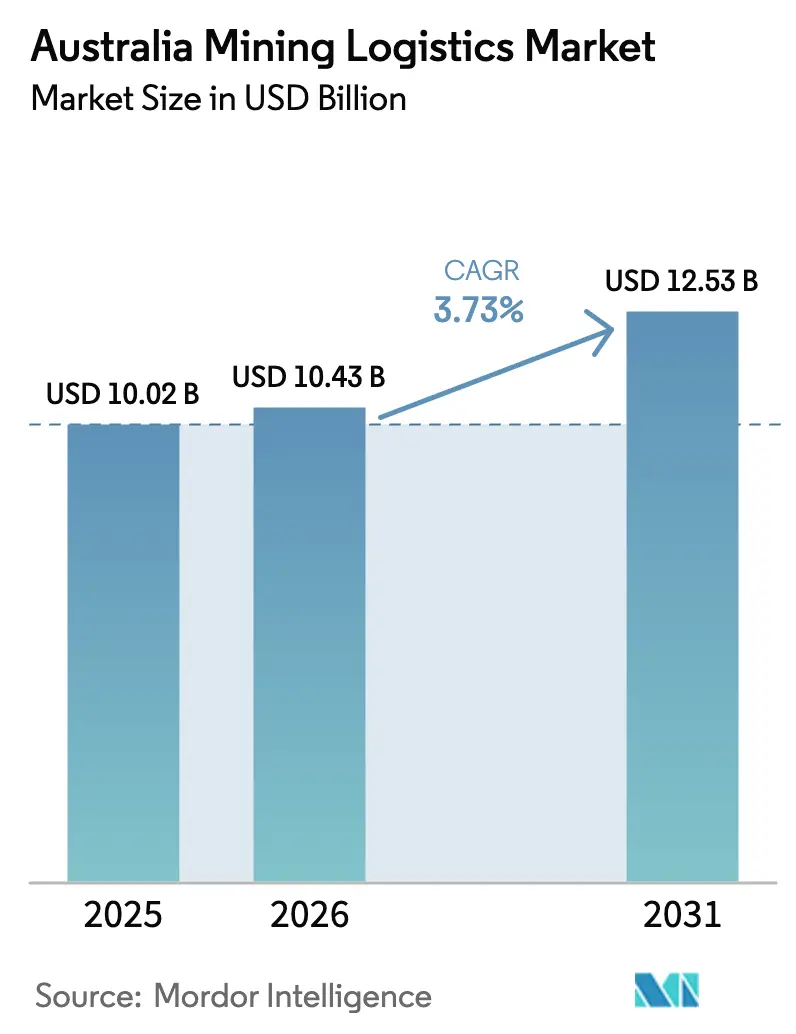
| Base Year Market Size (2025) | USD 10.02 Billion |
| Market Size (2026) | USD 10.43 Billion |
| Market Size (2031) | USD 12.53 Billion |
| Growth Rate (2026 - 2031) | 3.73 % |
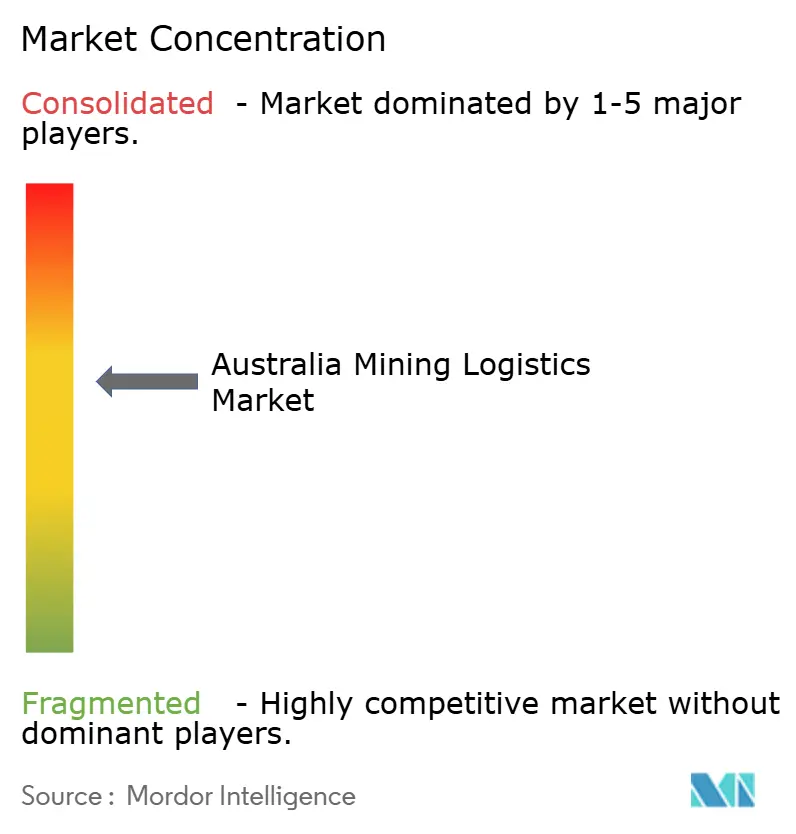
| Market Concentration | Medium |
Major Players *Disclaimer: Major Players sorted in no particular order Image © Mordor Intelligence. Reuse requires attribution under CC BY 4.0. | |
Australia Mining Logistics Market Analysis by Mordor Intelligence
The Australia Mining Logistics Market size was valued at USD 10.02 billion in 2025 and is estimated to grow from USD 10.43 billion in 2026 to reach USD 12.53 billion by 2031, at a CAGR of 3.73% during the forecast period (2026-2031).
Rising bulk-haul volumes for iron ore, sustained federal and state capital spending on heavy-haul corridors, and rapid uptake of autonomous rail operations keep the Australia mining logistics market on a steady, efficiency-led growth path. Digital technologies, including AutoHaul locomotives and network-wide digital twins, are reducing fuel burn, minimizing unplanned downtime, and enhancing stockpile rotation, which helps stabilize per-ton costs even when diesel prices and labor scarcity exert upward pressure. Simultaneously, the emergence of lithium, rare earths, and copper exports is forcing operators to redesign networks around flexible, multi-commodity flows rather than single-product pipelines. Public commitments worth AUD 14 billion (USD 8.71 billion) to rail and port upgrades from 2024 to 2026 create capacity headroom that cushions against weather-related outages and commodity price swings.
Key Report Takeaways
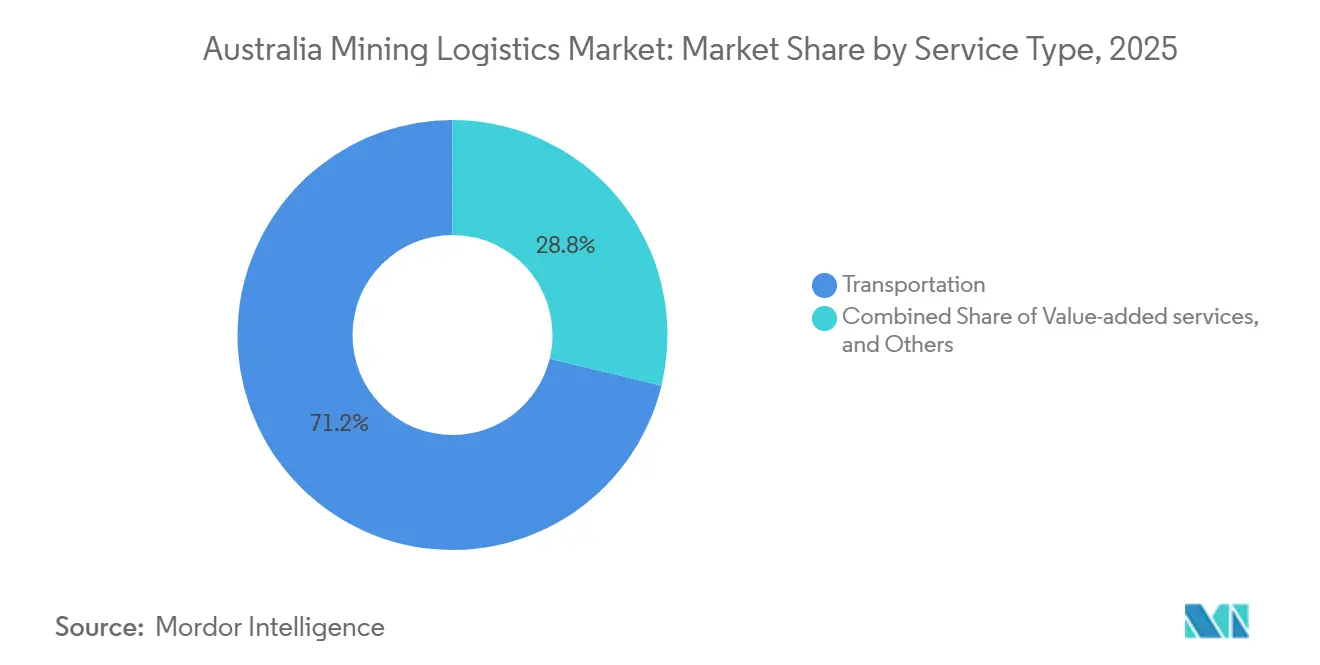
- By service type, transportation services led with 71.20% of the Australia mining logistics market share in 2025, while value-added services are projected to expand at a 4.65% CAGR between 2026-2031, the fastest rate among service categories.
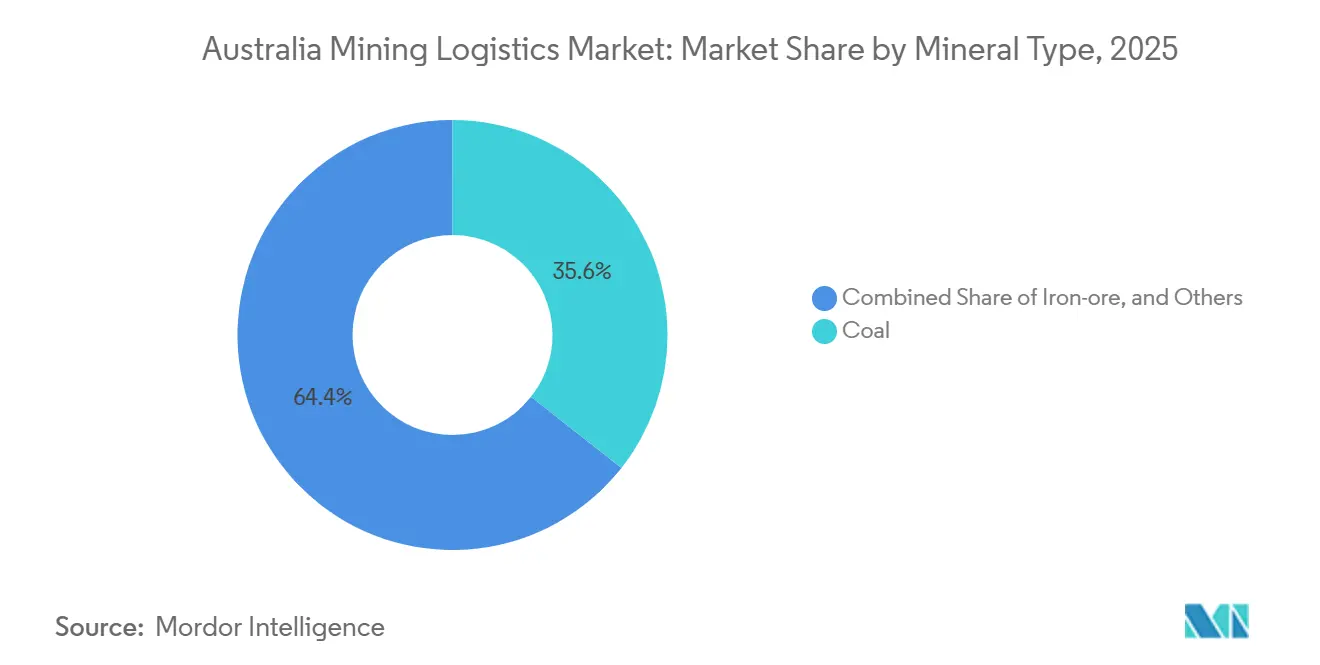
- By mineral type, coal captured 35.61% of the Australia mining logistics market size in 2025, the highest share among mineral segments. Gold logistics are advancing at a 5.13% CAGR between 2026-2031, the quickest pace among minerals.
- By geography, Western Australia held a 63.70% revenue share in 2025, the largest regional position. Queensland is set to post the strongest regional expansion, growing at a 4.50% CAGR between 2026-2031.
Note: Market size and forecast figures in this report are generated using Mordor Intelligence’s proprietary estimation framework, updated with the latest available data and insights as of January 2026.
Australia Mining Logistics Market Trends and Insights
Drivers Impact Analysis*
| Driver | (~) % Impact on CAGR Forecast | Geographic Relevance | Impact Timeline |
|---|---|---|---|
| Surging iron-ore export volumes sustain bulk-haul demand | +0.9% | Western Australia, with spillover to Northern Territory | Medium term (2-4 years) |
| Federal/state capex splurge on heavy-haul rail and port upgrades | +0.7% | National, with concentration in WA Pilbara and QLD coal corridors | Long term (≥ 4 years) |
| Rapid digitalisation (AutoHaul, telematics, digital twins) raises efficiency | +0.6% | Western Australia and Queensland core mining regions | Short term (≤ 2 years) |
| Global hunger for critical minerals (lithium, rare earths) diversifies flows | +0.5% | Western Australia lithium belt, Northern Territory rare earths | Medium term (2-4 years) |
| Green-iron pilot projects create new domestic pit-to-plant corridors | +0.3% | Western Australia Port Hedland and Pilbara region | Long term (≥ 4 years) |
| Early hydrogen-truck corridors cut fuel cost and open inland routes | +0.2% | South Australia, with early trials in copper belt to Port Adelaide | Medium term (2-4 years) |
| Source: Mordor Intelligence | |||


Surging Iron-Ore Export Volumes Sustain Bulk-Haul Demand
Australia shipped 912 million tons of iron ore in 2025, 3.2% above 2024, and contracted volumes point to 945 million tons by 2027. The uplift concentrates on established Pilbara rail networks where Rio Tinto and BHP already operate more than 1,800 kilometers of heavy-haul track. Because mine life extensions rather than new pits generate the tonnage, incremental volumes flow over proven assets, preserving operator pricing power. Iron ore stays above 50% of total freight, anchoring the Australia mining logistics market even as critical minerals scale. The medium-term driver adds 0.9 percentage points to forecast CAGR by locking in long-term supply contracts that run to 2028[1]“Inland Rail Project,” Infrastructure Australia, infrastructureaustralia.gov.au.
Federal and State Capex on Heavy-Haul Rail and Ports
Canberra earmarked AUD 9.3 billion (USD 5.79 billion) for Inland Rail during 2024-2026, cutting Melbourne-to-Brisbane transit by 18 hours and per-ton-kilometer cost by 12% upon 2027 completion. Western Australia has allocated AUD 2.8 billion (USD 1.74 billion) for Pilbara port sidings, increasing Port Hedland's capacity from 570 million to 620 million tons by 2027. Queensland invested AUD 1.9 billion (USD 1.18 billion) to duplicate key coal lines, enabling 25 million extra tons when the works finish in late 2026. These assets lock in lower structural logistics costs for decades, giving Australian exports an edge over Brazilian and African rivals[2]“Global Hydrogen Review 2024,” International Energy Agency, iea.org.
Rapid Digitalisation Cuts Operating Cost
Fortescue’s AutoHaul fleet expanded to 54 autonomous locomotives and moved 1.2 billion tons in 2025 with zero crew incidents, trimming locomotive fuel use by 7%. Rio Tinto’s digital twin reduced unplanned maintenance by 18% soon after the 2024 rollout. BHP telematics lowered road-train fuel by 6% in 2024. Rapid payback places digital tools at the core of immediate gain, adding 0.6 percentage points to the Australia mining logistics market CAGR.
Global Hunger for Critical Minerals Diversifies Flows
Lithium output hit 86,000 tons LCE in 2025, up 22%, while rare-earth oxides reached 23,000 tons. Concentrates move in container loads that need contamination control, unlike bulk iron ore. Third-party logistics providers are installing inert-gas handling and blending sheds that carry 20%-plus margin premiums. Volumes will escalate through 2029, driving a 0.5 percentage-point bump to sector CAGR.
Restraints Impact Analysis*
| Restraint | (~) % Impact on CAGR Forecast | Geographic Relevance | Impact Timeline |
|---|---|---|---|
| Commodity-price volatility dampens 3PL contract visibility | -0.4% | National, with acute impact on coal and base-metals logistics | Short term (≤ 2 years) |
| Extreme cyclonic and flood events disrupt Pilbara / QLD supply chains | -0.3% | Western Australia Pilbara and Queensland coastal regions | Short term (≤ 2 years) |
| Escalating diesel-emission caps raise cost of road trains | -0.2% | National, with concentration in NSW and Queensland coal corridors | Medium term (2-4 years) |
| Acute remote-area driver and maintainer shortages strain capacity | -0.3% | Western Australia, Northern Territory, and Queensland remote mining regions | Medium term (2-4 years) |
| Source: Mordor Intelligence | |||
Commodity-Price Volatility Shortens Contract Visibility
Iron ore prices yo-yoed between USD 95 and USD 135 per ton in 2025, while met-coal swung within a USD 100 band. Miners trimmed multi-year haulage deals and shifted toward spot slots, eroding revenue certainty for third-party carriers. Lower visibility lifts financing cost for specialized wagons and automated load-out, shaving 0.4 percentage points off forecast CAGR[3]“Mining Our Resources,” Queensland Department of Resources, resources.qld.gov.au.
Extreme Cyclonic and Flood Events Disrupt Supply Chains
Cyclone Ellie shut Pilbara rail for 12 days in February 2025, idling 4.5 million tons of ore and costing operators AUD 320 million (USD 199.29 million) in sales. Queensland floods in March 2025 swamped 40 kilometers of the Goonyella line, pausing exports for nine days. Recurrent events now push insurers to lift premiums 15%-25%, removing 0.3 percentage points from growth[4]“Australian Infrastructure Statistics Yearbook 2025,” Bureau of Infrastructure and Transport Research Economics, bitre.gov.au.
*Our forecasts treat driver/restraint impacts as directional, not additive. The impact forecasts reflect baseline growth, mix effects, and variable interactions.
Segment Analysis
By Service: Automation Reweights Margin Pools Toward Value-Added Activities
Transportation services dominated the Australia mining logistics market with a 71.20% share in 2025. Rail moved 620 million tons, and road trains hauled 180 million tons, underscoring the scale of pit-to-port flows in Western Australia and Queensland. Yet digitalised locomotive fleets, predictive maintenance, and optimized loading are flattening the cost curve, tempering growth in the core haulage segment. Road remains indispensable for remote base-metal and gold sites beyond rail reach, while coastal shipping handles mineral sands and manganese where draft limits apply.
Value-added services such as blending, inventory management, quality assurance, and packaging are tracking a 4.65% CAGR (2026-2031), comfortably ahead of the Australia mining logistics market average. Miners cut stock-coverage days at Chinese steel mills to 18, stimulating demand for precise, just-in-time shipments. Fortescue reinvested AUD 216 million (USD 134.52 million) saved from AutoHaul into Pilbara blending hubs, confirming how automation reallocates capital toward higher-margin offerings. Qube and Toll added automated container handlers and expanded covered storage to capture lithium and copper flows that require contamination control, while drone-based stockyard measurement reduced blend variability by 15% at BHP facilities.


By Mineral/Metal: Diversification Boosts Higher-Value Streams
Coal retained 35.61% of Australia mining logistics market share in 2025, with metallurgical grades at 22% and thermal at 14%. Asian steelmakers’ gradual pivot to electric-arc furnaces eroded met-coal loadings 4% in 2025, and European climate policies trimmed thermal cargoes 6%.
Gold logistics, by contrast, are forecast to post a 5.13% CAGR between 2026-2031, outpacing coal and iron ore. Record USD 2,340 per-ounce prices accelerate Western Australia and Northern Territory output, triggering demand for secure, time-critical transport from mine gate to refinery. Emerging rare-earth and lithium corridors add specialized, container-based cargo that commands premiums over bulk freight. Copper concentrate from Mount Isa and Cloncurry rose to 1.8 million tons in 2025 and will benefit from the Australia mining logistics market size growth as new capacity at Townsville port comes onstream.
Geography Analysis
Western Australia contributed 63.70% of Australia mining logistics market value in 2025, anchored by 620 million tons of iron ore and 3.2 million tons of lithium concentrate. Captive rail spanning 1,800 kilometers and Port Hedland’s world-scale berths underpin the lowest delivered cost to Asian mills. Autonomous locomotives sliced rail operating expense 7% in 2025, reinforcing the region’s dominance. Still, three cyclones in two years triggered multi-day outages, highlighting resilience gaps in coastal assets. Green-iron pilots now create intra-state pit-to-plant corridors that may divert part of the export stream into domestic processing by 2028.
Queensland is projected to grow fastest at 4.50% CAGR (2026-2031), supported by met-coal demand recovery and copper expansion in the northwest. Rail duplications on the Goonyella and Blackwater systems deliver 25 million extra-ton capacity by late 2026, trimming queue times at Dalrymple Bay. However, the March 2025 flood that submerged 40 kilometers of track revealed the exposure of coastal corridors to climate events.
South Australia is emerging as a hydrogen logistics testbed. Six fuel-cell road trains on the Prominent Hill corridor target 30% fuel savings, and refueling capacity for 20 trucks will be operational by 2026. Northern Territory’s Nolans rare-earth project will move 14,000 tons annually by 2027 along a new 1,800 kilometer corridor to Darwin port that needs inert-gas ISO containers. New South Wales remains centered on Hunter Valley coal, while Victoria and Tasmania handle modest mineral sands and brown-coal loads, constrained by shallow ports. Collectively, these states account for 12% of Australia mining logistics market volume.
Regulatory Landscape
Australia mining logistics is shaped by nationally coordinated freight policy and state-based mining and environmental approvals, with heavy-vehicle operations anchored by the Heavy Vehicle National Law (HVNL) in most jurisdictions for vehicles above 4.5 tonnes (mass, dimension, loading, and compliance). The National Heavy Vehicle Regulator (NHVR) and National Transport Commission (NTC) also influence operating requirements through national guidance and standards used by carriers and contractors, including the Load Restraint Guide and the National Code of Practice for Heavy Vehicle Modifications (VSB6) that affect the design and operation of road-train combinations and specialized equipment on mine-to-port corridors.
For mining-related logistics assets, approvals can intersect with the Environment Protection and Biodiversity Conservation Act 1999 (EPBC Act) for matters of national environmental significance, affecting the timing and scope of rail spurs, port works, and new haul roads. Federal policy initiatives also frame investment priorities for critical-minerals supply chains, including the Australian Government Critical Minerals Strategy 2023-2030 and the National Freight and Supply Chain Strategy (2025-29 Action Plan), which emphasize resilient, data-enabled freight networks and strategic infrastructure for emerging mineral flows. Offshore minerals logistics, where applicable, sits under the Offshore Minerals Act 1994 administered via federal and state/territory Joint Authorities.
Value Chain Analysis
Australia mining logistics largely follows pit-to-port (and pit-to-plant) value chains, with the flow starting at mine planning, drilling and blasting, and materials handling, then moving through primary haulage (in-pit or on private haul roads), secondary haulage (road trains or heavy-haul rail), and port interface services (train unloading, stockyard stacking and reclaim, blending, and shiploading). Integrated miners, particularly in Pilbara iron ore, control captive rail and port systems that internalize line-haul and reduce third-party access. At the same time, outsourced providers and contractors, including Aurizon, Linfox, Qube, Toll, and specialist road and project logistics firms, supply line-haul capacity, warehousing, containerization, and value-added services such as contamination control for critical-minerals concentrates.
Key value-chain friction points cluster at the port-rail interface and along constrained regional corridors, where weather events, safety stoppages, and infrastructure limits can interrupt throughput and shift cargo to higher-cost modes. Recent operating signals show risk and cost being managed through integrated, multimodal contracting and targeted infrastructure: BHPs long-term logistics contracting with Aurizon for Copper South Australia emphasizes end-to-end rail-road-port coordination to reduce road exposure and improve reliability, while safety-driven pauses on private haulage roads in Western Australia highlight the ongoing importance of compliance, maintenance, and incident management for sustaining road-train productivity. For containerized and higher-value minerals, the chain increasingly adds covered storage, inert-gas handling, and tighter chain-of-custody processes from mine gate to export terminal to protect product integrity.
Competitive Landscape
The Australia mining logistics market sits at a moderate concentration level. Integrated miners BHP, Rio Tinto, and Fortescue move two-thirds of iron-ore tonnage over captive networks, locking in scale efficiencies yet limiting third-party access. Aurizon’s Queensland rail hauled 210 million tons in 2025 but is channeling USD 78 million into new wagons for bulk diversification. Pacific National deploys predictive maintenance on coal corridors to defend contracts. Qube and Toll enlarge value-added footprints through automated warehouses that cater to lithium and copper flows, winning premium fees.
White-space growth lies in critical minerals that require contamination-free handling and inert atmospheres. Linfox partnered with Arafura on rare-earth containers tailored to oxidation control, capturing high-margin lanes. Smaller outfits like Centurion target gold-doré haulage where security and time sensitivity trump size. Hydrogen truck pilots threaten diesel incumbents on inland routes longer than 400 kilometers if fuel-cell costs decline as forecast.
Technology patents for autonomous rail climbed 35% during 2024-2025, with Hitachi and Wabtec refining obstacle detection and energy management. Compliance with ISO 55001 asset-management standards has turned into a contract prerequisite as miners push end-to-end transparency for ESG audits.
Australia Mining Logistics Industry Leaders
Aurizon
Linfox Pty, Ltd.
BIS Industries
Centurion
Toll Holdings, Ltd.
- *Disclaimer: Major Players sorted in no particular order

Market Opportunities and Future Outlook
Automation and digital operations are creating services white space beyond core line-haul, especially as fleets and corridors shift from trials to day-to-day autonomous use. In 2026, a retrofit autonomous haulage deployment in Western Australia (EACON Mining Technologys day-shift autonomous operations using retrofitted Komatsu HD1500 trucks at the Havana Pit) and wider adoption of machine-learning tools for production classification (MaxMine deployments across sites operated by customers including Glencore, NRW Holdings, and Macmahon) expand demand for OT integration, interoperability, and data-backed performance management in mining logistics. This supports value-added offerings such as dispatch optimization, predictive maintenance, and automated stockyard measurement.
Capacity resilience and multi-user export pathways are another opportunity area, particularly in Western Australia where port access and safety constraints can tighten during disruption periods. A visible investment signal is the Port Hedland bypass channel work, with Pilbara Ports awarding a contract to Jan De Nul Australia for the Zone 5 Bypass Channel project in 2026 to improve maritime safety and operational resilience, alongside BHPs Port Hedland debottlenecking works at Nelson Point (including Car Dumper 6 construction under a broader port project). For emerging and smaller producers, open-access rail-to-port concepts such as Arc Infrastructure and FIJVs MoU to assess rail-based export pathways for the Yogi Magnetite Project at Geraldton Port point to commercial interest in shared logistics chains that reduce upfront infrastructure burden. Corridor-priority changes, including Infrastructure Australias March 2026 removal of the Mount Isa-Townsville Rail Corridor Upgrade from its national priority list, also underline an execution gap and the potential role for staged upgrades, private participation, and network scheduling solutions in constrained regions.
Recent Industry Developments
- July 2026: BHP approved execution of its Ministers North project in Western Australia, including construction of a 13 km haul road and land bridge connecting to existing Yandi infrastructure. The decision advances mine-to-network connectivity and underpins additional internal haulage and materials-handling activity linked to established Pilbara logistics systems.
- September 2025: Linfox strengthened its partnership with Fortescue, expanding specialized transport, warehousing, and distribution services across the Pilbara. The move supports higher service intensity around major iron ore operations and reinforces demand for integrated site-to-port support in Western Australia.
- June 2024: Rio Tinto completed an AutoHaul expansion to extend autonomous control across additional Pilbara rail sections. The upgrade deepens the shift toward autonomous heavy-haul rail operations, tightening cycle reliability and increasing the importance of data-enabled maintenance and train scheduling capabilities.


Research Methodology Framework and Report Scope
Market Definition and Coverage
For this study, we size mining logistics as the paid services used to move mining inputs and mined materials within Australia, starting from mine and processing sites and then to railheads, ports, and domestic or export handover points.
Scope exclusions: Excludes the value of the mined commodity itself, in-house captive transport that is not priced as a service, and most non-mining industrial freight that does not serve mining supply chains.
Segmentation Overview
- By Service
- Transportation
- Road
- Rail
- Coastal Shipping/Barge
- Air
- Warehousing and Inventory Management
- Value-added Services
- Transportation
- By Mineral / Metal
- Iron Ore
- Metallurgical and Thermal Coal
- Base Metals (Cu, Zn, Ni)
- Gold
- Other Minerals/Metals
- By Geography
- Western Australia
- Queensland
- New South Wales
- South Australia
- Northern Territory
- Victoria
- Tasmania
Data Sources, Market Sizing, and Validation
Desk Research
Desk research helped us set consistent anchors for volumes, routes, and operating conditions before pricing assumptions were applied. Public and official sources used for this included Australian Bureau of Statistics industry and freight series, Geoscience Australia mining statistics, the Department of Industry, Science and Resources updates on resources and energy production and exports, state mining departments and regulators (such as those in Western Australia and Queensland), Australian Rail Track Corporation network publications, and port authority throughput and trade reports.
To translate those signals into a usable market model, we also reviewed company annual reports, investor presentations, and audited financial statements, along with credible press coverage on corridor upgrades, weather impacts, and mine ramp-ups. Where needed, we used select paid subscriptions for company financials, patent databases to sanity-check technology adoption in haulage and handling, and shipment-level import and export checks to cross-verify trade-linked volumes. These examples are not exhaustive, and many other sources were referred to for data collection, validation, and clarification during the work.
Primary Interviews and Surveys
Primary inputs were gathered through interviews and surveys with logistics operators, mining supply chain teams, port and rail stakeholders, and service contractors that touch mine-to-port movements. For Australia coverage, conversations were balanced across the key producing states and the main commodity lanes so that pricing, utilization, and service mix assumptions could be confirmed and then stress-tested against desk findings.
Distribution of primary research fieldwork respondents
| Company type | Respondent position |
|---|---|
| Top tier: 36% | CXOs: 12% |
| Mid tier: 50% | Functional/Unit leaders: 31% |
| Smaller Players: 14% | Managers: 57% |
Market-Sizing & Forecasting
Sizing starts from a demand pool that is rebuilt using Australia mining output and corridor flow indicators, which are then translated into logistics service value using mode shares, typical haul distances, handling steps, and service pricing ranges. The totals are corroborated with selective bottom-up approximations, such as sampled operator revenue splits tied to mining exposure and lane-level checks on average price per ton-kilometer, and then the model is adjusted when implied rates do not match market feedback.
Inputs used in the model include mined tonnage for major commodities (iron ore, coal, base metals, and gold), mine-to-port and mine-to-rail movement patterns, port bulk throughput, rail access and path availability on key networks, diesel price trends that influence road line-haul pricing, and utilization shifts driven by new mine expansions or weather disruptions. Where a variable was not consistently available by state or corridor, gaps were filled using proxied shares from adjacent periods and then validated through interview-based confirmation.
For forecasting, we relied on scenario analysis anchored to expected mining production and export cadence, and then applied pricing and utilization paths that were checked with industry participants. We kept the base case consistent across commodities and then tuned it for corridors where rail constraints or port expansions clearly change the logistics mix.
Data Validation & Update Cycle
Outputs were checked against independent signals such as published port throughput, rail freight intensity, and publicly discussed mining-related revenue exposure in financial disclosures, and then the largest variances were investigated before sign-off. When a data point conflicted with the expected tonnage or price logic, we revisited the assumption, re-ran sensitivities, and re-contacted a subset of respondents if the change could materially move the total.
Each report is refreshed annually, with interim updates completed when a material event occurs, such as a major capacity addition, a policy change affecting haulage economics, or a sharp fuel-price swing. Before delivery, an analyst performs a fresh pass on key inputs and conversions so clients receive the latest updated view.
Mordor Intelligence's Australia Mining Logistics Market Size Compared With Other Published Estimates
Published market numbers for Australia mining logistics can look inconsistent because groups count different service layers and use different proxies for volumes and pricing. The spread usually comes from whether last-mile mine services are bundled with line-haul, how port and rail handling is treated, and how fast pricing is assumed to move with diesel and labor costs.
Some external estimates fold in a broader mining supply chain spend, including site services that are not always priced as third-party logistics. Under Mordor Intelligence, the total is limited to mining-linked transportation, warehousing and inventory management, and value-added logistics that directly supports the movement of mining materials from mine or processing locations to rail, ports, and destination markets, and the tonnage and corridor assumptions are refreshed on an annual cycle to avoid stale base-year mixes.
Benchmark comparison
| Source | Market Size | Gaps in Research Methodology |
|---|---|---|
| Mordor Intelligence | USD 10.02 B (2025) | |
| Industry Research House A | USD 10.00 B (2024) | Uses an earlier base year with rounding, and it appears to bundle additional mining support logistics beyond the core mine-to-rail and mine-to-port movement chain, which changes both the demand pool and service pricing mix. |
| Trade Journal B | USD 9.20 B (2025) | Often builds totals from a narrower set of visible corridors and applies conservative rate escalation, which can undercount higher-cost remote lanes and paid handling steps that show up in operator pricing. |
The comparison shows that year selection, service-layer coverage, and rate escalation assumptions explain most of the variance. By tying the demand pool to commodity tonnage and corridor movements and then checking prices through operator feedback, the final number stays traceable to repeatable inputs and straightforward checks.


Key Questions Answered in the Report
How large is the Australia mining logistics market in 2026?
How large is the Australia mining logistics market in 2026?
What is the forecast growth rate through 2031?
What is the forecast growth rate through 2031?
Which service area is expanding fastest?
Which service area is expanding fastest?
Which region records the highest value share in 2025?
Western Australia accounts for 63.70% of total market value in 2025, driven by Pilbara iron-ore output.
What technology trend is most transformative?
What technology trend is most transformative?
Which mineral segment shows the strongest growth outlook?
Which mineral segment shows the strongest growth outlook?
Page last updated on:


 Your data is secure and never sold or shared.


