
Market Overview
| Study Period | 2020 - 2031 |
|---|---|
| Forecast Data Period | 2026 - 2031 |
| Base Year Market Size (2025) | USD 1.07 Billion |
| Market Size (2026) | USD 1.09 Billion |
| Market Size (2031) | USD 1.19 Billion |
| Growth Rate (2026 - 2031) | 1.78 % |
| Market Concentration | Medium |
Major Players *Disclaimer: Major Players sorted in no particular order Image © Mordor Intelligence. Reuse requires attribution under CC BY 4.0. | |
Australia Metal Packaging Market Analysis by Mordor Intelligence
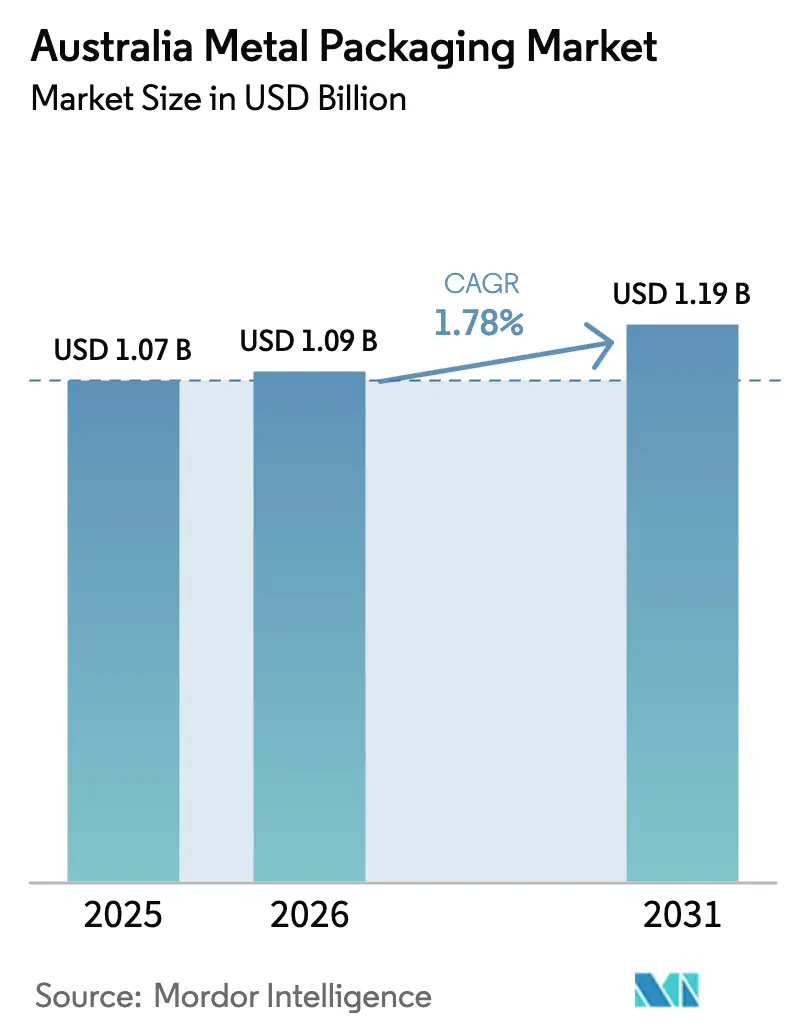
Australia metal packaging market size in 2026 is estimated at USD 1.09 billion, growing from 2025 value of USD 1.07 billion with 2031 projections showing USD 1.19 billion, growing at 1.78% CAGR over 2026-2031. Expansion remains measured as the sector matures, yet recycling incentives, bans on single-use plastics, and shifting consumer preferences toward circular solutions continue to underpin demand. Elevated aluminum can recovery rates, surpassing 80% after the nationwide Container Deposit Scheme roll-out, dramatically improve scrap availability and lower feedstock costs, tempering raw-material volatility. State bans on plastic takeaway items redirect volume into aluminum and steel formats, particularly in the food service industry, while digital can printing allows breweries and premium brands to rotate artwork without increasing inventories. Capacity additions by Orora, Visy Industries, and Ball Corporation safeguard supply continuity and shorten lead times, reinforcing the competitive position of metal relative to glass and flexible pouches.
Key Report Takeaways
- By material type, aluminum held 62.58% of Australia metal packaging market share in 2025; steel is projected to post the fastest 2.39% CAGR through 2031.
- By product type, cans led with 41.85% revenue share in 2025, whereas bulk containers are poised to expand at a 1.97% CAGR to 2031.
- By end-user industry, beverages accounted for 32.95% of the Australia metal packaging market size in 2025, while industrial users are set to grow at a 2.67% CAGR over the same horizon.
- By coating type, epoxy phenolic commanded 39.12% share of the Australia metal packaging market size in 2025, yet BPA-free systems are advancing at a 2.44% CAGR to 2031.
Note: Market size and forecast figures in this report are generated using Mordor Intelligence’s proprietary estimation framework, updated with the latest available data and insights as of 2026.
Australia Metal Packaging Market Trends and Insights
Drivers Impact Analysis*
| Driver | (~) % Impact on CAGR Forecast | Geographic Relevance | Impact Timeline |
|---|---|---|---|
| Expansion of aluminum beverage can recycling initiatives | +0.4% | National; early gains in NSW, Victoria, Queensland | Medium term (2-4 years) |
| Growing preference for lightweight and shelf-stable packaging | +0.3% | National; concentrated in urban centers | Long term (≥4 years) |
| Stringent Australian regulations on single-use plastic | +0.5% | National; state implementation varies | Short term (≤2 years) |
| Rising demand from craft beer industry for aluminum cans | +0.2% | National; Melbourne, Sydney, Brisbane hubs | Medium term (2-4 years) |
| Surge in demand for metal aerosol cans for insect repellents | +0.1% | National; tropical regions seasonality | Short term (≤2 years) |
| Adoption of digital printing on cans enabling limited-edition marketing | +0.2% | National; premium segments | Medium term (2-4 years) |
| Source: Mordor Intelligence | |||
Expansion of Aluminum Beverage Can Recycling Initiatives
Nationwide deposit refunds now cover every state, lifting aluminum recovery to 80-85%, which is well above plastics, and unlocking an annual AUD 200 million incentive stream that supports closed-loop supply chains. Visy Industries and its partners have demonstrated cans with 83% recycled content, achieving 95% lower energy consumption compared to primary smelting, resulting in substantive emissions offsets that meet the demands of emerging carbon-pricing regimes.[1]Australian Packaging Covenant Organisation, “Recycling and Recovery Report 2024,” packagingcovenant.org.au High scrap flow steadies input costs and supports capacity expansions, encouraging beverage brand owners to specify aluminum over PET. As federal climate rules tighten, the material’s recycling advantage widens compliance gaps versus single-use plastics.
Stringent Australian Regulations on Single-Use Plastic
State bans enforced between 2022 and 2024 have removed roughly 2.7 billion plastic articles from circulation, redirecting demand toward metal formats in takeaway and retail channels. Victoria’s curbs on plastic containers and Queensland’s broader scope covering plates and bowls create immediate substitution wins for aluminum trays and steel cans. Extended Producer Responsibility proposals assign lifecycle fees that favor readily recyclable substrates, narrowing price differentials with plastics and motivating retailers to regroup their assortments around metal pack formats. Compliance levies of AUD 0.15–0.30 (USD 0.097-0.19) per plastic unit further enhance the cost competitiveness of metal packaging.
Growing Preference for Lightweight and Shelf-Stable Packaging
Freight can account for up to 20% of the delivered packaging cost across Australia’s long-haul routes. Aluminum cans offer a 40% weight savings versus glass, reducing emissions and fuel costs for beverage shippers. The mining sector relies on lightweight steel drums to limit backhaul expense from remote sites, while digital decoration supports agile production runs that trim warehousing budgets for craft beverage firms. Durability and long shelf life also underpin resilience during bushfire-related supply disruptions, prompting supermarkets to prioritize canned goods for emergency stocking.
Rising Demand from Craft Beer Industry for Aluminum Cans
Craft beer volumes have increased by 12% annually, and independent brewers now account for 8.2% of national beer output, with cans being favored for blocking oxygen and light, which can degrade hop-forward styles. Asahi’s AUD 60 million (USD 38.97 million) canning upgrade underscores mainstream acknowledgment that canned presentation best supports brand freshness and sustainability targets. Excise advantages and rapid packaging line changeovers allow small brewers to capitalize on seasonal releases, further cementing the shift from glass to metal.
Restraints Impact Analysis*
| Restraint | (~) % Impact on CAGR Forecast | Geographic Relevance | Impact Timeline |
|---|---|---|---|
| Volatility in aluminum and steel commodity prices | -0.3% | National; import-dependent regions | Short term (≤2 years) |
| Increasing shift toward flexible pouches in food packaging | -0.2% | National; processed foods | Medium term (2-4 years) |
| Capacity constraints at domestic can sheet rolling mills | -0.2% | National; seasonal peaks | Medium term (2-4 years) |
| Consumer concerns over BPA alternatives in can coatings | -0.1% | National; health-focused consumers | Long term (≥4 years) |
| Source: Mordor Intelligence | |||
Volatility in Aluminum and Steel Commodity Prices
Spot aluminum swung 15–20% during 2024 as smelters grappled with energy cost spikes, while steel import duties of 15–25% aimed at dumping have tightened domestic availability.[2]Australian Bureau of Statistics, “International Trade: Goods and Services,” abs.gov.au Raw materials account for nearly 70% of the finished can cost, leaving converters vulnerable to price shocks until recycling streams fully stabilize. Currency fluctuations add another layer of risk, given Australia’s reliance on bauxite and specialty steel imports.
Increasing Shift Toward Flexible Pouches in Food Packaging
Lightweight pouches are growing 15–20% each year in processed foods and pet nutrition categories based on cost and shipping benefits. Although multilayer laminates challenge curbside collection systems and remain excluded from deposit schemes, brand owners value the perceived sustainability of reduced transport emissions. Metal packaging suppliers respond by highlighting 90%+ recycling rates and developing peel-seal can ends that mimic the convenience of pouches.
*Our forecasts treat driver/restraint impacts as directional, not additive. The impact forecasts reflect baseline growth, mix effects, and variable interactions.
Segment Analysis
By Material Type: Aluminum Leads Amid Steel's Accelerating Growth
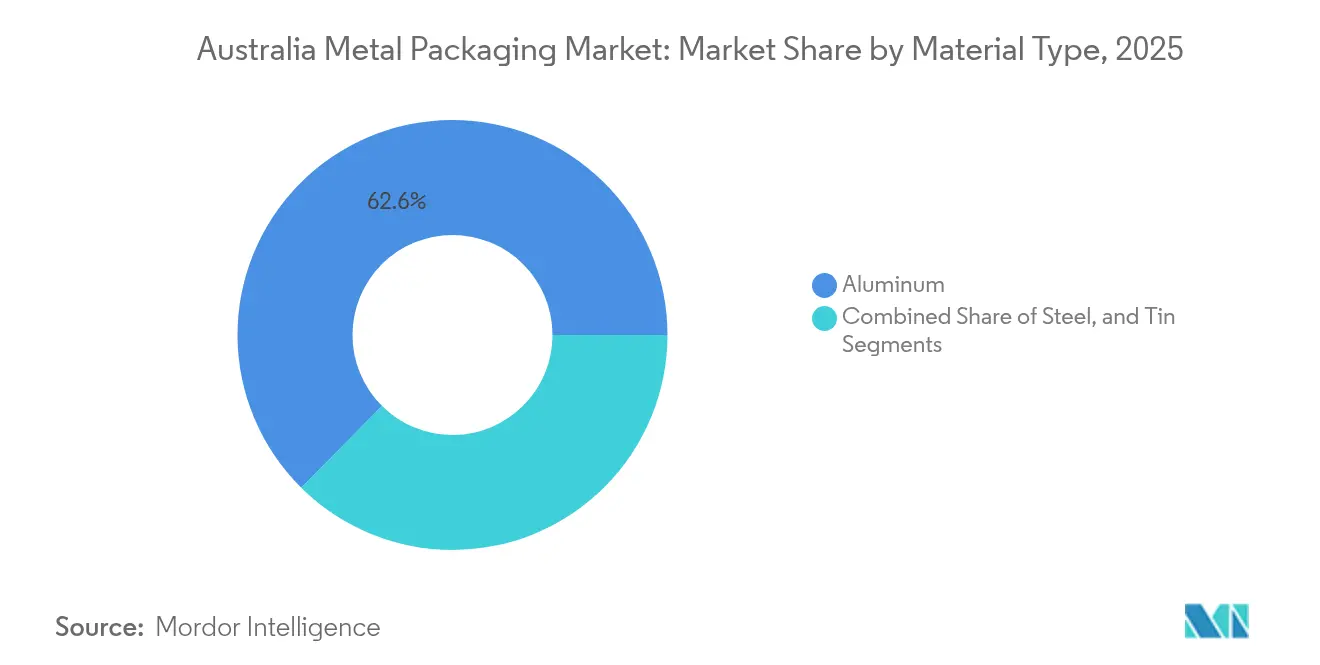
Aluminum controlled 62.58% of 2025 revenue, underpinned by its closed-loop advantage under the Container Deposit Scheme and strong adoption in beverages and aerosols. Steel, although still secondary, is forecast to capture the fastest 2.39% CAGR, driven by demand for chemical drums and industrial containers in mining hubs. The Australia metal packaging market relies on Rio Tinto’s scrap partnerships and domestic smelter output to keep aluminum price-competitive, whereas BlueScope backs steel’s resilience through localized supply.
Continual furnace upgrades enable higher recycled inputs, reducing scope 1 emissions and meeting procurement criteria tied to the National Circular Economy Strategy. Despite tinplate’s niche role in premium confectionery, its decorative appeal and barrier traits retain loyal downstream users. Guardrails on carbon intensity implied by state-based procurement add momentum to aluminum’s installed base, signaling sustained leadership even as steel grows in distinct heavy-duty niches.


By Product Type: Cans Dominate While Bulk Containers Surge
Cans generated 41.85% of 2025 turnover and anchor the public’s perception of the Australia metal packaging market, spanning carbonated soft drinks, beer, RTDs, canned meals, and aerosols. Bulk containers, including drums, IBCs, and pails, register the highest 1.97% CAGR, thanks to rising volumes of critical minerals processing fluids and agricultural chemicals. As colorful, digitally printed wraps propel can shelf presence, corrosion-resistant linings and UN ratings elevate bulk metal formats above plastics for hazardous goods.
The Australia metal packaging market size tied to craft brewing alone warranted numerous can line upgrades, yet drums have quietly extended into lithium brine transport where permeation resistance overrides cost. Suppliers now tout life-cycle LCAs that show repeat-use steel IBCs offset initial carbon debt within five cycles, framing the category as an emission-reducing solution for logistics-intensive resources businesses.
By End-User Industry: Beverage Leadership Challenged by Industrial Growth
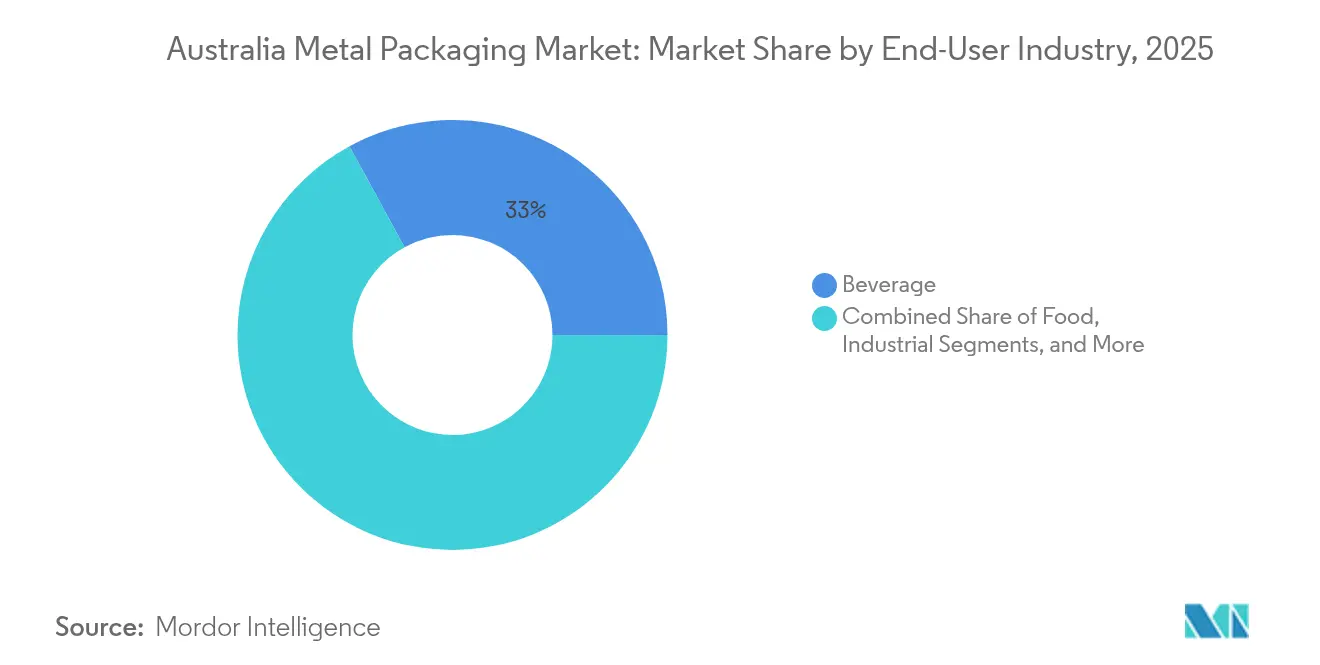
Beverages accounted for 32.95% of the market in 2025 and remain the emotional core of brand marketing spend. Energy drinks, hard seltzers, and functional RTDs keep aluminum innovation at the forefront, sustaining investment in matte finishes and augmented reality QR codes. However, industrial users are projected to outpace all sectors at a 2.67% CAGR, capitalizing on an expanding pipeline of battery-chemicals, paint, and specialty solvents operations.
The Australia metal packaging market share between beverage and industrial segments thus evolves toward parity by 2030 as miners specify steel and aluminum solutions that satisfy rigorous safety codes issued by Authorities Having Jurisdiction. Food can volume stabilizes under competitive pressure from pouches yet retains strategic relevance for emergency rations and export-oriented produce where dent-resistant steel remains the gold standard.
By Coating Type: Epoxy Phenolic Dominance Faces BPA-Free Challenge
Epoxy phenolic coatings accounted for a 39.12% share in 2025 due to their proven resistance to high-acid conditions. BPA-free options, growing at a 2.44% CAGR, now receive priority R&D budgets by AkzoNobel and PPG. Novel polyester systems claiming equal retort endurance aim to secure beverage approvals by 2026, although converters must adapt their curing profiles and validation protocols.
The Australia metal packaging market size associated with liner upgrades stays modest initially, yet brand commitments to bisphenol-free timelines accelerate volume shift. Regulatory gatekeepers add impetus by evaluating migration from next-generation monomers, guiding formulators to adopt fully disclosed chemistries that enhance consumer trust without sacrificing production rates.
Geography Analysis
New South Wales and Victoria jointly form the economic epicenter, absorbing roughly 60% of metal pack shipments thanks to dense populations, food-processing clusters, and major distribution hubs. NSW topped 85% aluminum can return rates in 2025, driving the lowest feedstock costs nationwide and giving local fillers a material margin edge. Victoria’s manufacturing renaissance fuels a steady demand for steel drums used in the chemical and paint industries, while its metropolitan consumer base drives the production of high-graphic beverage cans.
Queensland’s tropical climate intensifies demand for aerosol insecticides and RTD beverages; its mining hinterland concurrently boosts orders for heavy-gauge drums and IBCs. Western Australia, despite a lower population, accounts for a disproportionate bulk of container volume tied to iron-ore and lithium operations that prefer robust steel over plastic. South Australia benefits from premium wine exports that specify aluminum closures with oxygen-scavenging liners for cellarable vintages.
Tasmania and the Northern Territory remain smaller but strategic. Tasmania’s craft beverage scene sources cans from mainland converters but advertises 100% renewable power, using carbon-neutral can badges for differentiation. The NT’s defense infrastructure calls for MIL-spec metal containers for fuels and munitions, anchoring specialty demand at consistent levels. Finally, the Australian Capital Territory increasingly mandates sustainable packaging in government procurement tenders, functioning as a testbed for high-recycled-content formats that could later scale nationwide.
Interstate freight regulations award a clear advantage to aluminum’s lower weight for transcontinental hauls. Conversely, the cost premium of shipping empty drums from the east coast to Western Australia has triggered localized refurbishment networks, reinforcing circularity and cutting turnaround times. These regional dynamics collectively steer suppliers to diversify footprints and hedge against localized capacity squeezes during summer beverage peaks.
Regulatory Landscape
Australia is progressing packaging reforms aimed at a more circular economy, led by the Department of Climate Change, Energy, the Environment and Water (DCCEEW). The current co-regulatory settings continue to operate under the National Environment Protection (Used Packaging Materials) Measure 2011 (NEPM), while APCO guidance (including the Sustainable Packaging Guidelines) is used by brand owners and converters to align packs to recyclability and recycled-content expectations.
In May 2026, the Extended Producer Responsibility Scheme for Packaging (No Time to Waste) Bill 2026 was introduced to the Senate, with a Senate committee inquiry underway and a report due on 6 August 2026. Alongside national reform activity, state and territory rules shape day-to-day compliance (for example, New South Wales waste regulations and Queensland Waste Reduction and Recycling Regulations 2023), and chemical management requirements under IChEMS add scrutiny to substances used in packaging, including coatings, reinforcing demand for verified, compliant metal packaging systems.
Value Chain Analysis
Australia's metal packaging value chain runs from upstream metal inputs (aluminum and steel, including can sheet and tinplate) through conversion (can-making, ends, closures, drums/IBCs, and coatings/printing) to filling and packing, distribution, and post-consumer collection and reprocessing. APCO reporting indicates metal packaging represents a relatively small share of total packaging placed on the market by volume (4%), totaling 302,104 tonnes in 2022-23, but recovery is supported by established pathways through Container Deposit Schemes and commercial collections.
The midstream is anchored by vertically integrated domestic operators (notably Orora and Visy) and multinational technology and specialty format providers, including Ball and Crown. High aluminum recovery supports scrap availability, but domestic reprocessing capacity remains a constraint in parts of the chain, which can require exports of recovered material and increase exposure to can-sheet supply tightness. Facility-level efficiency investments and furnace and energy upgrades at sites such as Rocklea and Gawler highlight efforts to improve yield, reduce energy intensity, and increase recycled input utilization to meet brand and stewardship requirements.
Competitive Landscape
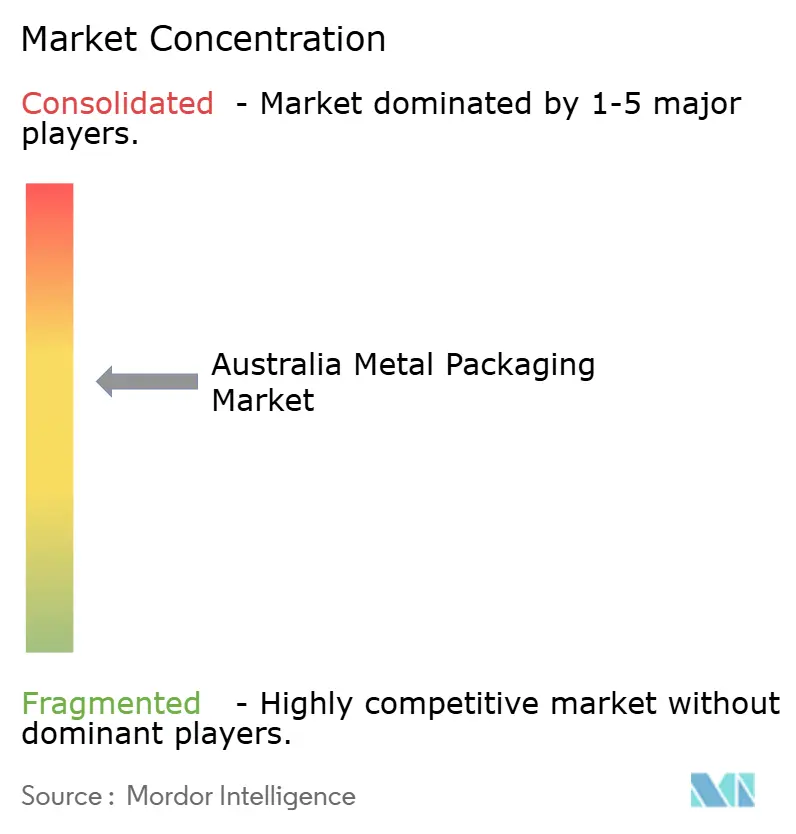
Moderate consolidation defines the Australia metal packaging market, as Orora, Visy Industries, Ball Corporation, Crown Holdings, and Silgan Holdings collectively account for about two-thirds of sales. Orora’s USD 130 million Rocklea expansion can boost output by 40%, underscoring management’s view that localized capacity pays off in freight savings and delivery agility. Visy’s Re-In-Can-Ation initiative, which delivers 83% recycled aluminum cans, elevates its ESG profile and contributes to brewer sustainability scorecards, securing multi-year supply contracts.
International majors pursue scale efficiencies: Ball Corporation’s Ballarat site added two lines with digital printing to tap into the growing craft and energy drink segments, while Crown’s aerosol investment broadens the product mix into high-growth personal-care and insect-repellent niches. Smaller players, such as Onpack and East Coast Canning, compete on service flexibility, leveraging mobile filling and short-run digital graphics to attract microbreweries.
Technological differentiation hinges on inline vision systems, smart-factory analytics, and blockchain-enabled traceability that verifies recycled content. Capital intensity and stringent food-grade accreditation keep entry barriers high, yet niche opportunities remain for startups offering refillable steel keg programs or direct-to-consumer personalized can designs. Overall rivalry stays disciplined, with capacity expansions calibrated to national demand plus limited export potential into New Zealand and the Pacific.
Australia Metal Packaging Industry Leaders
Amcor plc
Orora Limited
Visy Industries Holdings Pty Ltd
Ball Corporation
Crown Holdings, Inc.
- *Disclaimer: Major Players sorted in no particular order

Market Opportunities and Future Outlook
Active national work on packaging stewardship and circular economy policy is creating whitespace for producers and converters that can document recycled content, improve recyclability, and provide auditable material traceability. Parliamentary recommendations and ongoing DCCEEW-led packaging regulation reform discussions point to stronger producer-funded stewardship settings and potential minimum recycled content requirements, which can raise the value of domestic recycled aluminum feedstock and support closed-loop supply arrangements.
Capacity and capability investments also provide a practical route for suppliers to capture demand from beverages and adjacent end users that favor metal for circularity credentials and shelf-life performance. Orora's multi-year expansion program includes progress toward a third beverage can production line at Rocklea, and the company has set a recycled-content pathway in its Cans business (78% recycled content achieved in 2025, with an 80% target by 2030). These actions, alongside continued uptake of APCO-aligned sustainable packaging design practices, support opportunities in high-recycled-content beverage cans, specification-driven industrial drums/IBCs, and coating transitions where compliance and consumer assurance influence purchasing decisions.
Recent Industry Developments
- May 2026: Amcor plc announced an ASX update highlighting ongoing synergy realization from the Berry Global acquisition and integration progress. The development supports margin recovery and strengthens competitive positioning in metal packaging.
- April 2026: Orora Limited announced construction progress on the Rocklea third can line with commissioning planned for H1 FY2027. The expansion increases local beverage can capacity, improving supply security and delivery agility within Australia.
- April 2026: Orora Limited - Orora Cans reported that construction of the third can line at its Rocklea facility in Queensland is progressing, with the project slated for completion by the end of fiscal year 2026 and commissioning planned for the first half of fiscal year 2027. The update expands local output capacity and strengthens supply chain resilience for Australian customers.


Research Methodology Framework and Report Scope
Market Definition and Coverage
This market covers the revenue generated in Australia from metal packaging sold into end-use applications, including rigid formats such as cans, drums and barrels, bulk containers, and caps and closures, counted at the manufacturer selling price in USD.
Scope exclusions: Excludes non-metal packaging formats, secondary transport packaging that is not primarily metal, and machinery or services used to make packaging.
Segmentation Overview
- By Material Type
- Aluminum
- Steel
- Tin
- By Product Type
- Cans
- Food Cans
- Beverage Cans
- Aerosol Cans
- Decorative Cans
- Bulk Containers
- Drums and Barrels
- Caps and Closures
- Other Product Types
- Cans
- By End-User Industry
- Food
- Beverage
- Paints, Coatings and Chemicals
- Pharmaceuticals and Healthcare
- Industrial
- Other End-user Industries
- By Coating Type
- Epoxy Phenolic
- Acrylic
- Polyester
- BPA-Free Alternatives
- Other Coating Types
Data Sources, Market Sizing, and Validation
Desk Research
Desk research was used to map the demand pool and make sure our assumptions are anchored to real production and consumption signals. We referenced public statistics and standards sources such as the Australian Bureau of Statistics for manufacturing and trade series, the Department of Climate Change, Energy, the Environment and Water for packaging and waste policy signals, and state container deposit scheme performance updates for recycling return trends.
To translate activity into value, we also reviewed packaging and recycling association publications (for example, national packaging covenant style reporting), customs and port releases where relevant for metal inputs, and peer-reviewed papers on aluminum and steel packaging recovery and substitution. Company annual reports, investor presentations, and reputable business press were used to understand capacity additions, product mix changes, and pricing context. In addition, we used paid subscriptions focused on company financials, news and financials, patents, and shipment-level import export data to cross-check directional movements. The sources listed here are illustrative only, and many other public and paid references were used to collect, validate, and clarify data points.
Primary Interviews and Surveys
Primary interviews and structured surveys were used to confirm the split of demand by format and end use, and to sanity check how pricing moves through contracts across food, beverage, and industrial buying cycles. We spoke with a mix of packaging producers, downstream fillers and brand owners, distributors, and recycling or sustainability roles across Australia so gaps from desk findings could be closed and the final assumptions could be stress-tested before the model was locked.
Distribution of primary research fieldwork respondents
| Company type | Respondent position |
|---|---|
| Top tier: 33% | CXOs: 12% |
| Mid tier: 46% | Functional/Unit leaders: 30% |
| Smaller Players: 21% | Managers: 58% |
Market-Sizing & Forecasting
The sizing starts from a top-down build that reconstructs Australia demand using end-use output and pack-format adoption, which is then translated into metal packaging value through typical units per product, lightweighting trends, and average selling price ranges validated in interviews. To keep the outcome grounded, we corroborate totals with selective bottom-up checks, such as rolling up sampled producer revenues by product line, channel checks on can and closure volumes, and spot checks using volume multiplied by ASP for high-share formats.
Key model inputs include beverage and food packing activity, the pace of shift from glass or plastic into cans for selected categories, local filling capacity additions, and the aluminum and steel price environment that influences realized packaging pricing. We also track recycling return rates and policy timing (for example, container deposit scheme impacts), because these affect scrap availability and can change cost pass-through behavior. For forecasting, we rely mainly on scenario analysis supported by simple regression checks on the strongest drivers, and then the forward path is adjusted using the consensus view from primary respondents on volumes, pricing resets, and substitution momentum. Where bottom-up data is incomplete for smaller formats, gaps are handled through conservative share-based allocation using confirmed mix patterns and then rechecked against trade and production signals.
Data Validation & Update Cycle
Outputs are validated through multiple checks so the final numbers do not depend on any one assumption. We compare the modeled market value against independent signals like manufacturing activity, metal input trade direction, and format-level demand indicators, and then investigate any unusual jumps before sign-off.
A second analyst review is performed for logic, unit consistency, and year-on-year variance, and questions that cannot be explained are taken back to interviewees for clarification. Reports are refreshed annually, with interim updates when material events occur such as policy changes, major capacity moves, or sharp metal price shifts. Before delivery, a final review pass is completed to incorporate the latest available data series and confirm that currency conversions are applied consistently.
Mordor Intelligence's Australia Metal Packaging Market Sizing Compared With Other Published Estimates
Published market values can differ even when they use similar labels, because the counted formats, the selling point in the chain, and the timing of price updates are not always aligned. In metal packaging, small scope choices, such as whether caps and closures or industrial drums are included, can move the total more than many readers expect.
Container deposit scheme return rates, metal input trade direction, and local filling capacity signals are the checks that keep Mordor Intelligence's estimate tied to an Australia-only demand pool in manufacturer-level revenue terms, instead of mixing in adjacent packaging materials or downstream retail value.
Benchmark comparison
| Source | Market Size | Gaps in Research Methodology |
|---|---|---|
| Mordor Intelligence | USD 1.07 B (2025) | |
| Industry Research Publisher A | USD 2.30 B (2026) | Often aligns to metal container manufacturing industry revenue, which can include non-packaging fabricated metal items and contract work, and it may not separate packaging sold into end uses from broader plant turnover. |
| Packaging Portal B | USD 0.78 B (2025) | Typically narrows scope to beverage cans or food cans only and may apply a single ASP assumption without adjusting for closures, industrial formats, or mix shifts across food, beverage, and other applications. |
The table shows that most gaps come from what is counted and where the value is captured in the chain. By keeping inclusions tied to metal packaging formats sold in Australia and then validating totals against observable demand and recycling signals, the estimate stays traceable to clear inputs and repeatable steps.


Key Questions Answered in the Report
How big is the Australia metal packaging market in 2026?
It is valued at USD 1.09 billion, with a forecast to reach USD 1.19 billion by 2031 under a 1.78% CAGR.
Which material dominates metal packaging demand across Australia?
Aluminum leads with 62.58% share thanks to its closed-loop recycling economics and popularity in beverage cans.
What segment is growing fastest within Australia’s metal packaging landscape?
Industrial applications, especially mining and chemicals, are expanding at a 2.67% CAGR as demand rises for corrosion-resistant drums and IBCs.
How are single-use plastic bans affecting packaging choices?
Statewide bans have removed billions of plastic items, shifting food service and retail toward aluminum and steel options that already fit robust recycling systems.
Why are craft brewers choosing cans over bottles?
Aluminum cans shield beer from light and oxygen, align with sustainability messaging, and enable small-batch digital graphics that strengthen brand storytelling.
What technology trend is reshaping can decoration?
Digital printing lets converters produce limited editions without plates, cutting lead times and permitting high-resolution artwork for seasonal promotions.
Page last updated on:


 Your data is secure and never sold or shared.


