
Market Overview
| Study Period | 2020 - 2031 |
|---|---|
| Forecast Data Period | 2026 - 2031 |
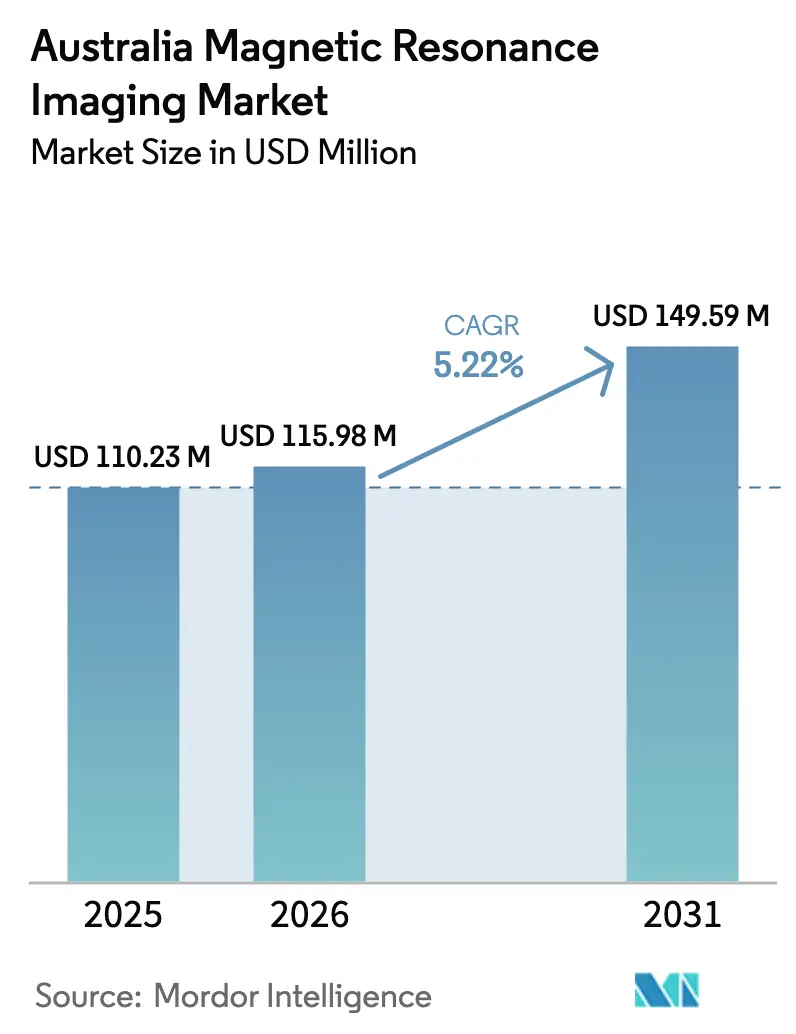
| Base Year Market Size (2025) | USD 110.23 Million |
| Market Size (2026) | USD 115.98 Million |
| Market Size (2031) | USD 149.59 Million |
| Growth Rate (2026 - 2031) | 5.22 % |
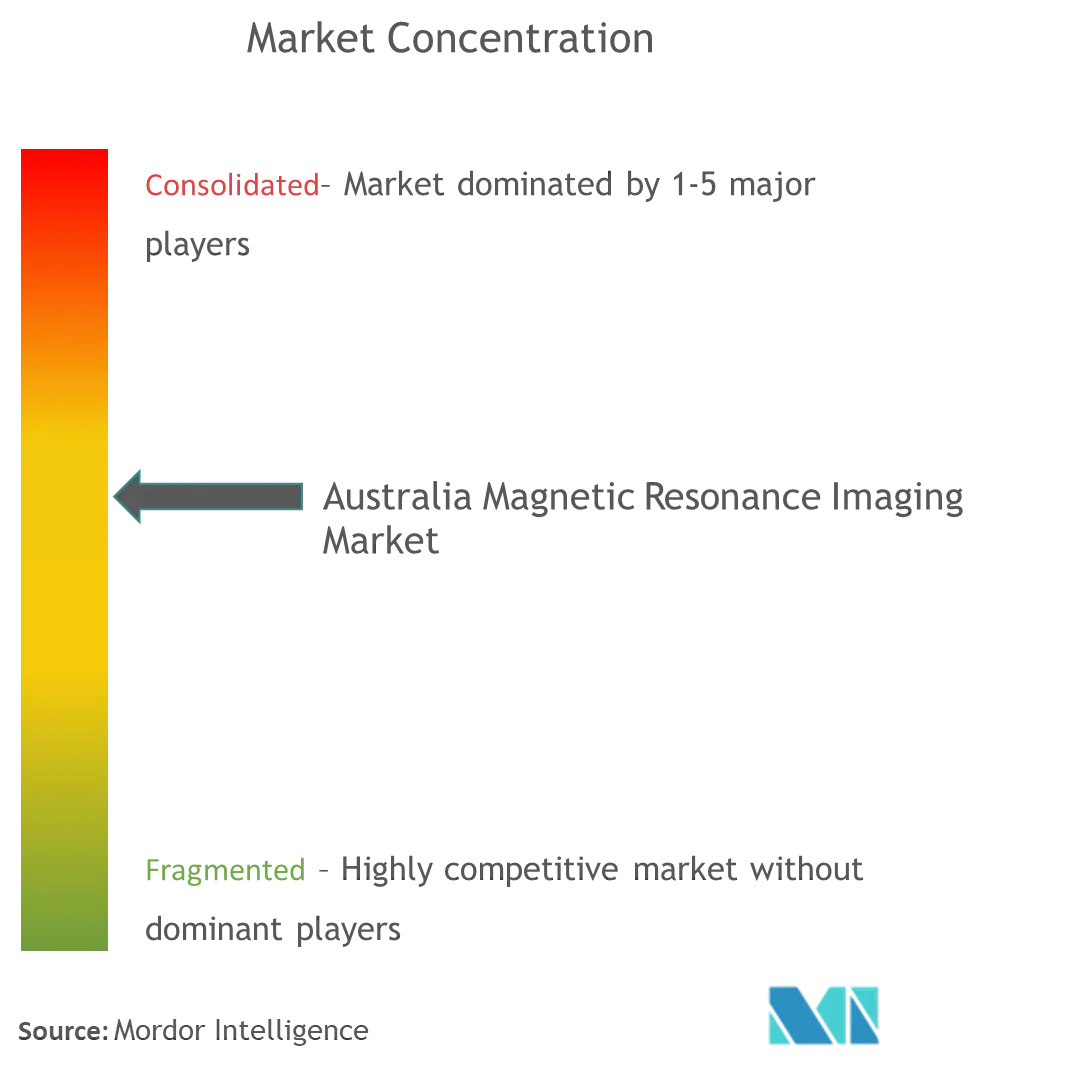
| Market Concentration | Medium |
Major Players *Disclaimer: Major Players sorted in no particular order Image © Mordor Intelligence. Reuse requires attribution under CC BY 4.0. | |
Australia Magnetic Resonance Imaging Market Analysis by Mordor Intelligence
The Australia MRI market size was valued at USD 110.23 million in 2025 and estimated to grow from USD 115.98 million in 2026 to reach USD 149.59 million by 2031, at a CAGR of 5.22% during the forecast period (2026-2031). This expansion is driven by rapid install-base refresh cycles in Tier-1 hospitals, Medicare licensing reforms that will make all scanners fully eligible for reimbursement by 2027, and continuous hardware-software convergence that compresses scan times to under 10 minutes. Infrastructure investments channel public-private capital into large mixed-use hospital precincts, while helium-saving magnet designs mitigate supply-chain risk and lower lifetime operating costs. Competition is shifting from pure hardware differentiation toward AI-enhanced workflow solutions that raise room utilization and throughput without proportionate head-count increases. Collectively these forces place the Australia MRI market at the center of a nationwide diagnostic-imaging upgrade that aligns population health goals with precision-medicine capabilities.
Key Report Takeaways
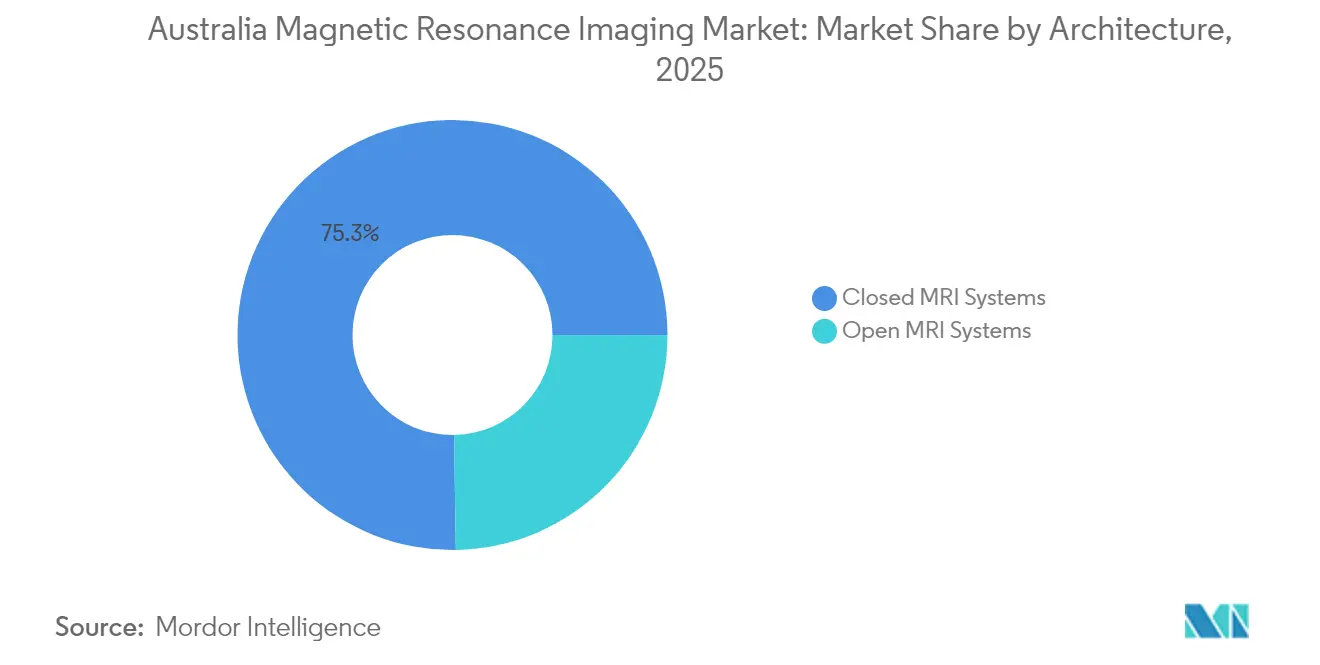
- By architecture, closed MRI systems led with 75.25% of the Australia MRI market share in 2025; open systems are advancing at a 6.02% CAGR through 2031.
- By field strength, high-field 1.5 T scanners accounted for 55.78% share of the Australia MRI market size in 2025, whereas 3 T and higher systems are expanding at a 6.07% CAGR between 2026 and 2031.
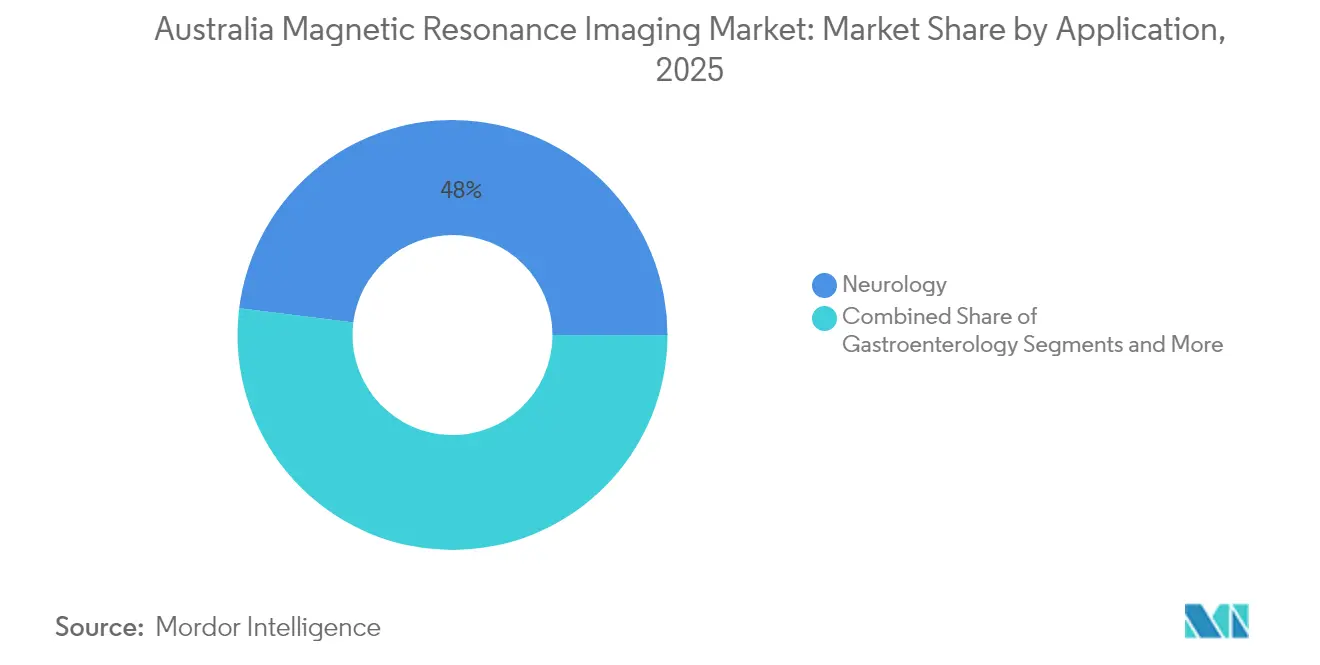
- By application, neurology commanded 48.02% of the Australia MRI market share in 2025; oncology is projected to rise at a 6.19% CAGR to 2031.
Note: Market size and forecast figures in this report are generated using Mordor Intelligence’s proprietary estimation framework, updated with the latest available data and insights as of 2026.
Market Trends and Insights
Drivers Impact Analysis of Australia Magnetic Resonance Imaging Market*
| Driver | (~) % Impact on CAGR Forecast | Geographic Relevance | Impact Timeline |
|---|---|---|---|
| Install-base refresh in Tier-1 hospitals | +1.2% | Sydney, Melbourne, Brisbane | Medium term (2-4 years) |
| Public-private partnership funding for imaging suites | +0.9% | National, early gains in Queensland and NSW | Medium term (2-4 years) |
| Hybrid PET/MRI roll-outs | +0.7% | Tertiary centers and research hubs | Long term (≥ 4 years) |
| Medicare reimbursement expansion for cardiac MRI | +0.8% | National coverage | Short term (≤ 2 years) |
| AI-driven scan-time compression | +1.1% | Technology-forward facilities nationwide | Short term (≤ 2 years) |
| Intra-operative MRI demand in neurosurgery | +0.5% | Major neurosurgical centers | Long term (≥ 4 years) |
| Source: Mordor Intelligence | |||
Growing Install-Base Refresh Cycle in Tier-1 Hospitals
Leading metropolitan hospitals replace scanners every 10–15 years, yet 2025 procurement plans show accelerated timelines as facilities migrate to helium-light magnets that cut energy consumption by up to 45% [1]. Ramsay Health Care invested USD 145 million in new infrastructure during 2024, signaling a sustained appetite for asset renewal across private networks. Replacement demand is further amplified by AI-enhanced reconstruction that raises scanner throughput by 20–32%, justifying early retirement of legacy units. Equipment vendors now bundle workflow analytics, staff training, and predictive-maintenance subscriptions, converting one-time hardware sales into multiyear service revenue. This refresh momentum underpins predictable shipment volumes across the Australia MRI market, encouraging manufacturers to localize support and parts inventories for faster uptime.
Public-Private Partnership Funding Surge for Imaging Suites
Sophisticated PPP structures blend public health mandates with private capital to deliver multi-modality imaging wings faster than traditional procurement. The USD 1.5 billion Coomera hospital precinct in Queensland will house a comprehensive MRI suite integrated with ambulatory and inpatient services, creating a blueprint for mixed-use medical campuses nationwide. PPP models transfer design-build risk to private operators while guaranteeing minimum service levels under long-term concessions, making the framework appealing for cash-constrained state systems. For vendors, PPP projects provide bundled orders covering scanners, service contracts, and software upgrades over a 10- to 20-year horizon, enlarging the addressable Australia MRI market beyond fragmented single-site deals.
AI-Driven Scan-Time Compression Protocols
Deep-learning reconstruction has moved from research to clinical reality. Monash University’s 5-minute whole-body prototype demonstrated diagnostic parity with conventional sequences. Commercial implementations achieve 53% shorter protocols and 41% less room occupancy, translating to higher daily exam volumes without added staff [2]. Harrison.ai supports half of Australian radiologists with cloud algorithms that lift detection accuracy by 45% while processing 6 million scans annually. Hospitals leverage these gains to reduce waiting lists that historically stretched beyond 6 months in some metropolitan corridors. The software-centric value shift compels OEMs to embed AI licenses in new equipment quotations, raising average selling prices and fueling reinvestment in R&D.
National Medicare Reimbursement Expansion for Cardiac MRI
Permanent MBS item 63390 came into force in January 2025, transforming temporary pandemic provisions into a standing benefit for myocarditis assessment. Cardiac MRI now attracts full Medicare coverage in both public and private sites, stimulating protocol development for ischemia, viability, and arrhythmia mapping. Early adopter institutions report an 18% rise in cardiac MRI referrals within the first nine months of policy implementation. Vendors respond with dedicated cardiac coils, faster cine sequences, and post-processing packages that quantify myocardial fibrosis, thereby expanding the clinical utility of 1.5 T scanners already in service. The reimbursement upgrade aligns with broader objectives to curb cardiovascular morbidity through earlier detection and non-invasive monitoring.
Restraints Impact Analysis of Australia Magnetic Resonance Imaging Market*
| Restraint | (~) % Impact on CAGR Forecast | Geographic Relevance | Impact Timeline |
|---|---|---|---|
| High upfront capex for ≥ 3 T systems | -1.4% | Nationwide, sharper at smaller facilities | Medium term (2-4 years) |
| Rural radiology workforce shortages | -0.8% | Regional and remote Australia | Long term (≥ 4 years) |
| Lengthy TGA approvals for Class III devices | -0.6% | National regulatory impact | Short term (≤ 2 years) |
| Helium and gradient-coil supply risk | -0.9% | All operating sites | Short term (≤ 2 years) |
| Source: Mordor Intelligence | |||
High Upfront Capital Expenditure for ≥ 3 T Systems
Acquisition of a state-of-the-art 3 T scanner costs USD 3–5 million, with room construction, shielding, and power conditioning often doubling that figure. Annual service contracts add USD 200,000–250,000, and helium refills can exceed USD 100,000, despite newer low-vent magnets. Smaller metropolitan hospitals and regional clinics struggle to build economic cases for premium systems when daily exam volumes fall below 15. Vendor financing and pay-per-use models partially bridge the gap, but the capital hurdle remains the most significant brake on ultra-high-field adoption across the Australia MRI market.
Rural Workforce Shortages in Radiology
Approximately 28% of Australians live outside major cities, yet only 16% of radiologists practice there, creating access inequities that limit scanner utilization and prolong diagnostic timelines. A longitudinal study of community-controlled health services in remote Northern Territory and Western Australia recorded turnover rates exceeding 150% over two years, illustrating fragile staffing pipelines. Without consistent radiographers and radiologists, even funded MRI installations may operate at sub-optimal capacity, undermining return on investment and patient outcomes. Tele-reporting alleviates some gaps, but on-site expertise remains critical for advanced cardiac or interventional exams.
*Our forecasts treat driver/restraint impacts as directional, not additive. The impact forecasts reflect baseline growth, mix effects, and variable interactions.
Australia Magnetic Resonance Imaging Market Segment Analysis
By Architecture:
Closed Systems Anchor Utilization While Open Designs Gain TractionClosed-bore scanners retained 75.25% of installations in 2025, reflecting their higher gradient performance, broader protocol libraries, and compatibility with advanced neuro and cardiac coils. This dominance translates into sizeable service-contract annuities that reinforce OEM leadership positions. The Australia MRI market size for closed systems reached USD 82.94 million in 2025 and is on track for a 5.05% CAGR to 2031.
Open systems, although just 24.75% of units, are growing at a 6.02% CAGR thanks to pediatric and bariatric referrals and rising patient-experience standards. Fujifilm’s 0.4 T Aperto Lucent introduced motion-compensated fat suppression, narrowing the diagnostic gap relative to 1.5 T closed scanners while preserving spacious ergonomics. Private outpatient centers adopt open architectures to differentiate on comfort and broaden referral networks. As AI reconstruction compensates for lower intrinsic signal-to-noise ratios, open devices will keep eroding closed-system share in select ambulatory niches, yet the performance ceiling of high-field closed magnets secures their primacy for complex neuro-oncology and cardiac workflows.

By Field Strength:
1.5 T Remains Workhorse, Ultra-High Field Builds Research MomentumHigh-field 1.5 T platforms generated 55.78% of 2025 revenues, balancing acquisition cost, throughput, and multi-organ versatility. The Australia MRI market share leadership stems from the modality’s inclusion in virtually every hospital imaging department and its compatibility with existing contrast agents and pacemaker protocols. Over the forecast window the segment grows at 4.65%, slower than the overall market, yet it will still account for more than half of installed base in 2031.
Very-high and ultra-high 3 T and 7 T systems are expanding at a 6.07% CAGR as research universities and comprehensive cancer centers invest in functional neuroimaging, spectroscopy, and diffusion tensor studies that demand higher field strengths. GE Healthcare’s head-only SIGNA MAGNUS, equipped with 300 mT/m gradients, exemplifies purpose-built ultra-high-field innovation targeting connectome mapping and epilepsy localization. Although helium-free mid-field designs threaten to disrupt the traditional field-strength hierarchy, reimbursement frameworks still favor 1.5 T and 3 T for routine clinical care, anchoring demand for conventional superconducting platforms across the Australia MRI market.
By Application:
Neurology Holds Lead as Oncology AcceleratesNeurological imaging earned 48.02% of 2025 revenue, reflecting Australia’s aging demographics and the modality’s superiority in detecting demyelinating diseases, dementia, and spinal cord pathology. Integration of intra-operative MRI with neuronavigation elevates gross-total resection rates from 87.7% with standard microneurosurgery to 96.6%, validating MRI’s therapeutic impact as well as its diagnostic utility. The Australia MRI market size for neurological uses will exceed USD 71.5 million by 2031.
Oncology, currently 12.85% of revenue, is the fastest mover with a 6.19% CAGR. Growth hinges on precision-medicine protocols that require quantitative imaging biomarkers for tumor characterization, therapy planning, and response monitoring. Siemens’ Nexaris MR platform merges diagnostic sequences with intra-operative guidance, allowing surgeons to update margins in real time. Cardiac, musculoskeletal, and abdominal applications trail but collectively contribute steady incremental volume as AI automates complex post-processing and lowers interpretation barriers for non-specialist radiologists.
Geography Analysis
Australia’s MRI ecosystem clusters around eastern-seaboard states where population density and tertiary hospitals coincide. New South Wales and Victoria together hosted 61.55% of operational scanners in 2025, leveraging large academic networks and favorable private insurance penetration. The Australia MRI market size in these two states was USD 67.85 million in 2025, advancing at 4.98% through 2031 as license restrictions ease.
Queensland is the fastest-growing region at a 6.65% CAGR. Projects like the Coomera precinct and Gold Coast Health’s MR-guided focused ultrasound service exemplify public-private collaboration that expands modality reach while introducing cutting-edge neuro-therapeutic applications. Demand also stems from the state’s in-migration, which raises per-capita imaging volumes and incentivizes new outpatient centers.
Western Australia and the Northern Territory face distance and workforce hurdles that limit scanner density. Federal allocations worth USD 69.8 million in the 2024–2025 budget will remove licensing caps in MMM1 areas by July 2025 and extend full eligibility to all diagnostic practices by July 2027, aiming to correct regional access gaps. Portable innovations such as Hyperfine’s bedside 0.064 T Swoop, cleared by the TGA in 2022, allow opportunistic brain imaging in small hospitals, rural clinics, and even mining camps, providing a technology bridge until fixed installations become viable .
Regulatory Landscape
MRI systems and related software supplied in Australia are regulated as medical devices under the Therapeutic Goods Act 1989 and the Therapeutic Goods (Medical Devices) Regulations 2002, with oversight by the Therapeutic Goods Administration (TGA). Devices generally need inclusion in the Australian Register of Therapeutic Goods (ARTG) before supply (unless exempt), and sponsors act as the local regulatory interface for offshore manufacturers.
Market access depends on demonstrating compliance with the Essential Principles (safety, performance, and quality) through conformity assessment and clinical evidence, supported by TGA guidance such as its Clinical Evidence Guidelines for Medical Devices (version 3.2). MRI safety expectations also align with implant safety assessment practices that reference standards such as ISO/TS 10974:2018, which becomes more relevant when upgrading scanner fleets for cardiac and neuro settings where implant prevalence is higher.
Value Chain Analysis
The value chain is anchored by global OEMs and their Australian or ANZ operations (for example, Siemens Healthineers, GE HealthCare, and Canon Medical Systems ANZ). Sponsors and local entities handle ARTG inclusion and post-market obligations with the TGA.
Upstream inputs include superconducting magnets, gradients, RF coils, and software stacks (reconstruction and workflow). Helium management and gradient-coil availability remain practical constraints that influence product selection and service planning. Downstream, hospitals, imaging networks, and PPP-delivered precincts procure MRI through competitive tenders that bundle equipment, installation, shielding and site works, applications training, and multi-year maintenance. As scan-time compression and AI-enhanced workflow move into standard proposals, the chain shifts toward software licensing, remote monitoring, and predictive maintenance, which increases the importance of in-country service engineers, parts availability, and clinical application specialists to protect uptime and throughput.
Competitive Landscape
The Australia MRI market reflects moderate concentration. Siemens Healthineers, GE Healthcare, and Philips captured an estimated 65% of 2024 shipments, leveraging comprehensive portfolios and entrenched service footprints. Siemens opened a USD 314 million helium-light magnet plant in 2024, shortening regional lead times and reinforcing its sustainability message. GE Healthcare advanced a macrocyclic manganese contrast agent through Phase I, targeting safer alternatives to gadolinium and strengthening its consumables ecosystem.
Disruptors are reshaping value pools. Hyperfine commercialized the first portable FDA- and TGA-cleared MRI unit, unlocking bedside neuroimaging and expanding total addressable market, especially in rural and emergency settings. Harrison.ai embeds computer-vision tools across multi-vendor fleets, selling algorithm-as-a-service subscriptions that scale independently of hardware cycles. Fujifilm differentiates via spacious open-bore designs that appeal to claustrophobic and pediatric cohorts, while Magnetica develops local superconducting coils, aligning with government ambitions to grow domestic med-tech manufacturing.
Competitive intensity revolves around helium-free magnet engineering, AI workflow orchestration, and pay-per-use financial models. Vendors now bundle cloud analytics, remote fleet monitoring, and predictive maintenance, diluting pure hardware margins but deepening client lock-in. Regulatory pathways remain a key gating factor; early TGA approvals secure first-mover advantage, yet stringent post-market surveillance levels the field over the long term.
Australia Magnetic Resonance Imaging Industry Leaders
-
Siemens AG
-
Canon Medical Systems
-
GE Healthcare
-
Fujifilm Holding Corporatio
-
Koninklijke Philips N.V.
- *Disclaimer: Major Players sorted in no particular order
Australia Magnetic Resonance Imaging Market Companies Covered in this Report
- Siemens Healthineers
- GE Healthcare
- Koninklijke Philips
- Canon
- Fujifilm Holdings (Incl. Hitachi)
- United Imaging Healthcare
- Esaote S.p.A.
- Sonologic
- Hyperfine
- Aspect Imaging
- Aurora Imaging
- Mediso
- Imris
- Neusoft
- Mindray
- MR Solutions
- Synaptive Medical
Read Analysis of Australia Magnetic Resonance Imaging Companies
Market Opportunities and Future Outlook
The mid-decade policy and compliance calendar creates room for vendors and providers that can operationalize both reimbursement and traceability changes. Medicare reimbursement reforms described in the report context, with full scanner eligibility targeted by 2027, broaden the commercial base for MRI services. Separately, the Unique Device Identification (UDI) rollout commencing from 1 July 2026 for higher-risk devices raises expectations around device data governance across installed fleets and accessories used in MRI environments.
On the demand side, the named projects and programs point to where near-term deployments concentrate, including PPP hospital precinct builds such as the Coomera hospital precinct in Queensland. The report context also references research-linked installations supported through national infrastructure programs, including NCRIS-backed imaging initiatives in recent facility upgrades. Providers that combine faster protocols, including deep-learning reconstruction, with workforce-efficient operating models for regional and outer-metro corridors address the access gap tied to radiology staffing constraints. For OEMs, packaging helium-saving magnets alongside service and analytics strengthens the path to lifecycle value capture across renewals and redevelopments.
Recent Industry Developments in Australia Magnetic Resonance Imaging Market
- June 2026: Canberra Health Services closed a public tender for the supply, installation, and maintenance of a 1.5 Tesla MRI system for radiation oncology at Canberra Hospital. The scope included enabling works such as removing an existing CT scanner and refurbishing bunker infrastructure, favoring suppliers that can deliver a turn-key project and long-term service coverage.
- May 2026: An MRI system arrived at Nepean Hospital in New South Wales as part of the Stage 2 redevelopment program, with GE HealthCare referenced in project reporting around major equipment deployment. The redevelopment-linked procurement supports multi-modality modernization and reinforces the role of large public hospital upgrades as anchor demand for high-value imaging installations.
- October 2024: SyntheticMR obtained Australian regulatory clearance for SyMRI 15, enabling quantitative relaxometry tools for local radiology practices. The clearance expanded the software layer available to MRI operators, supporting protocol standardization and opening pathways for value creation beyond scanner hardware.
Australia Magnetic Resonance Imaging Market Report Scope and Research Methodology
Market Definition and Coverage
This market covers revenue generated in Australia from magnetic resonance imaging (MRI) systems and related technology used to produce diagnostic images in clinical settings. The sizing reflects demand linked to imaging centers and hospitals, and it is expressed in USD value terms for the study period.
Scope exclusions: It does not count MRI scan procedure reimbursements, radiologist reporting fees, or broader imaging modality revenues outside MRI.
Segments Covered in This Report
- By Architecture
- Closed MRI Systems
- Open MRI Systems
- By Field Strength
- Low-field (<1.0 T)
- High-field (1.5 T)
- Very-high & Ultra-high (3 T, 7 T)
- By Application
- Oncology
- Neurology
- Cardiology
- Gastroenterology
- Musculoskeletal
- Other Applications
Data Sources, Market Sizing, and Validation
Desk Research
Desk research was used to anchor the model on Australia-specific healthcare capacity and imaging utilization signals, before any assumptions were finalized. We referenced public sources such as the Australian Institute of Health and Welfare, the Australian Bureau of Statistics, Medicare Benefits Schedule (MBS) item descriptions and updates, and the Australian Government Department of Health and Aged Care releases that indicate funding and policy direction.
To translate these signals into market value logic, we also reviewed Australian hospital and imaging center disclosures, tender notices, importer and trade category statistics where relevant, and peer-reviewed radiology and health economics publications that discuss MRI adoption and clinical pathway shifts. Company filings, investor presentations, and reputable press were used to sanity check installation momentum and replacement behavior, while approved paid subscriptions supported company financial intelligence, shipment level import-export checks, and patent activity tracking. The desk sources listed here are illustrative only, and many other public documents and databases were also reviewed for validation and clarification.
Primary Interviews and Surveys
Primary work was used to pressure-test what desk research could not reliably show, especially purchase timing, replacement cycles, and realistic pricing movement by field strength and system type. We spoke with a mix of hospital imaging heads, independent radiology operators, procurement and biomedical teams, and channel-side experts across Australia so the final assumptions could be checked against real buying behavior.
Distribution of primary research fieldwork respondents
| Company type | Respondent position |
|---|---|
| Top tier: 34% | CXOs: 12% |
| Mid tier: 51% | Functional/Unit leaders: 38% |
| Smaller Players: 15% | Managers: 50% |
Market-Sizing & Forecasting
The core sizing starts from a top-down build where imaging demand signals are reconstructed into an addressable equipment spending pool, then translated into value using realistic price bands. For example, procedure volumes implied by MBS activity, capacity expansion announcements, and public hospital investment cycles help indicate how many systems are needed and when upgrades are likely to happen.
Those totals are then corroborated with selective bottom-up approximations, such as sampled system pricing by field strength, channel checks on delivery timing, and a roll-up of observed replacement and upgrade patterns across large and mid-sized providers. Key inputs used in the model include installed base refresh behavior, share of closed versus open systems, the mix of low, high, and very high field strength placements, utilization and throughput changes (including workflow improvements that shorten scan time), and procurement lead times that can shift revenue recognition across years. Where bottom-up visibility is incomplete, gaps are handled through conservative ranges that are narrowed using interview feedback and public tender cadence.
For forecasting, scenario analysis is applied with a base case that reflects policy stability, expected replacement needs, and realistic budgeting cycles, and then stress-tested with faster and slower adoption cases. Assumptions around field strength mix and average selling price progression are refreshed using expert consensus so growth does not get overstated when procurement timing pulls demand forward.
Data Validation & Update Cycle
Validation is done through repeated cross-checks so the outputs stay tied to real-world constraints, rather than only to mathematical growth curves. We compare model results with independent signals like public procurement activity, hospital expansion timelines, and utilization indicators, and then review outliers that appear as sudden jumps in value, unusual price swings, or year-to-year shifts that do not match buying cycles.
Before sign-off, the work goes through multiple analyst reviews where assumptions are re-checked and sources are re-opened for any number that looks inconsistent. If a material variance is found, interview re-contact is triggered to confirm whether the change is timing-related, policy-related, or a true demand shift. Reports are refreshed annually, with interim updates for major events, and a final pre-delivery pass is completed so clients receive the latest updated view.
Mordor Intelligence's Australia Magnetic Resonance Imaging Mri Market Size Compared Against Other Published Estimates
Published MRI market values for Australia can vary more than people expect, even when everyone is looking at the same hospitals and imaging networks. Differences usually come from what is being counted as the market, how prices are treated over time, and whether the model follows procurement timing versus clinical activity signals.
The main gap drivers in this market tend to be whether the estimate includes only MRI systems revenue or also adds service contracts, refurbished unit flows, and broader diagnostic imaging equipment categories. Another common cause is the handling of average selling prices by field strength, where some figures apply a single blended ASP and others reflect the shift toward higher field strength placements and software upgrades. Currency conversion timing and refresh cadence also matter, because a slow update cycle can miss policy changes that move reimbursement eligibility or alter replacement urgency.
Benchmark comparison
| Source | Market Size | Gaps in Research Methodology |
|---|---|---|
| Mordor Intelligence | USD 110.23 M (2025) | |
| Industry Association A | USD 165.00 M (2025) | Often presented as an imaging equipment spending bucket that blends MRI with adjacent modality upgrades and multi-year service coverage, which inflates value versus MRI systems-only tracking. |
| Regional Consultancy B | USD 92.00 M (2025) | Typically leans on conservative capital spend assumptions and a slower replacement cycle, and it may apply a flat blended ASP that undercounts higher field strength mix and upgrade-driven pricing. |
The spread in the table is largely explained by scope choices and by how replacement timing and ASP movement are treated, which are then reflected as higher or lower implied system demand. By keeping the value tied to MRI system revenue and cross-checking it with utilization and procurement signals rather than only headline capex plans, the estimate stays more repeatable year to year, a modeling choice applied by Mordor Intelligence.
Key Questions Answered in the Report
How big is the Australia Magnetic Resonance Imaging Market?
The Australia Magnetic Resonance Imaging Market size is expected to reach USD 115.98 million in 2026 and grow at a CAGR of 5.22% to reach USD 149.59 million by 2031.
Which MRI architecture holds the largest share in Australia?
Closed-bore scanners account for 75.25% of units and remain the dominant architecture.
Who are the key players in Australia Magnetic Resonance Imaging Market?
Siemens AG, Canon Medical Systems, GE Healthcare, Fujifilm Holding Corporatio and Koninklijke Philips N.V. are the major companies operating in the Australia Magnetic Resonance Imaging Market.
Why are open MRI systems gaining interest?
Open designs improve patient comfort and are growing at a 6.02% CAGR, aided by AI reconstruction that lessens image-quality trade-offs.