
Market Overview
| Study Period | 2020 - 2031 |
|---|---|
| Forecast Data Period | 2026 - 2031 |
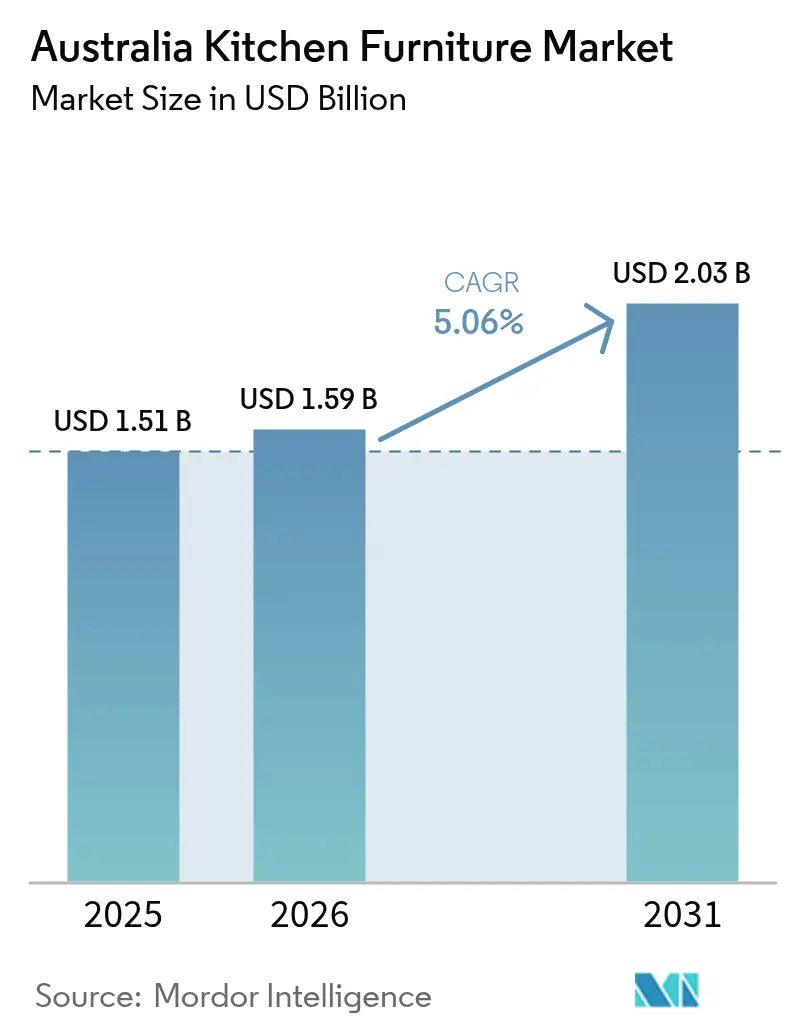
| Base Year Market Size (2025) | USD 1.51 Billion |
| Market Size (2026) | USD 1.59 Billion |
| Market Size (2031) | USD 2.03 Billion |
| Growth Rate (2026 - 2031) | 5.06% CAGR |
| Market Concentration | Medium |
Major Players *Disclaimer: Major Players sorted in no particular order Image © Mordor Intelligence. Reuse requires attribution under CC BY 4.0. | |
Australia Kitchen Furniture Market Analysis by Mordor Intelligence
The Australia kitchen furniture market size in 2026 is estimated at USD 1.59 billion, growing from 2025 value of USD 1.51 billion with 2031 projections showing USD 2.03 billion, growing at 5.06% CAGR over 2026-2031. Sustained residential renovation activity, lifestyle shifts favouring open-plan layouts, and accelerating technology adoption anchor expansion. Homeowners continue to prioritize kitchen upgrades for property value retention, while rising interstate migration drives new housing demand in growth corridors. Manufacturers differentiate through modular formats, smart-ready storage, and eco-friendly materials that address evolving consumer expectations. Competitive intensity remains moderate as global retailers, local specialists, and direct-to-consumer brands pursue omnichannel strategies to reach urban and regional buyers.
Key Report Takeaways
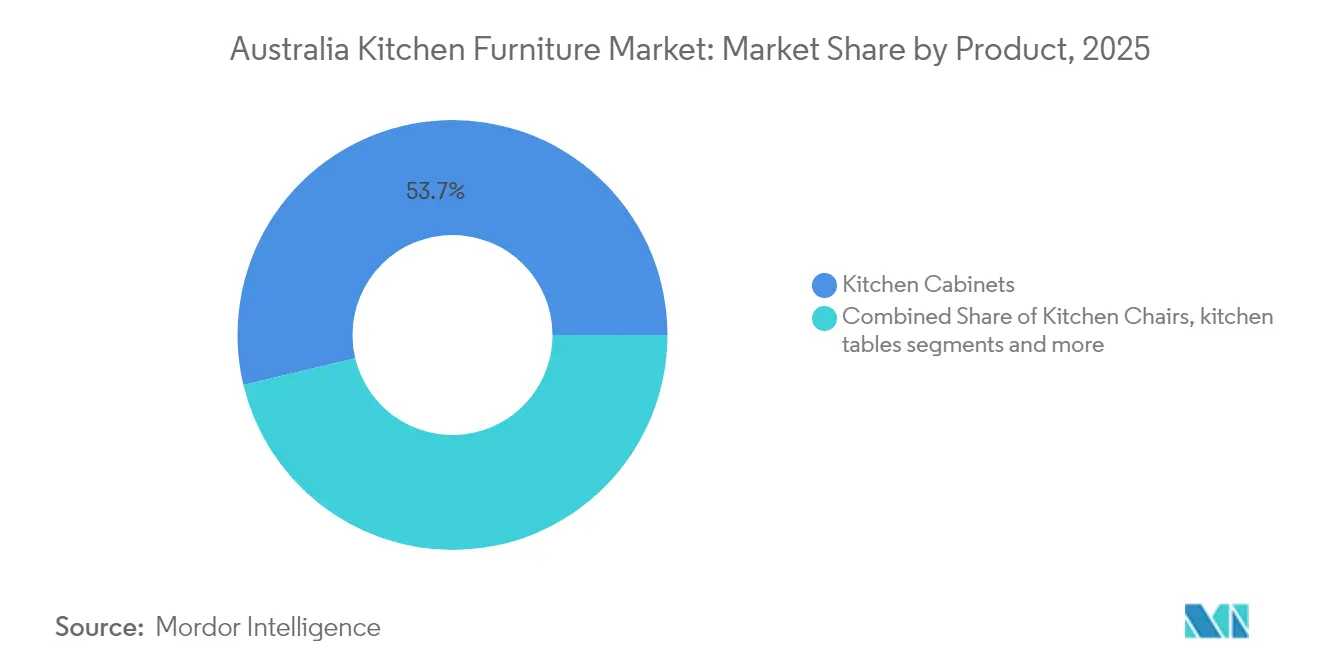
- By product, kitchen cabinets held 53.74% of the Australia kitchen furniture market share in 2025, while accessories such as trolleys and pantry shelves are forecast to expand at a 5.58% CAGR through 2031.
- By material, wood retained a 60.62% share of the Australia kitchen furniture market size in 2025, whereas metal components are advancing at a 6.52% CAGR to 2031.
- By end-user, residential applications captured 76.05% of the Australia kitchen furniture market size in 2025, whereas commercial installations are projected to grow at a 6.63% CAGR through 2031.
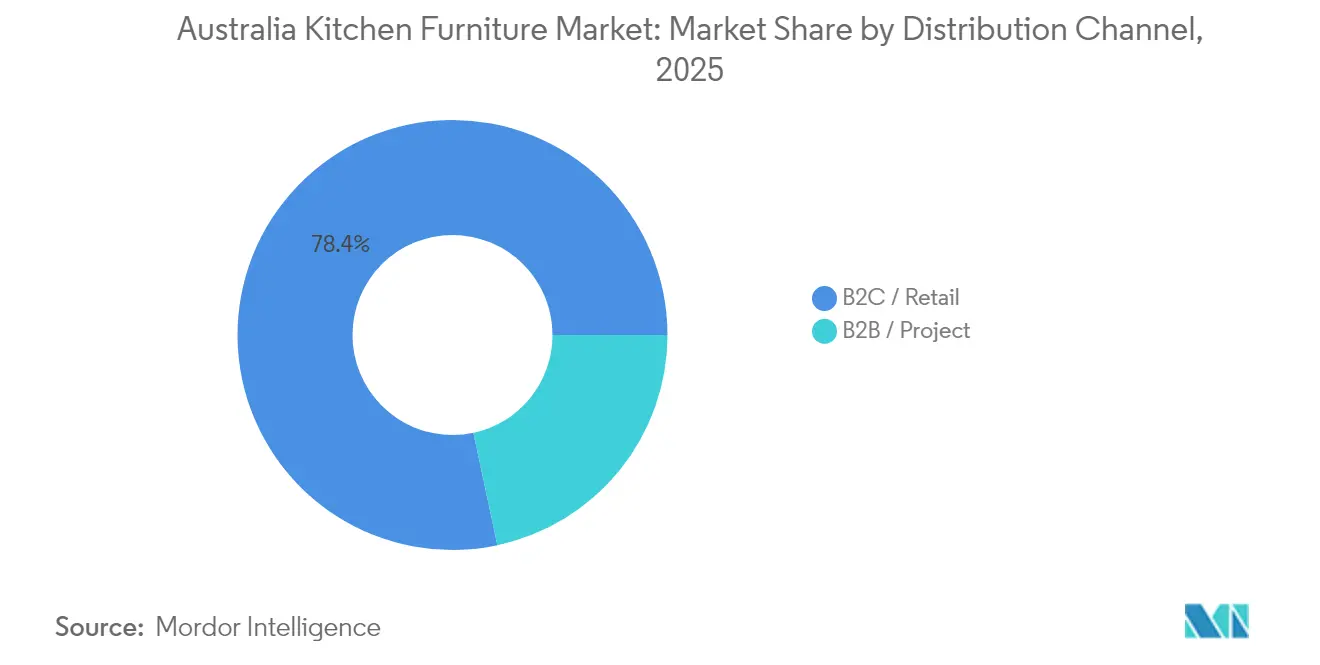
- By distribution channel, B2C retail controlled 78.35% of value in 2025, while B2B project sales are recording a 6.41% CAGR as builders embed premium kitchen solutions in new dwellings.
- By region, New South Wales led with 34.18% revenue share in 2025; Queensland is the fastest-growing state at 6.14% CAGR to 2031.
Note: Market size and forecast figures in this report are generated using Mordor Intelligence’s proprietary estimation framework, updated with the latest available data and insights as of 2026.
Australia Kitchen Furniture Market Trends and Insights
Drivers Impact Analysis*
| Driver | (~) % Impact on CAGR Forecast | Geographic Relevance | Impact Timeline |
|---|---|---|---|
| Rising residential renovation spending | +1.2% | National, concentrated in NSW and Victoria | Medium term (2-4 years) |
| Open-plan living boosting modular demand | +0.8% | Urban centers nationwide | Long term (≥ 4 years) |
| Expanding online furniture retail | +0.6% | National, stronger in regional areas | Short term (≤ 2 years) |
| Adoption of smart kitchen technologies | +0.5% | Metropolitan areas, spreading to regional centers | Medium term (2-4 years) |
| Energy-efficient home incentives | +0.4% | Victoria leading, widening to other states | Medium term (2-4 years) |
| Circular-economy marketplaces emergence | +0.3% | Major metropolitan areas | Long term (≥ 4 years) |
| Source: Mordor Intelligence | |||
Rising Residential Renovation Spending and Kitchen Upgrades
Average kitchen renovation budgets climbed to AUD 35,000–45,000 in 2024 as millennials entered peak ownership years and baby boomers downsized into lifestyle-oriented residences[1]Envision Kitchens, “Kitchen Renovation Costs and Trends,” envisionkitchens.com.au. Low interest rates and targeted state incentives maintained momentum, supporting premium cabinetry and multifunctional furniture uptake. Brisbane registered the highest aggregate renovation spend, while Geelong posted leading per-capita outlays, demonstrating demand breadth beyond traditionally dominant metros. Although construction-material inflation now moderates discretionary budgets, value-engineered modular solutions help sustain replacement cycles. Manufacturers offering rapid installation and financing packages capture share in this budget-sensitive environment.
Growing Prevalence of Open-Plan Living Driving Demand for Modular Kitchen Cabinets
More than two-thirds of newly built dwellings incorporated open-plan layouts in 2024, positioning the kitchen as a social hub contiguous with living zones. This architectural preference elevates demand for modular cabinets that double as room dividers and visual focal points. Standardized unit sizing simplifies logistics while color and hardware customization maintain design flexibility. Apartment developers in Sydney and Melbourne increasingly specify corner pull-outs, tall pantries, and breakfast-bar modules to maximize usable area. The trend supports premium pricing for slim-profile doors, concealed hinges, and integrated LED lighting that harmonize with adjacent décor.
Increasing Online Furniture Retail Penetration Expanding Customer Reach
Digital channels captured roughly 18% of national furniture sales in 2024, with kitchen categories outpacing broader sector growth[2]Kitchen Warehouse, “E-commerce Growth in Australian Furniture Market,” kitchenwarehouse.com.au. Augmented-reality planning tools and virtual consultations mitigate the tactile limitations of e-commerce. Regional households benefit most, gaining access to premium ranges previously limited to metropolitan showrooms. Direct-to-consumer platforms compress supply chains, lowering acquisition costs for value-conscious renovators. Nonetheless, showroom experiences remain critical for material selection and hardware testing, prompting retailers to integrate click-and-collect, live video walkthroughs, and pop-up studios into omnichannel models.
Growing Adoption of Smart Kitchen Technologies
Roughly 50% of Australian households owned at least one smart kitchen device by end-2024, up from 36% in 2023[3]Smart Kitchen Technology Report, “Smart Kitchen Adoption in Australia,” smartkitchentech.com.au. Voice-activated drawers, sensor-lit shelves, and IoT-enabled hinges migrate from luxury to mainstream segments. Cabinet designers now allocate dedicated charging nooks and cable management channels as baseline features. Younger demographics prioritize app-based inventory monitoring that reduces food waste, while aging populations welcome automated lift-system shelving for ergonomic access. Component suppliers coordinating with appliance brands accelerate ecosystem compatibility, reinforcing replacement demand for technology-ready furniture.
Restraints Impact Analysis*
| Restraint | (~) % Impact on CAGR Forecast | Geographic Relevance | Impact Timeline |
|---|---|---|---|
| Elevated timber and raw material costs | −0.7% | Nationwide, acute need for local producers | Short term (≤ 2 years) |
| Intensifying import competition | −0.6% | National, strongest in price-sensitive segments | Medium term (2-4 years) |
| Skilled labor shortages in cabinetmaking | −0.5% | Nationwide, severe in regional areas | Medium term (2-4 years) |
| Building-code variability across states | −0.4% | National, state-specific rules | Long term (≥ 4 years) |
| Source: Mordor Intelligence | |||
Elevated Timber and Raw-Material Costs Squeezing Manufacturer Margins
Construction-grade timber prices climbed 22% year-over-year in 2024 amid supply bottlenecks and export demand, pressuring local cabinetmakers[4]Housing Industry Association, “Skills Shortage Report,” hia.com.au. Hardware, adhesives, and veneer costs followed upward, narrowing gross margins across small and mid-sized workshops. Some producers shifted toward engineered panels and hybrid composites to reduce exposure to volatile lumber prices. Larger manufacturers leveraged bulk procurement and alternative sourcing from New Zealand plantations to stabilize inputs. Retailers introduced transparent price-adjustment clauses, yet consumer pushback intensified, prompting value-tier brands to emphasize entry-level laminate assortments.
Intensifying Import Competition from Flat-Pack Asian Suppliers
Asian exporters expanded shipments of ready-to-assemble ranges priced 15–20% below domestic equivalents in 2024. Aggressive factory-gate pricing, container-level consolidation, and localized after-sales networks erode market share for local players targeting cost-conscious consumers. Domestic brands counter with made-to-measure services, shorter delivery windows, and sustainability certifications. Government deliberations on anti-dumping duties remain ongoing but have yet to yield protective tariffs. Price competition compresses retailer margins, especially within the lower mid-range, where differentiation rests largely on finish options and warranty length.
*Our forecasts treat driver/restraint impacts as directional, not additive. The impact forecasts reflect baseline growth, mix effects, and variable interactions.
Segment Analysis
By Product: Cabinets Maintain Primacy While Accessories Accelerate
Kitchen cabinets captured 53.74% of value in 2025, generating the largest slice of the Australian kitchen furniture market share. High ticket sizes and long replacement cycles secure their role as cornerstone investments in both new builds and renovations. Core demand clusters around full-height pantry units, island modules with integrated seating, and soft-close drawer systems that elevate user experience. Premium plywood carcasses and UV-cured finishes support durability expectations among affluent homeowners.
Accessories encompassing trolleys, carts, and modular pantry shelves posted the fastest growth at 5.58% CAGR, reflecting surging apartment development in Sydney, Melbourne, and Brisbane. These mobile or plug-and-play solutions offset space constraints and suit rental properties where permanent installations face restrictions. Manufacturers focus on slim steel frames, foldable worktops, and locking casters that allow flexible reconfiguration. The segment’s lower price points encourage impulse upgrades and repeat purchases, reinforcing recurring revenue streams. Smart sensors measuring inventory levels or reminding users of expiry dates illustrate how accessories increasingly integrate technology to boost perceived value.


By Material: Wood Dominance Faces Metal-Driven Innovation
Wood continued to command 60.62% market share in 2025 within the Australia kitchen furniture market. Consumers value its aesthetic warmth and perceived craftsmanship, especially in suburban detached homes where natural finishes complement open-plan interiors. Solid hardwood doors, thermally modified veneers, and water-borne sealants extend lifespan and meet sustainability expectations. Royal-ite oak and Tasmanian blackwood lines sell robustly in premium brackets despite cost pressures.
Metal components are rising at a 6.52% CAGR as designers seek slim profiles, industrial aesthetics, and compatibility with smart hardware. Powder-coated aluminum frames facilitate handle-less fronts and concealed hinges, satisfying contemporary tastes. Stainless-steel drawer boxes paired with timber fronts create hybrid constructions balancing durability and visual appeal. Increasingly stringent fire safety standards in high-density dwellings further boost demand for non-combustible substrates, positioning metal as a pragmatic alternative. Composite boards and high-pressure laminates serve cost-focused segments, yet they seldom displace wood’s entrenched cultural appeal.
By End-User: Residential Reigns While Commercial Momentum Builds
Residential buyers generated 76.05% of 2025 revenues, reflecting lifestyle-driven cycles that hinge on property appreciation and personal amenity priorities. Detached houses average 15- to 20-year replacement intervals, while apartment refurbishments trend closer to 10 years due to evolving tenancy and design fashions. Smart-ready cabinetry, integrated charging hubs, and antimicrobial surfaces gain traction among urban professionals who favor convenience and health safeguards.
Commercial installations, spanning restaurants, hotels, offices, and learning facilities, are projected to log a 6.63% CAGR to 2031. The hospitality rebound post-pandemic spurs kitchen redesigns emphasizing speed, hygiene, and customer-visible preparation zones. Co-working providers specify barista-style kitchenettes that double as collaboration spaces, elevating functional requirements. Commercial buyers demand stainless-steel frames, heavy-duty runners, and high-wear laminates built for daily intensive use. Suppliers tailor maintenance contracts and rapid replacement guarantees to meet stringent uptime expectations.
By Distribution Channel: Retail Dominance Shifts Toward Project-Led Sales
B2C retail outlets—including home centers, specialty showrooms, and pure-play e-commerce—controlled 78.35% of spend in 2025. DIY-inclined households gravitate toward flat-pack systems that feature intuitive assembly instructions and online configuration tools. Regional branches of hardware chains broaden reach, while store-within-store concepts provide premium brand exposure in big-box formats.
Project-based B2B channels are forecast to grow 6.41% annually as builders pre-select complete kitchen packages for off-the-plan developments. Volume contracts yield cost efficiencies, favoring suppliers able to guarantee consistent quality across hundreds of units. Turnkey renovation services bundle design, demolition, supply, and installation, appealing to time-pressed homeowners. Showrooms increasingly host dedicated trade desks, facilitating specification alignment and after-sales warranty processing. Yet, project pipelines remain tied to macro construction cycles, necessitating risk mitigation through diversified order books.
Geography Analysis
New South Wales retained leadership with 34.18% of the national value in 2025, underlined by Sydney’s high per-capita disposable income and a seasoned renovation workforce. Mature stock drives replacement demand for upgraded storage, soft-close hardware, and energy-efficient lighting. Proximity to Port Botany streamlines import flows, enabling competitive pricing for international brands. Supply-side efficiencies reinforce consumer choice breadth, from budget flat-packs to artisanal bespoke suites.
Queensland’s 6.14% CAGR underscores demographic influx and lifestyle-centric building activity, particularly in coastal enclaves. Developers emphasize breezy layouts with oversized islands and outdoor servery hatches to support entertainment. State-specific cyclone and humidity considerations spur uptake of galvanized steel substructures and moisture-resistant boards. Government subsidy programs for energy-positive homes also catalyze demand for low-VOC finishes and solar-compatible lighting strips.
Victoria, Western Australia, and South Australia collectively contribute roughly one-third of national revenues, each leveraging localized production ecosystems and skilled joinery talent. Perth’s distance from east-coast suppliers motivates vertically integrated manufacturers who capture design-to-install value. Tasmania and the Northern Territory remain niche but display rising appetite for direct-to-consumer shipments that bypass limited retail footprints. State-level building-code divergence necessitates adaptive product lines, further highlighting the regionalized nature of the Australia kitchen furniture market.
Regulatory Landscape
Kitchen furniture suppliers in Australia work within product safety and consumer protection requirements administered by the ACCC under the Australian Consumer Law (ACL). A key recent change is the Consumer Goods (Toppling Furniture) Information Standard 2024, which commenced on 4 May 2025 and requires warning labels, point-of-sale warnings, and anchoring information for specified storage furniture (for example, chests of drawers, wardrobes, and bookcases 686 mm or higher). This has implications for packaging, merchandising, and installation guidance across retail and project channels.
On the trade side, Australian Border Force guidance notes that, from 1 July 2024, customs duties for numerous tariff headings including various furniture types were reduced to Free. This lowers landed-cost friction for imports and intensifies price competition for flat-pack and ready-to-assemble categories. For built-in cabinetry, technical expectations are shaped by established Australian Standards such as AS 4386:2018 for design, manufacture, and installation of cabinetry, and non-compliance with ACL-linked safety obligations carries severe corporate penalty ceilings (up to AUD 50 million or 30% of adjusted turnover during the breach period).
Value Chain Analysis
The value chain starts with raw materials (timber and engineered panels, laminates, metal frames and fittings, adhesives, and finishes), then moves into component and hardware supply (hinges, runners, handles, organizers, and lighting). Fabrication occurs through joinery workshops and industrial cabinetmakers that use CNC routing, drilling, and finishing lines. From there, design and specification flow through kitchen designers, builders, and renovation contractors, while installation services remain a critical last-mile step for built-in products. B2C retail (including online) and B2B project sales then deliver finished cabinetry and complementary kitchen furniture to residential and commercial end users.
Distribution and sourcing are heavily influenced by import exposure and procurement requirements. A March 2026 GTAIC analysis highlighted high import concentration risk for wooden kitchen furniture, with China, Italy, and Vietnam accounting for over 96% of imports. This elevates supplier lead-time, freight, and currency risk for distributors and retailers. For suppliers serving public-sector or government-aligned projects, the Australian Federal Government Environmentally Sustainable Procurement Policy (effective July 2025) increases the importance of traceability, waste management, and sustainable material selection within sourcing and manufacturing, shaping product documentation and supplier qualification processes.
Competitive Landscape
The Australia kitchen furniture market exhibits moderate fragmentation. IKEA combines global sourcing scale with localized planning studios to target value-oriented consumers, supported by a three-year delivery alliance with Australia Post that covers remote regions. Bunnings’ Kaboodle brand dominates DIY upgrades, leveraging widespread store coverage and intuitive online configurators. Freedom Kitchens positions itself at the premium end, offering design consultation services and extended warranties to differentiate from mass retailers.
Technology serves as a key competitive battleground. Modulr’s ultrasonic WoodWelding® technique delivers cabinets 30% stronger than conventional joinery while reducing assembly time. Starlight Kitchens Group deploys CNC automation to cut lead times to under two weeks for custom orders. Sustainability credentials are equally instrumental: IKEA’s Adelaide outlet achieved renewable-energy-positive status in 2025, showcasing energy autonomy through rooftop PV and battery storage.
Circular-economy initiatives gain prominence as companies pilot refurbished-component buy-back schemes, appealing to eco-conscious consumers and offsetting raw-material inflation. Domestic manufacturers capitalize on made-in-Australia branding, accentuating shorter delivery windows and compliance alignment. Overall, players capable of marrying manufacturing efficiency with memorable customer experiences and omnichannel convenience retain a competitive edge in the Australian kitchen furniture market.
Australia Kitchen Furniture Industry Leaders
IKEA Group
Kaboodle Kitchen (Bunnings Group Limited)
Freedom Kitchens (Steinhoff Asia-Pacific Group)
Kinsman Kitchens (Fletcher Building Ltd.)
Harvey Norman Holdings Ltd.
- *Disclaimer: Major Players sorted in no particular order


Market Opportunities and Future Outlook
Manufacturing automation and connected production workflows are increasingly used to address skilled labor shortages in cabinetmaking and the need for faster, repeatable custom output. In March 2026, SCM Australia completed an automated storage system and four nesting centers installation at eKitchens in Perth. In June 2026, Stirling Group launched the ProConnect Machinery platform to integrate office software, tool measurement, and CNC machinery for timber manufacturers. These moves create opportunities for cabinetry and kitchen furniture suppliers that can standardize modular designs while maintaining customization through software-to-machine integration, improving lead times for both renovation and project builders.
Local manufacturing entry and supply-chain resilience create additional whitespace, particularly where import concentration is a documented risk. In March 2026, JAT Holdings commenced local cabinetry manufacturing in Perth under the Form Cabinetry brand, focusing on residential kitchens and wardrobes. This adds competitive pressure on incumbents and expands the pool of locally produced options for builders and renovators. At the same time, customs duties removed to Free for numerous furniture tariff lines as of 1 July 2024 increases price-based competition from imports, which raises the premium on differentiated offerings such as smart-ready storage, rapid-install modular systems, and sustainability documentation aligned with procurement requirements and consumer preferences.
Recent Industry Developments
- May 2026: Freedom Australia announced the official launch of Home Furniture Group, a new entity bringing together the Freedom and Amart furniture brands. The combined structure strengthens national retail scale and can concentrate buying, merchandising, and omnichannel execution, influencing how kitchen furniture ranges are curated and priced across Australia.
- April 2026: Freedom Kitchens opened two new showrooms in Melbourne. The added physical footprint supports higher-consideration kitchen planning and design consultations, reinforcing the role of experience-led retail alongside online configuration tools.
- April 2025: IKEA announced its Adelaide store will operate as the nation’s first renewable-energy-positive retail site. The initiative signals continued investment in lower-impact retail operations and logistics enablement, raising competitive emphasis on sustainability credentials across large-format kitchen furniture retailers.


Research Methodology Framework and Report Scope
Market Definition and Coverage
For this methodology, the Australia kitchen furniture market covers demand and sales value for kitchen furniture purchased for residential and commercial kitchens, where the buying decision is tied to kitchen fit-outs, upgrades, or replacements.
Scope exclusions: We exclude loose appliances and white goods, general living room storage, and standalone decor items that are not purchased as kitchen furniture.
Segmentation Overview
- By Product
- Kitchen Cabinets
- Kitchen Chairs
- Kitchen Tables
- Other Products (kitchen trolley, cart, pantry shelves, etc.)
- By Material
- Wood
- Metal
- Plastic and Polymer
- Other Materials
- By End-User
- Residential
- Commercial
- By Distribution Channel
- B2C / Retail
- Home Centers
- Specialty Furniture Stores
- Online
- Other Distribution Channels
- B2B / Project
- B2C / Retail
- By Region
- New South Wales
- Victoria
- Queensland
- Western Australia
- South Australia
- Tasmania
- Australian Capital Territory & Northern Territory
Data Sources, Market Sizing, and Validation
Desk Research
Desk research helped us set the market boundaries and build a clean demand story for Australia, before any math was done. We reviewed public housing and construction series, and we matched them with renovation signals to understand how often kitchens are upgraded and how that changes yearly demand.
Key inputs came from non-paywalled sources such as the Australian Bureau of Statistics for dwelling activity and household trends, government building approvals series, and trade and customs statistics for import patterns of furniture and related items. We also used sources such as industry association websites and technical publications on engineered wood and panel products, plus company annual reports and investor decks to understand channel shifts and pricing direction. In a few cases, paid subscriptions for company financials and an import and export shipment-level database were used to cross-check supplier exposure and trade mix. The sources listed here are illustrative, and many other public documents and datasets were also used for data collection, validation, and clarification.
Primary Interviews and Surveys
Primary work focused on validating what desk sources cannot clearly show, such as mix shifts between project sales and retail, typical kitchen replacement cycles, and recent changes in average order value. We spoke with a spread of stakeholders, including manufacturers, distributors, retail and online channel participants, installers, and project-facing respondents, so the model reflects real purchasing behavior across Australia.
Distribution of primary research fieldwork respondents
| Company type | Respondent position | Region |
|---|---|---|
| Top tier: 39% | CXOs: 15% | |
| Mid tier: 44% | Functional/Unit leaders: 38% | |
| Smaller Players: 17% | Managers: 47% |
Market-Sizing & Forecasting
Sizing used top-down and bottom-up together, starting from Australia-specific housing activity and renovation demand pools, which were then translated into kitchen furniture spend using adoption and replacement-rate logic. Once that total was formed, selective bottom-up checks were run by rolling up a sample of supplier and channel revenue, and then adjusting for coverage gaps and double counting.
A few variables that mattered in the model included new dwelling completions, residential renovation frequency, the share of kitchens moving to modular formats, average kitchen fit-out ticket size, the split between project work and retail purchases, and the import share for key furniture categories. Where a variable was not directly observable, we filled the gap using interview ranges and simple proxy series (for example, construction activity and trade data), and then kept the assumption consistent across years so the trend stays explainable.
Forecasts were built using scenario analysis, because demand is sensitive to construction cycles, household confidence, and renovation timing. We applied base, softer, and stronger cases, and then narrowed the final path after primary respondents confirmed likely pricing and volume direction over the outlook period.
Data Validation & Update Cycle
Totals were checked against independent signals that should move in the same direction, such as construction approvals, renovation spending indicators, and furniture-related import trends, and any large mismatch was reworked until the driver logic explained it. When outliers showed up, the assumptions behind pricing, channel mix, or replacement rates were reviewed, and clarifying calls were done if the variance could not be explained from public information.
Before sign-off, the model goes through multi-step analyst review so the inputs, calculations, and year-to-year movements are easy to trace. Reports are refreshed annually, and interim updates are made when major events materially change demand, trade flows, or pricing. Right before delivery, a final pass is completed so clients receive the most current view available.
Mordor Intelligence's Australia Kitchen Furniture Market Size Compared With Other Published Estimates
Published market values for Australia kitchen furniture can differ even when the topic name looks the same, since firms may count different product boundaries, treat project sales differently, and convert local pricing into USD using different timing. The table below puts three numbers side by side so the practical reasons behind the spread are easier to see.
The biggest gaps usually come from whether kitchen fit-out components are counted as furniture, how imports are mapped to local consumption, and whether the estimate leans into an aggressive or conservative renovation cycle in the forecast base year. Currency conversion timing also matters, because a small change in AUD to USD can shift the stated market size even if local spending is similar.
Benchmark comparison
| Source | Market Size | Gaps in Research Methodology |
|---|---|---|
| Mordor Intelligence | USD 1.51 B (2025) | |
| Regional Consultancy A | USD 1.67 B (2026) | Uses a later year and appears to blend kitchen furniture with a wider fit-out basket, which can pull in adjacent categories and lift the total. |
| Industry Publisher B | USD 1.12 B (2025) | Likely restricts scope to cabinets only or to a narrower retail channel view, and may not fully account for project-led demand and imported supply linked to kitchen upgrades. |
The table shows a clear split between a broader fit-out style view and a narrower cabinet-only style view, and in Mordor Intelligence's model the total is built around kitchen furniture purchases tied to kitchen upgrades and fit-outs, without pulling in unrelated appliances or general home storage. With drivers that are easy to track each year, such as housing activity, renovation cadence, and channel mix, the output stays transparent and repeatable when assumptions need to be refreshed.


Key Questions Answered in the Report
What is the current value of the Australian kitchen furniture market?
The Australian kitchen furniture market size reached USD 1.59 billion in 2026 and is projected to grow to USD 2.03 billion by 2031.
Which product segment leads sales?
Kitchen cabinets lead, holding 53.74% of the national value in 2025.
Which state shows the fastest growth?
Queensland is forecast to expand at a 6.14% CAGR through 2031 thanks to migration-driven housing demand.
How significant is online retail for kitchen furniture?
Digital channels already capture around 18% of sales and continue to grow as virtual planning tools improve.
What materials are gaining popularity?
Metal components are the fastest-growing material category, registering a 6.52% CAGR due to durability and smart-system compatibility.
How fragmented is the competitive landscape?
The market is moderately concentrated with the top five players holding just under 40% share, giving a concentration score of 6.
Page last updated on:






