
Market Overview
| Study Period | 2020 - 2031 |
|---|---|
| Forecast Data Period | 2026 - 2031 |
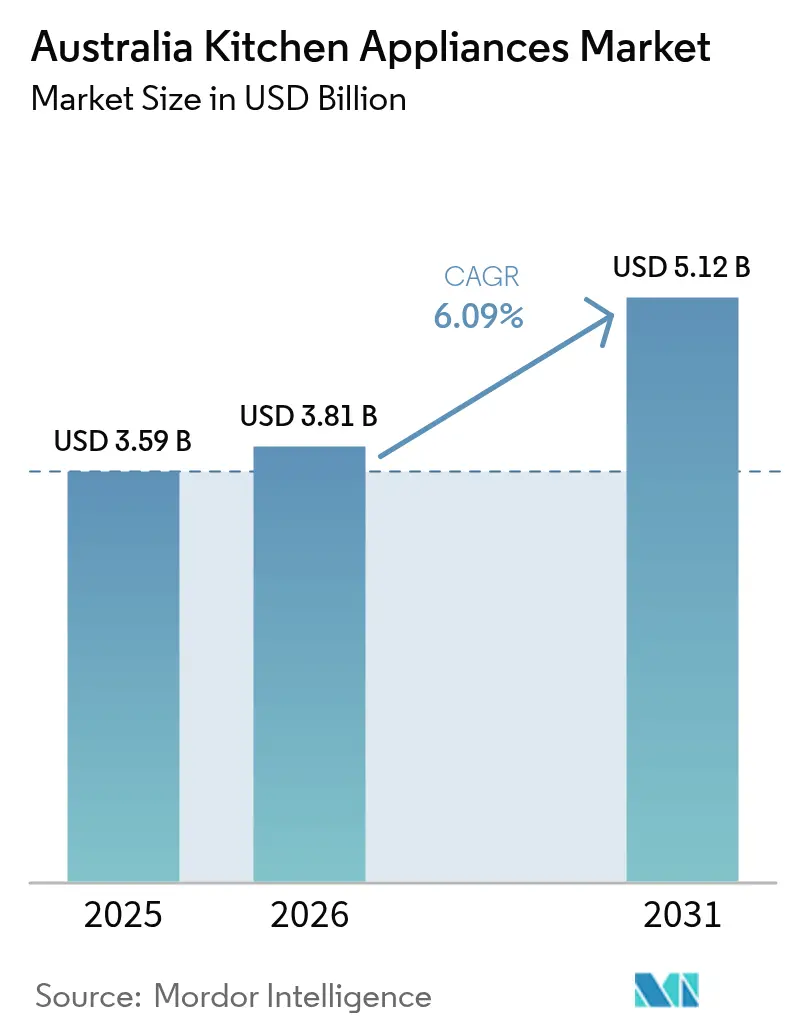
| Base Year Market Size (2025) | USD 3.59 Billion |
| Market Size (2026) | USD 3.81 Billion |
| Market Size (2031) | USD 5.12 Billion |
| Growth Rate (2026 - 2031) | 6.09 % |
| Market Concentration | Medium |
Major Players *Disclaimer: Major Players sorted in no particular order Image © Mordor Intelligence. Reuse requires attribution under CC BY 4.0. | |
Australia Kitchen Appliances Market Analysis by Mordor Intelligence
The Australia Kitchen Appliances market size is expected to grow from USD 3.59 billion in 2025 to USD 3.81 billion in 2026 and is forecast to reach USD 5.12 billion by 2031 at 6.09% CAGR over 2026-2031. Growth momentum stems from electrification mandates, renovation-driven replacement cycles, and wider uptake of smart-home ecosystems that encourage premium appliance upgrades. State rebate schemes create immediate price parity between standard and energy-efficient models, while Buy Now Pay Later (BNPL) services lift ticket sizes and reduce friction for large online purchases. Logistics bottlenecks and higher compliance costs under Australia’s Circular Economy Framework pressure margins yet nudge brands toward local assembly and design-for-recycling programs that resonate with sustainability-focused consumers. Manufacturers able to integrate AI, energy management, and open-standards connectivity capture disproportionate value as households and hospitality venues future-proof kitchens for cost-of-living and climate resilience.
Key Report Takeaways
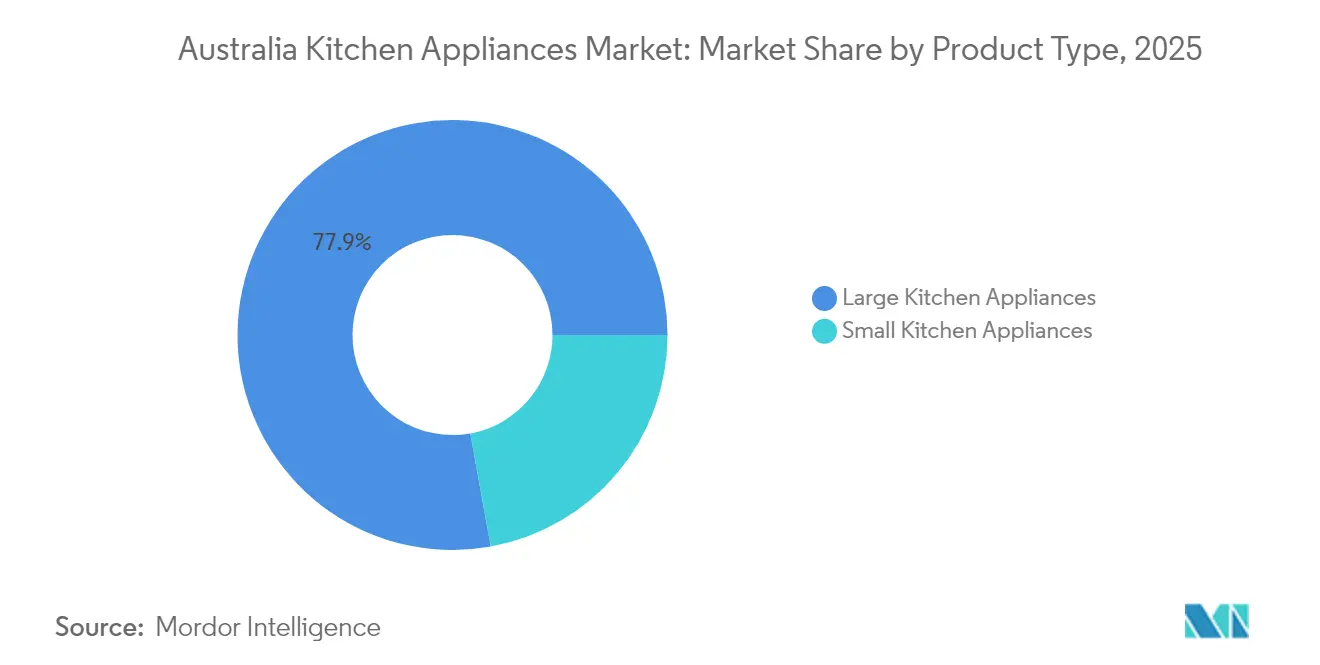
- By product type, large kitchen appliances led with 77.85% revenue share in 2025; small appliances are projected to expand at a 6.61% CAGR through 2031.
- By end user, the residential segment held 72.75% of the Australia Kitchen Appliances market share in 2025, while the commercial segment is advancing at a 5.28% CAGR to 2031.
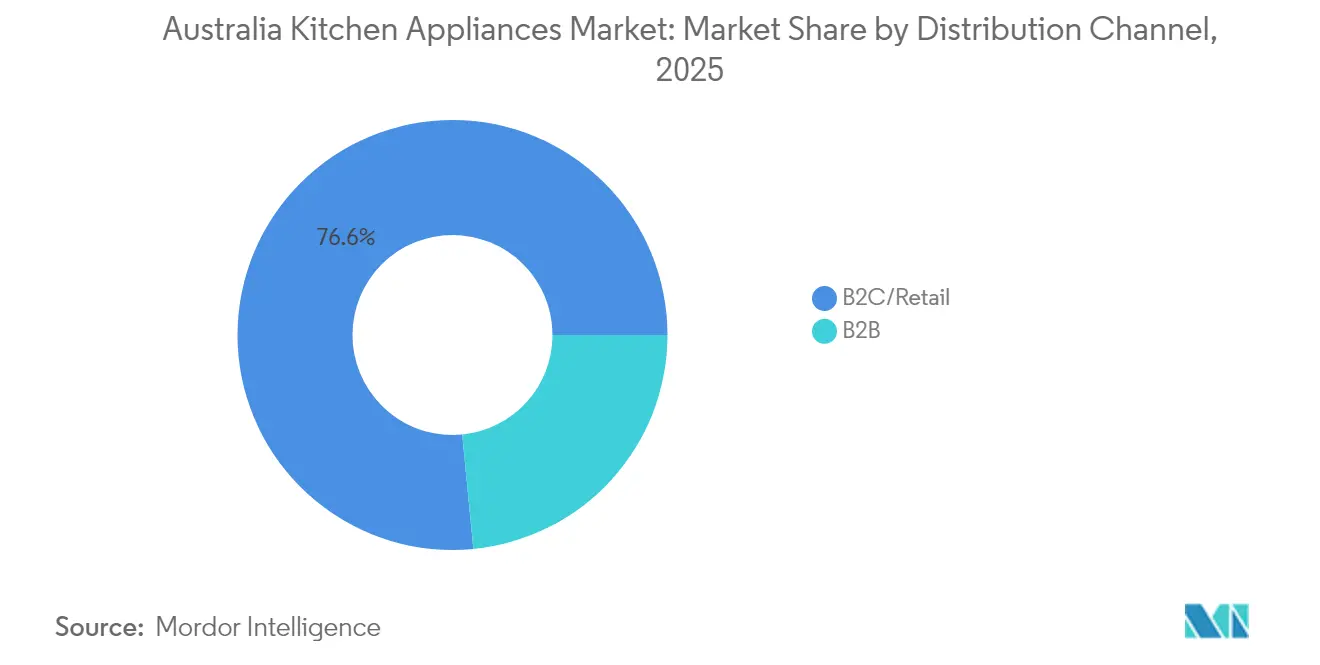
- By distribution channel, B2C/retail controlled 76.55% revenue share in 2025, and the online sub-channel is expected to post a 7.42% CAGR during 2026-2031.
- By geography, New South Wales accounted for 31.05% of 2025 sales; Queensland is forecast to grow the fastest at 6.88% CAGR to 2031.
Note: Market size and forecast figures in this report are generated using Mordor Intelligence’s proprietary estimation framework, updated with the latest available data and insights as of 2026.
Australia Kitchen Appliances Market Trends and Insights
Drivers Impact Analysis*
| Driver | (~) % Impact on CAGR Forecast | Geographic Relevance | Impact Timeline |
|---|---|---|---|
| Energy-efficient appliance rebates & minimum-star upgrades | +1.2% | National, with strongest uptake in Victoria, Queensland, South Australia | Short term (≤ 2 years) |
| Rapid post-pandemic renovation boom in detached housing | +1.8% | National, concentrated in NSW coastal areas, Victoria inner-city regions | Medium term (2-4 years) |
| Hospitality sector's premiumisation of back-of-house kitchens | +0.7% | National, with premium growth in Sydney, Melbourne, Brisbane CBDs | Medium term (2-4 years) |
| Surge in BNPL adoption lifting ticket sizes for big-ticket whitegoods | +1.1% | National, with higher penetration in urban centers | Short term (≤ 2 years) |
| Electrification incentives replacing gas cooktops in new builds | +0.9% | Victoria, with spillover to ACT and Tasmania | Long term (≥ 4 years) |
| Edge-AI food-recognition modules enabling automated cooking | +0.5% | National, early adoption in high-income metropolitan areas | Long term (≥ 4 years) |
| Source: Mordor Intelligence | |||
Energy-Efficient Appliance Rebates Drive Premium Segment Adoption
Government support programs such as Queensland’s Climate Smart Energy Savers and Victoria’s Energy Upgrades lower upfront costs and encourage households to select higher-star models that deliver ongoing energy savings[1]Source: Queensland Government, “Climate Smart Energy Savers Scheme Update 2025,” qld.gov.au. Minimum performance thresholds under the Greenhouse and Energy Minimum Standards Act filter out inefficient stock, pushing brands toward smart induction cooktops, inverter refrigerators, and connected dishwashers that qualify for rebates[2]Source: Victorian Energy Upgrades, “Household Rebate Schedule 2025,” energysaver.vic.gov.au. Retailers report rising attachment rates for Wi-Fi-enabled models because connected dashboards help consumers monitor usage and validate rebate applications. Manufacturers with in-house R&D and local compliance teams gain a head start in certifying new SKUs, capturing an outsized share of the Australian kitchen Appliances market. Rapid rebate uptake compresses payback periods to less than two years for many high-efficiency products, reinforcing the premiumization flywheel.
Post-Pandemic Renovation Boom Sustains Appliance Replacement Cycles
Renovation spending rose to 40% of residential construction value in 2023-24, shifting capital from new builds to kitchen refresh projects that normally involve a full appliance suite upgrade. Homeowners leverage prolonged work-from-home periods and equity gains to finance upscale cooktops, ovens, and French-door refrigerators. Victoria’s one-for-one replacement rate of 12.6% of new-build spend underscores how legacy housing stock spurs structural demand for electrified appliances compatible with induction-ready cabinetry. Renovation projects often bundle flooring, benchtops, and appliances, raising average transaction values at specialty retailers. The surge in detached-home makeovers also supports the growth of installation and haul-away services, cementing sticky relationships between brands, trade contractors, and end users.
Hospitality Premiumisation Elevates Commercial Kitchen Standards
Restaurants aim to cut labor costs up to 25% by 2026 through robotics, AI scheduling, and sensor-equipped combi ovens that auto-calibrate recipes. Consumer preference for locally sourced menus (78%) drives demand for precision storage and preparation equipment that preserves provenance and reduces spoilage. Plant-based experimentation nearing USD 9 billion by 2030 requires multi-mode cookers able to handle alternative proteins. QR-code ordering adopted by two-thirds of casual venues pushes kitchens to integrate software-defined appliances for real-time inventory sync. Food-waste reduction goals influence purchasing toward vacuum sealers and blast chillers that extend shelf life. Suppliers delivering modular, energy-efficient, and IoT-ready gear secure premium contracts and long-term maintenance revenue across major CBDs.
BNPL Integration Transforms Large-Appliance Purchase Behavior
BNPL accounted for 40% of consumer payments by value in 2024, turning deferred payments into a mainstream financing method for USD 1,000-plus refrigerators, ranges, and dishwashers. No-surcharge rules mean retailers absorb fees but recoup value through higher cart sizes and lower abandonment rates. Online appliance turnover reached USD 4.52 billion in March 2025—11.6% of total retail—highlighting BNPL’s direct link to e-commerce gains[3]Source: Australian Bureau of Statistics, “Online Retail Sales March 2025,” abs.gov.au. As PayTo rails mature, merchants anticipate lower transaction costs that further widen BNPL’s appeal. Brands run exclusive web promotions featuring six- or twelve-month interest-free plans, steering price-sensitive households toward mid and premium tiers of the Australia Kitchen Appliances market.
Restraints Impact Analysis*
| Restraint | (~) % Impact on CAGR Forecast | Geographic Relevance | Impact Timeline |
|---|---|---|---|
| Mortgage stress squeezing discretionary household spend | -1.4% | National, with acute pressure in Sydney, Melbourne high-mortgage areas | Short term (≤ 2 years) |
| Persistent logistics bottlenecks at Port Botany/Port of Melbourne | -0.8% | National, with direct impact on NSW, Victoria distribution networks | Medium term (2-4 years) |
| Fragmented smart-home standards delaying connected upgrades | -0.6% | National, with higher impact in tech-savvy urban centers | Medium term (2-4 years) |
| Rising e-waste regulation costs for OEM product stewardship | -0.4% | National, with compliance costs affecting all manufacturers | Long term (≥ 4 years) |
| Source: Mordor Intelligence | |||
Mortgage Stress Constrains Premium Appliance Adoption
Real disposable income fell 5.5% since early 2022, forcing many borrowers to divert cash toward mortgage payments and away from non-essential kitchen upgrades. Credit-card balances climb while savings buffers thin, prompting middle-income families to down-trade or delay replacements. Retailers adapt by stocking entry-series ranges and coupling BNPL deals with extended warranties to preserve volume. High-income segments remain resilient, but reliance on affluent pockets elevates competitive intensity among premium brands. Commercial buyers also show caution as hospitality foot traffic normalizes slower than projected, trimming capital budgets for back-of-house tech.
Supply Chain Bottlenecks Increase Operational Costs
Industrial action at major ports disrupted roughly 20% of scheduled appliance imports during 2024, leading to container dwell times that topped nine days and spot-rate surcharges near 20%[4]Source: APPLiA, “European Competitiveness Fund Position Paper,” applia-home.org. Harvey Norman and other retailers reported stock-outs on refrigerators and dishwashers, prompting emergency airfreight at triple the cost per unit. Brands raised safety stock and sourced alternate regional warehouses, inflating working capital requirements. Ocean relapse risks remain as Houthi-related shipping diversions and Panama Canal drought constraints converge with domestic labor disputes. Higher landed costs may flow through to shelf prices, potentially tempering volumes in the Australia Kitchen Appliances market during peak promotional windows.
*Our forecasts treat driver/restraint impacts as directional, not additive. The impact forecasts reflect baseline growth, mix effects, and variable interactions.
Segment Analysis
By Product Type: Electrification Lifts Large-Appliance Outlays
Large kitchen appliances contributed 77.85% of 2025 sales, underscoring their primacy in meeting Victoria’s all-electric new-home mandate and rebate-fueled replacement cycles. Refrigerators and freezers top the list thanks to energy-label updates that encourage inverter compressors and adaptive defrost. Induction cooktops post double-digit unit growth as households remove gas lines and pocket annual savings of USD 350-400 on connection charges. Smart ovens add steam-assist and camera guidance, expanding average selling prices and aligning with demand-response programs. Dishwashers benefit from water-rating thresholds, and range hoods gain relevance by optimizing ventilation in sealed all-electric builds.
Small kitchen appliances, while holding only 22.15% share, are forecast to expand at 6.61% CAGR as urban consumers embrace air fryers, barista-grade coffee machines, and multifunctional food processors. Countertop ovens address compact living trends and supplement larger ranges in high-value homes. AI-enabled blenders and juicers pivot toward plant-based dieting, while connected kettles sync with energy-tariff apps to time boils during off-peak windows. Low-price elasticity and gift-season spikes underpin consistent sell-through for toasters and rice cookers, rounding out basket size and frequency for retailers.


By End User: Residential Spend Dominates, Commercial Uptick Accelerates
Residential buyers accounted for 72.75% of the Australia Kitchen Appliances market in 2025, propelled by renovation-intensive suburbs and rebate-linked electrification. BNPL removes friction for middle-tier households aiming for premium refrigerator French doors or double-drawer dishwashers, while loyalty apps boost repeat purchases of small appliances. Connectivity features carry weight as families seek centralized dashboards that track energy budgets and grocery inventories. Aging housing stock guarantees a steady pipeline of replacements, cushioning sales against the volatility of new-build activity.
Commercial kitchens, though smaller in absolute value, will log a 5.28% CAGR through 2031 as restaurants deploy smart combi ovens, blast chillers, and AI fryers to offset wage pressures. Demand centers on Sydney, Melbourne, and Brisbane CBD precincts, where footfall recovers and menu innovation intensifies competition. Compliance imperatives—from food-waste cuts to volatile energy tariffs—prompt operators to specify equipment with IoT analytics and remote diagnostics. Vendors offering lifecycle maintenance bundles and financing gain share, ensuring penetration across independent cafés as well as multi-site chains.
By Distribution Channel: Digital Gains Within Omnichannel Portfolios
B2C/retail outlets claimed 76.55% sales in 2025, with store formats ranging from destination big-box to boutique showrooms offering design consults. The online slice, currently at 11.6% of retail appliance turnover, is projected to rise fastest at 7.42% CAGR, driven by mobile-first comparison shopping and home delivery convenience. BNPL check-outs spike during Black Friday and EOFY events, pushing average order values beyond USD 1,500 without traditional credit. Brick-and-click models flourish as consumers research online and finalize in-store, where installation and haul-away services are bundled. Exclusive brand outlets lean into immersive experiences—such as live cooking demos—to upsell connected ecosystems.
B2B direct-from-manufacturer sales serve hospitality, property developers, and institutional buyers demanding volume pricing and spec customization. Integrated financing, extended warranty, and software-as-a-service dashboards sway purchasing committees, especially for energy-intensive refrigeration and combi-ovens. Channel partners that offer predictive-maintenance APIs tie equipment lifecycles to cloud analytics, locking in multiyear service revenue and enhancing brand stickiness across the Australia Kitchen Appliances market.
Geography Analysis
New South Wales retained 31.05% share in 2025 on the back of high disposable incomes, dense hospitality clusters, and a mature housing base that cycles through replacements every seven to nine years. Sydney’s renovation surge in coastal suburbs sustains premium cooker and range-hood demand, while the Energy Savings Scheme nudges households toward high-star refrigerators. Mortgage stress, however, tempers mid-market growth, compelling retailers to tailor assortments for entry segments. Port Botany congestion introduces supply risk; brands offset by pooling inventory in western Sydney logistics hubs.
Victoria anchors demand for induction cooktops, heat-pump dryers, and inverter fridges as electrification deadlines loom for new dwellings. The state’s rebate of up to USD 140 on eligible cooktops accelerates switch-outs, promoting price parity with gas alternatives. Melbourne’s café culture fuels commercial coffee-machine upgrades, and local manufacturing incentives under the Industry Diversification Program spark capacity investments that may cut lead times and landing costs for the Australia Kitchen Appliances market. One-for-one renovation replacement intensity creates visibility for appliance pipeline orders beyond 2027.
Queensland is set to log the fastest 6.88% CAGR through 2031, supported by population inflows and green-energy rebates that have already funded 72,700 household upgrades. Tourism rebound bolsters kitchen retrofits across resorts and restaurants, driving demand for marine-grade refrigerators and high-capacity dishwashers. PeakSmart incentives illustrate how broader home-energy programs pull through kitchen appliance categories, especially when paired with smart-meter tariffs. Regional dispersion challenges logistics, prompting drop-ship partnerships with third-party carriers. Western Australia, South Australia, Tasmania, and the ACT-NT cluster collectively form a steady but smaller revenue pool. Mining communities and remote catering sites specify ruggedized cold-chain units, while South Australia’s wine industry leverages temperature-controlled storage. Tasmania’s no-interest loan scheme expands access to high-efficiency models for lower-income households, widening the funnel for brands mastering service coverage beyond mainland metros.
Regulatory Landscape
Australia regulates kitchen appliances primarily through two national regimes: the Greenhouse and Energy Minimum Standards (GEMS) framework (GEMS Act 2012) for Minimum Energy Performance Standards (MEPS) and energy labelling, and the Electrical Equipment Safety System (EESS) for electrical safety, supplier registration, and use of the Regulatory Compliance Mark (RCM). These requirements shape SKU eligibility, testing, and go-to-market timelines for major categories including cooktops, ovens, refrigerators, and dishwashers.
Regulatory settings are also tightening and becoming more coordinated. The Greenhouse and Energy Minimum Standards (Dishwashers) Determination 2024 (made 4 October 2024) updated compliance settings for that category, while the Council on Federal Financial Relations agreed on 29 November 2024 to harmonize and implement more consistent regulation for household electrical consumer products across jurisdictions under ministerial oversight. Updated safety standards such as AS/NZS 60335.2.14:2025 (kitchen machines) and AS/NZS 60335.2.6:2025 (cooking ranges, hobs, ovens) increase the importance of local compliance capabilities for brands and importers.
Value Chain Analysis
The Australia kitchen appliances value chain starts with global component and finished-goods sourcing (notably from Asia, Europe, and the United States), followed by importers, brand subsidiaries, and local manufacturers that adapt ranges to Australian electrical and efficiency requirements. Market participation spans international OEM subsidiaries (for example, Electrolux Australia and ASKO) and specialist importers and distributors (such as Arisit, Residentia Group, and Worldwide Appliances), alongside local manufacturers such as Goldline that support selected categories and contract or adjacent capabilities.
Compliance and certification operate as a gating step before commercialization, with the GEMS Regulator administering MEPS and energy labelling through determinations that must be met before products can be legally supplied (for example, the 2024 determination for dishwashers). Downstream, distribution is anchored by omnichannel retail (including online sales tied to BNPL checkouts for high-ticket items) and B2B supply into developers and hospitality operators. After-sales installation, warranty, spare parts, and service networks act as key value capture points for brands. Port and domestic logistics constraints, alongside compliance costs, reinforce the role of inventory positioning, local warehousing, and selective local assembly initiatives to protect availability and margins.
Competitive Landscape
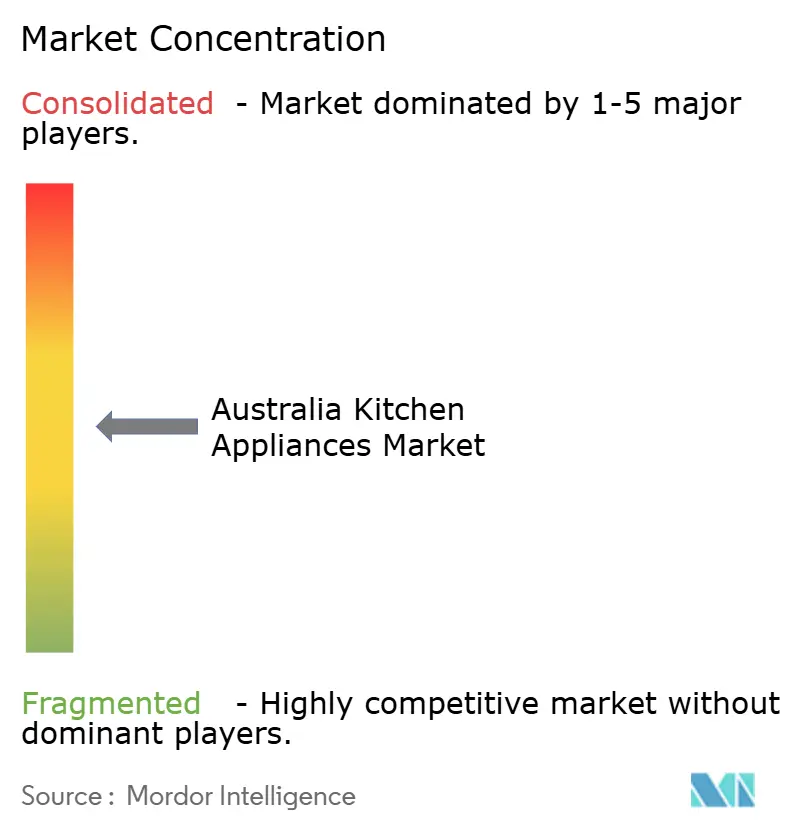
The Australia Kitchen Appliances industry features a moderately fragmented structure where the top brands account for an estimated majority of the combined revenue, leaving room for challenger entries and niche specialists. Samsung spearheads AI-driven launches such as the 2025 Bespoke line, embedding food-recognition cameras and adaptive defrost to synchronize with SmartThings energy dashboards. LG and Electrolux cooperate within the Home Connectivity Alliance to align on Energy Management Interface protocols that adjust appliance loads during peak pricing windows. Haier leverages Fisher & Paykel’s design equity to court premium renovators through integrated refrigeration walls.
Local assembly gains currency as Electrolux breaks ground at Port of Brisbane, aiming to cut shipping lead times and buffer against port disruption risk. Breville’s expansion into Asia underlines a diversification play that frees capacity for domestic coffee-machine innovation. Mid-tier brands uplift value via extended warranties and cashback bundles aligned with state rebates. Edge-AI module suppliers partner with OEMs to incorporate image classification chips at incremental bill-of-materials cost yet meaningful ASP uplift.
Emergent direct-to-consumer labels court Gen-Z buyers online with transparent pricing, carbon-neutral shipping, and modular repair kits. However, scale economics and after-sales requirements erect barriers to rapid share capture. The Australia Kitchen Appliances market thus rewards incumbents skilled at blending omnichannel reach with iterative software updates that enhance existing hardware, prolonging product relevance and customer lifetime value.
Australia Kitchen Appliances Industry Leaders
Samsung Electronics
Electrolux
LG Electronics
Haier Group
Breville Group
- *Disclaimer: Major Players sorted in no particular order

Market Opportunities and Future Outlook
Policy-driven efficiency upgrades and electrification create a clear product and portfolio opportunity as MEPS and labelling settings tighten across multiple appliance groups. Four replacement GEMS determinations (including dishwashers) commenced on 4 October 2025, raising the bar on test methods and label integrity and accelerating redesign and recertification cycles for suppliers competing in major retail channels. This environment supports opportunities for manufacturers and distributors that can rapidly certify higher-star models, bundle rebate-eligible SKUs, and use connected features (energy monitoring dashboards and load management) to support energy-saving claims at the point of sale.
A second opportunity is platform-led premiumization in cooking and built-in suites, combining induction, steam cooking, and AI-assisted guidance into upgrade paths aligned with renovation spending and smart-home adoption. Company actions in 2026, such as Electrolux launching new steam ovens and induction cooktops in Australia and LG highlighting AI-led premium appliance capabilities at CES 2026, show active product roadmaps aimed at higher ASP segments. With online representing 11.6% of retail turnover in March 2025 and BNPL accounting for 40% of consumer payment value in 2024, brands that pair fast delivery and installation with financing, and that differentiate through app-enabled features, have expanded share in metropolitan renovation markets and commercial kitchen refresh cycles.
Recent Industry Developments
- May 2026: Electrolux launched new steam ovens and induction cooktops in Australia, extending its premium cooking portfolio and supporting electrification in built-in kitchens. The rollout strengthens Electrolux's position in higher value segments of the Australian market and aligns with ongoing product roadmaps for premium built-in appliances.
- March 2026: Electrolux introduced a new generation of steam ovens and induction cooktops for Australia and New Zealand, with updated design and finishes. This expansion reinforces Electrolux's premium built-in cooking lineup across key markets and heightens competitive intensity in the region.
- March 2025: Samsung unveiled its Bespoke AI Home Appliances range in Australia, expanding SmartThings-connected appliances and AI-enabled features across key household categories. The release reinforced the shift toward software-defined differentiation and energy-management integration in premium kitchen ecosystems.


Research Methodology Framework and Report Scope
Market Definition and Coverage
This market covers the value of kitchen appliances sold in Australia across major and small appliances used for cooking, food preparation, and kitchen cleaning, measured at the point of sale through offline and online channels.
Scope exclusions: We exclude non-kitchen home appliances, standalone spare parts and repairs-only services, and used or refurbished unit resales where they are not part of a new-appliance transaction.
Segmentation Overview
- By Product
- Large Kitchen Appliances
- Refrigerators & Freezers
- Dishwashers
- Range Hoods
- Cooktops
- Ovens
- Other Large Kitchen Appliances
- Small Kitchen Appliances
- Food Processors
- Juicers and Blenders
- Grills and Roasters
- Air Fryers
- Coffee Makers
- Electric Cookers
- Toasters
- Electric Kettles
- Countertop Ovens
- Other Small Kitchen Appliances
- Large Kitchen Appliances
- By End User
- Residential
- Commercial
- By Distribution Channel
- B2C/Retail
- Multi-brand Stores
- Exclusive Brand Outlets
- Online
- Other Distribution Channels
- B2B (directly from the manufacturers)
- B2C/Retail
- By Geography
- New South Wales
- Victoria
- Queensland
- Western Australia
- South Australia
- Tasmania
- Australian Capital Territory & Northern Territory
Data Sources, Market Sizing, and Validation
Desk Research
Desk research is used to map the demand pool and anchor the model to Australia-specific signals that are visible in public data. We refer to sources such as the Australian Bureau of Statistics, the Australian Trade and Investment Commission, Australian Border Force trade statistics, energy-efficiency labeling and standards pages maintained by government bodies, and public patent databases for appliance-related filings.
Alongside official sources, we also review company annual reports, investor presentations, retailer disclosures, product catalogs, and trusted news coverage to understand pricing changes, product refresh cycles, and channel shifts such as online promotions. For cross-checking company exposure and category mix, paid subscriptions that focus on company financials and news intelligence were used selectively. These desk sources are illustrative, and we used additional references to collect data points, validate assumptions, and close gaps during the study.
Primary Interviews and Surveys
Primary work was used to test the desk findings and to pin down variables that are hard to read from public data, especially category-level pricing, discount depth, and channel margins. We spoke with a mix of manufacturers and importers, retailers and distributors, and commercial buyers such as hospitality and foodservice operators, covering the main states and territories so regional demand differences were not missed. The respondent input helped us align assumptions on replacement cycles, premiumization, and smart-feature adoption before finalizing the model.
Distribution of primary research fieldwork respondents
| Company type | Respondent position |
|---|---|
| Top tier: 28% | CXOs: 12% |
| Mid tier: 58% | Functional/Unit leaders: 31% |
| Smaller Players: 14% | Managers: 57% |
Market-Sizing & Forecasting
Sizing starts with a top-down build where appliance consumption in Australia is reconstructed using a demand pool that links household formation and dwelling activity to replacement-led purchases, then adjusted using import and trade direction signals. Once that picture is formed, we corroborate it with selective bottom-up checks such as sampled average selling prices by category, channel mix splits, and supplier and retailer sense-checks on unit volumes, which are used to correct any drift.
Key inputs that materially shape the model include housing completions and renovation activity, household count and occupancy trends, replacement cycles for large appliances, seasonal promotion patterns, online share shifts versus store-led sales, and observed price movements by category, including the mix change toward higher-capacity and smart-enabled models. For forecasting, we use scenario analysis that ties these drivers to different demand outcomes, and then converge on the most likely path using what industry respondents said about pricing, inventory discipline, and demand elasticity. Where bottom-up reference points are incomplete, we handle gaps through category proxies and channel-weighted averages, then check the results against the overall spend envelope.
Data Validation & Update Cycle
Outputs are validated through triangulation across independent signals, including trade direction, housing indicators, and category-level price checks, and then reviewed for year-on-year jumps that do not match real market behavior. If a variance shows up, we go back to the driver level, re-check the assumption, and re-contact sources when the deviation looks material.
Before sign-off, the model and narrative go through multi-step analyst review so calculation logic, scope treatment, and currency timing are consistent across the workbook. Reports are refreshed annually, with interim updates when a major event changes demand, pricing, or supply conditions. Immediately before delivery, we do a final pass so clients receive the latest updated view.
Mordor Intelligence's Australia Kitchen Appliances Products Market Size Compared With Other Published Estimates
Published market sizes for kitchen appliances in Australia can look far apart, even when the topic sounds similar, because the scope and counting rules differ in practical ways. The biggest differences usually come from whether the study is household-only or also includes commercial demand, whether large and small appliances are both counted, and how the value is timed around discounts and currency conversion.
The main gap comes from whether commercial purchases and the full large-plus-small appliance basket are counted together, where Mordor Intelligence includes both residential and commercial demand across large and small categories, then reconciles totals using channel mix and category ASP checks. Some estimates also rely on older base years or use a narrower product list, which can understate the current market when premium models and smart features are gaining share.
Benchmark comparison
| Source | Market Size | Gaps in Research Methodology |
|---|---|---|
| Mordor Intelligence | USD 3.59 B (2025) | |
| Trade Research Publisher A | USD 1.56 B (2024) | Uses an earlier base year and a different product and channel framework, and it can undercount when large appliances, commercial buying, or state-level channel shifts are not fully represented in the total. |
| Industry Research Publisher B | USD 5.70 B (2025) | Frames the market as household kitchen appliances, and the higher number can reflect a broader household-only revenue definition and different pricing assumptions around promotions and technology-heavy premium models. |
The spread across sources is mainly explained by what gets counted and when it is counted, rather than a single right or wrong number. By keeping the scope explicit and tying the value to clear demand and price drivers, the estimate stays traceable to repeatable steps that can be checked and updated as conditions change.


Key Questions Answered in the Report
What is the current value of the Australia Kitchen Appliances market?
It was valued at USD 3.81 billion in 2026 and is projected to reach USD 5.12 billion by 2031 at a 6.09% CAGR.
Which product category generates the most revenue?
Large kitchen appliances contributed 77.85% of 2025 sales, reflecting electrification mandates and rebate incentives.
Which state shows the fastest growth?
Queensland is forecast to grow at a 6.88% CAGR through 2031 due to population gains and household rebate programs.
How important are online channels?
Online sales represented 11.6% of appliance turnover in March 2025 and are expected to rise fastest at 7.42% CAGR.
What role does BNPL play in appliance purchases?
BNPL accounted for 40% of consumer payment value in 2024, lifting average order sizes for high-ticket refrigerators, ovens, and dishwashers.
Page last updated on:


 Your data is secure and never sold or shared.


