
Market Overview
| Study Period | 2020 - 2031 |
|---|---|
| Forecast Data Period | 2026 - 2031 |
| Base Year Market Size (2025) | USD 2.24 Billion |
| Market Size (2026) | USD 2.37 Billion |
| Market Size (2031) | USD 3.11 Billion |
| Growth Rate (2026 - 2031) | 5.62 % |
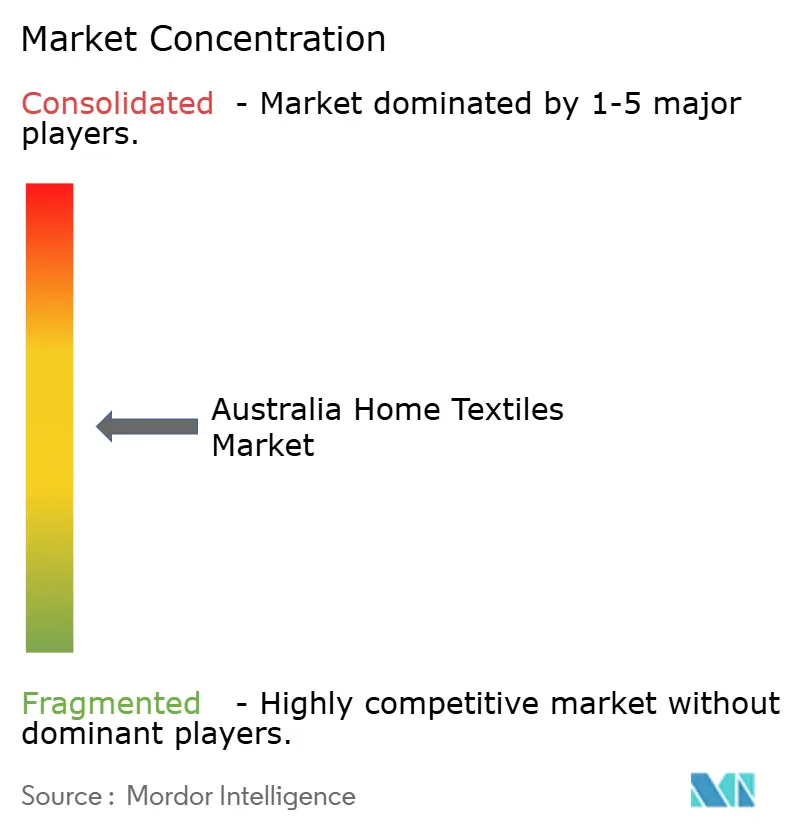
| Market Concentration | Medium |
Major Players *Disclaimer: Major Players sorted in no particular order Image © Mordor Intelligence. Reuse requires attribution under CC BY 4.0. | |
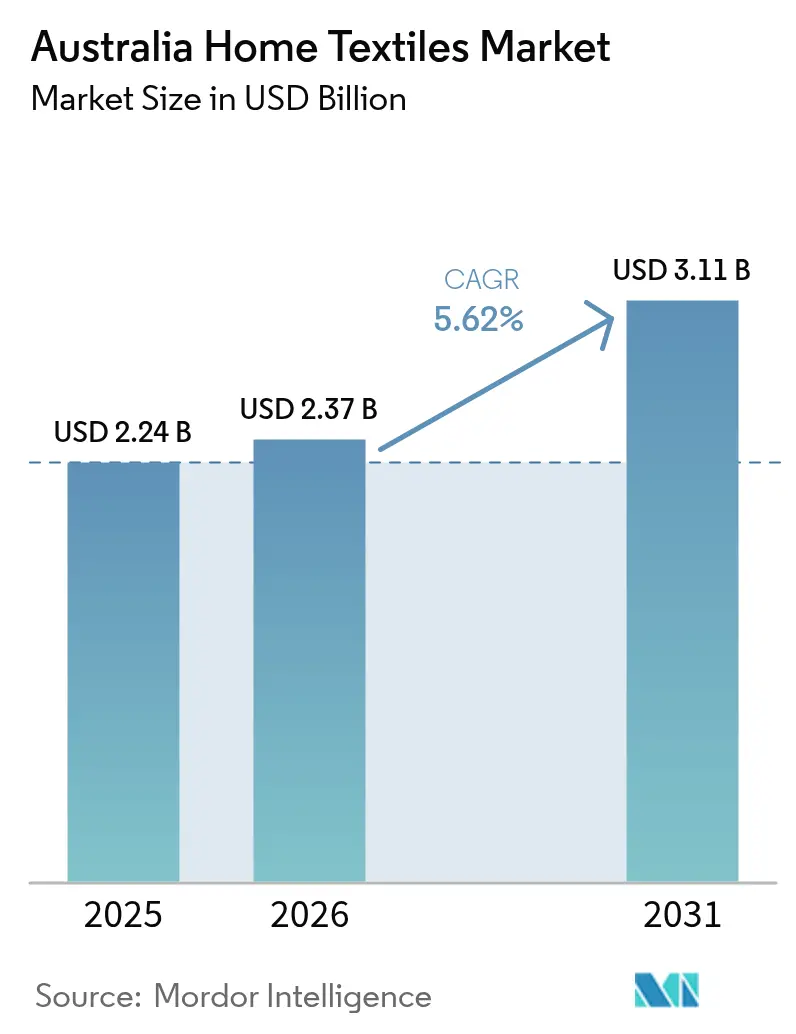
Australia Home Textiles Market Analysis by Mordor Intelligence
Australia home textile market size in 2026 is estimated at USD 2.37 billion, growing from 2025 value of USD 2.24 billion with 2031 projections showing USD 3.11 billion, growing at 5.62% CAGR over 2026-2031. Sustained renovation activity, premium natural-fiber adoption, and government support for domestic sourcing keep momentum strong even as overall discretionary spending normalizes. Millennials and Gen Z households continue to re-allocate travel and entertainment budgets toward home upgrades, bolstering demand for coordinated bed, bath, and upholstery collections. Climate-adaptive innovations such as nanodiamond cooling fabrics enhance product differentiation, while omnichannel fulfillment models convert online interest into in-store or locker pickups with minimal friction. Domestic mills benefit from tighter circular-economy rules that encourage longer product life cycles and higher recycled content, yet they must still navigate raw-material price swings and labor shortages.
Key Report Takeaways
- By application, bed linen led with 38.02% revenue share of the Australia home textile market in 2025; upholstery is forecast to expand at a 5.82% CAGR through 2031.
- By material, cotton accounted for 40.78% of the Australia home textile market size in 2025, while alternative natural fibers are projected to grow at 5.63% through 2031.
- By end-user, residential purchases represented 71.35% of the Australia home textile market share in 2025 and the commercial segment is advancing at a 5.78% CAGR to 2031.
- By distribution channel, B2C retail captured 65.12% of the Australia home textile market in 2025; B2B direct sales post the highest projected CAGR at 5.66% through 2031.
- By region, New South Wales held 23.22% of the Australia home textile market size in 2025; Queensland is on track for a 6.45% CAGR to 2031.
Note: Market size and forecast figures in this report are generated using Mordor Intelligence’s proprietary estimation framework, updated with the latest available data and insights as of 2026.
Australia Home Textiles Market Trends and Insights
Drivers Impact Analysis*
| Driver | (~) % Impact on CAGR Forecast | Geographic Relevance | Impact Timeline |
|---|---|---|---|
| Renovation spending momentum | +1.2% | Capital-city corridors in NSW, VIC, QLD | Medium term (2-4 years) |
| Premium shift to natural fibers | +0.9% | Sydney, Melbourne, Gold Coast | Long term (≥ 4 years) |
| E-commerce and click-and-collect | +0.8% | Metropolitan and emerging regional hubs | Short term (≤ 2 years) |
| Local-content procurement mandates | +0.6% | Canberra and state capitals | Medium term (2-4 years) |
| Circular-economy regulations | +0.5% | NSW leadership; VIC and QLD adoption | Long term (≥ 4 years) |
| Climate-adaptive smart textiles | +0.4% | Tropical and arid states: QLD, NT, WA | Long term (≥ 4 years) |
| Source: Mordor Intelligence | |||
Renovation Spending Momentum
Home-improvement outlays now account for roughly 40% of total residential construction activity, and permit valuations in Brisbane, Sydney’s Northern Beaches, and Melbourne’s eastern suburbs keep rising. Consumers who accrued excess household savings during pandemic lockdowns continue to invest in soft-furnishing upgrades that create hotel-style comfort at home. Re-zoning incentives promoting secondary dwellings also stimulate fresh textile purchases when homeowners add granny flats or studios. National banks report that home-equity withdrawals increasingly fund interior refresh projects, further supporting high-ticket bedding sets and custom curtains. Large-format retailers quickly rotate seasonal color palettes to capture repeat purchases prompted by these ongoing makeovers.
Premium Shift to Natural Fibers
Heightened wellness awareness pushes shoppers toward breathable, hypoallergenic bedding made from organic cotton, linen, hemp, and bamboo. Domestic labels highlight certifications such as Global Organic Textile Standard and Oeko-Tex to establish trust and command 20-30% price premiums. Retail analytics show attach rates rising for accessories like quilt covers and throws when shoppers begin with an organic-fiber sheet set, lifting basket values. The shift also aligns with state government waste-reduction targets that favor biodegradable inputs over synthetics. Mills capable of blending lesser-known fibers such as jute or kapok earn early-mover advantages as retailers curate “new naturals” collections.
E-Commerce and Click-and-Collect
Online home-textile revenue topped USD 45.9 billion equivalent in 2024, and checkout data indicates that click-and-collect now accounts for 70% of digital orders. Locker networks at high-traffic stores, pioneered by IKEA Rhodes, shorten the last mile for bulky quilts and pillows while keeping freight emissions low. Search-driven discovery funnels shoppers into virtual swatch tools, and subsequent store pickup drives incremental spending on décor accents. Marketplace expansions at BIG W and MyDeal are widening SKU counts for niche fibers and bespoke sizes that physical shelves cannot hold. Yet return logistics remain a cost center, prompting investments in AI-guided size and fabric advisors to minimize fit-and-feel surprises.
Local-Content Procurement Mandates
The Future Made in Australia Act 2024 requires federal departments to evaluate domestic value-added ratios when awarding textile contracts exceeding USD 0.62 million (AUD 1 million). Similar criteria cascade to state and defense projects, channeling linen, towel, and curtain orders toward compliant suppliers. Mid-sized mills in regional hubs collaborate with social enterprises to secure workforce pipelines, ensuring they meet the act’s job-creation benchmarks. Preferred-supplier status brings longer contract tenures that justify capital spending on energy-efficient dyeing lines. For retailers, provenance labeling becomes a marketing tool that resonates with consumers seeking to support local manufacturing ecosystems.
Restraints Impact Analysis*
| Restraint | (~) % Impact on CAGR Forecast | Geographic Relevance | Impact Timeline |
|---|---|---|---|
| Cotton-price volatility | -0.8% | Major cotton-processing corridors in NSW and QLD | Short term (≤ 2 years) |
| Import-led price pressure | -1.1% | Nationwide, acute in mass-market channels | Medium term (2-4 years) |
| Manufacturing-skills shortage | -0.6% | Industrial clusters in NSW, VIC, SA | Medium term (2-4 years) |
| Rising water & energy compliance costs | -0.4% | Regions with water-intensive processing | Long term (≥ 4 years) |
| Source: Mordor Intelligence | |||
Cotton-Price Volatility
Global benchmark prices have swung between USD 0.80 and USD 1.20 per pound over the past 18 months, compressing mill margins and complicating hedging strategies. Floods along the Macquarie and Namoi rivers curtailed harvests, causing sudden fiber shortages even as export commitments remained in place. Spinning facilities rely on multi-origin blends to smooth supply, yet freight bottlenecks continue to inflate landed costs. Retailers respond by staggering promotional calendars and adjusting fabric GSM to protect entry-price points. Wool production at century-low levels eliminates a traditional substitute, leaving mills exposed to synthetic fiber substitution risks that may dilute sustainability narratives.
Import-Led Price Pressure
Domestic factories compete against Pakistan and China, whose combined bed-linen exports exceed USD 1.3 billion. Favorable trade agreements and lower utility tariffs allow offshore producers to land finished goods at prices that often undercut Australian cut-and-sew operations by 25%. Private-label buyers for discount chains leverage this gap to maintain aggressive price ladders, reinforcing consumer expectations of perpetual markdowns. Local brands counter with limited-edition artistry and traceability features but must still cover higher wages and compliance expenses. The widening cost delta threatens to cap unit growth for made-in-Australia lines in the mid-market tier[1]Australian Bureau of Agricultural and Resource Economics and Sciences, “Agricultural Commodity Statistics,” agriculture.gov.au .
*Our forecasts treat driver/restraint impacts as directional, not additive. The impact forecasts reflect baseline growth, mix effects, and variable interactions.
Segment Analysis
By Application: Bed Linen Anchors Revenue, Upholstery Gains Speed
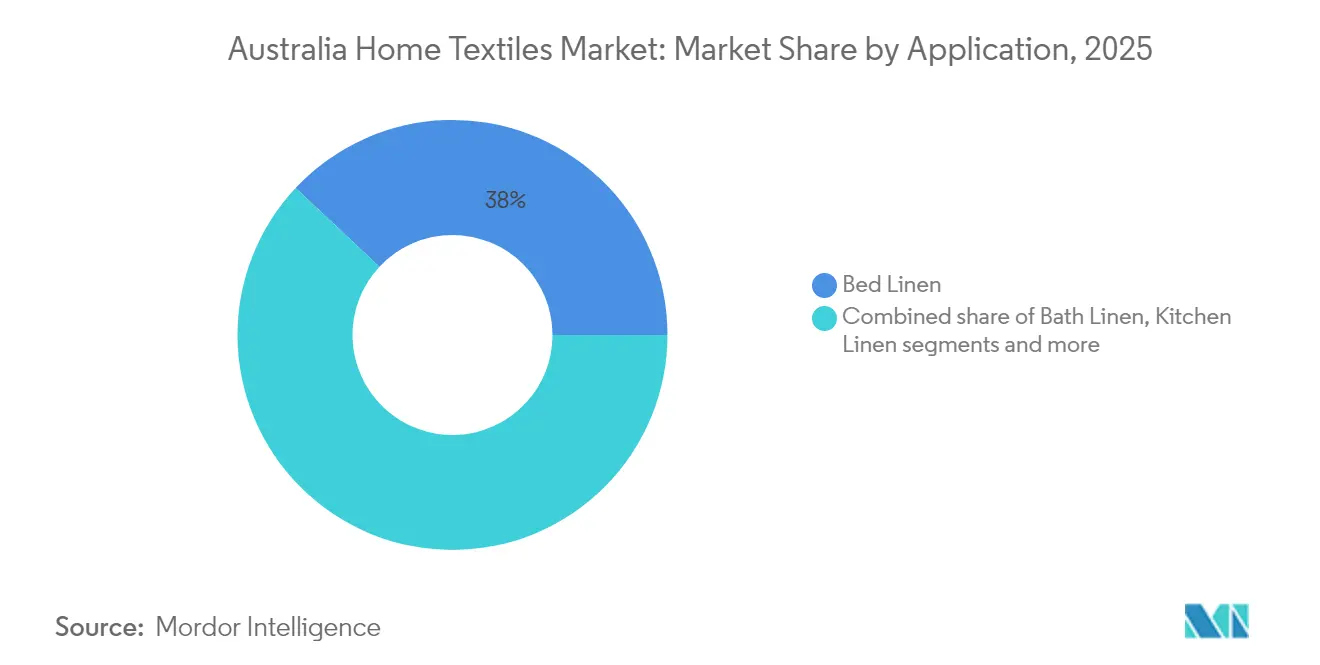
Bed linen generated 38.02% of 2025 revenue within the Australia home textile market, solidifying its role as the category gateway for repeat household purchases. The segment benefits from high SKU refresh rates driven by seasonal color forecasts and queen-size mattress dominance, which simplifies inventory planning. Growth also stems from bundled value packs that pair sheets with pillowcases and duvet covers, elevating per-transaction revenue. Upholstery textiles, although starting from a smaller base, record a brisk 5.82% CAGR as commercial renovators specify climate-adaptive fabrics to meet updated fire and indoor-air-quality codes. Within residential settings, work-from-home arrangements fuel sofa and office-chair re-upholstering, supporting demand for durable yet tactile weaves.
In carpet and area rugs, ongoing preference for hard surfaces such as engineered timber and polished concrete tempers volume growth, yet acoustic and thermal considerations keep premium wool-blend rugs in architectural project specifications. Bath linen maintains steady momentum tied to hotel refurbishment cycles and bathroom renovation grants offered under state housing-energy-efficiency schemes. Kitchen-linen uptake stabilizes at pre-pandemic levels after the cooking surge of 2021-22, but niche items like beeswax-coated reusable food clothes emerge in zero-waste households. Overall, category diversification protects retailers from demand shocks, enabling balanced stock turnover across seasons.


By Material: Cotton Dominates, New Naturals Diversify
Cotton retained 40.78% of sales in the Australia home textile market in 2025, yet its share continues to dilute incrementally as hemp, bamboo, and linen blends capture environmentally minded consumers. Brands utilize Australian-grown cotton to meet local-content rules, often mixing it with imported long-staple varieties to elevate softness metrics. Alternative fiber adoption, growing at 5.63%, rides on consumer education campaigns that highlight breathability and lower pesticide requirements. Wool, despite heritage appeal, faces constrained supply and rising prices, spurring interest in superfine Merino-cotton hybrids that balance cost and performance. Chemical recycling breakthroughs promise to add post-consumer polyester back into cushion inserts, closing material loops without compromising loft.
Certification logos act as shorthand for quality and sustainability, with Oeko-Tex Standard 100 and GOTS labels prominently displayed on packaging and e-commerce listings. Retailers' blockchain traceability pilots that detail farm-to-finish journeys, enabling premium mark-ups. As supply chains localize, mills in Geelong and Albury trial short-run hemp-spinning lines, positioning Australia as a potential exporter of niche natural-fiber yarns. Innovation grants under the National Reconstruction Fund subsidize equipment imports, accelerating technology transfer.
By End-User: Residential Leads, Commercial Accelerates
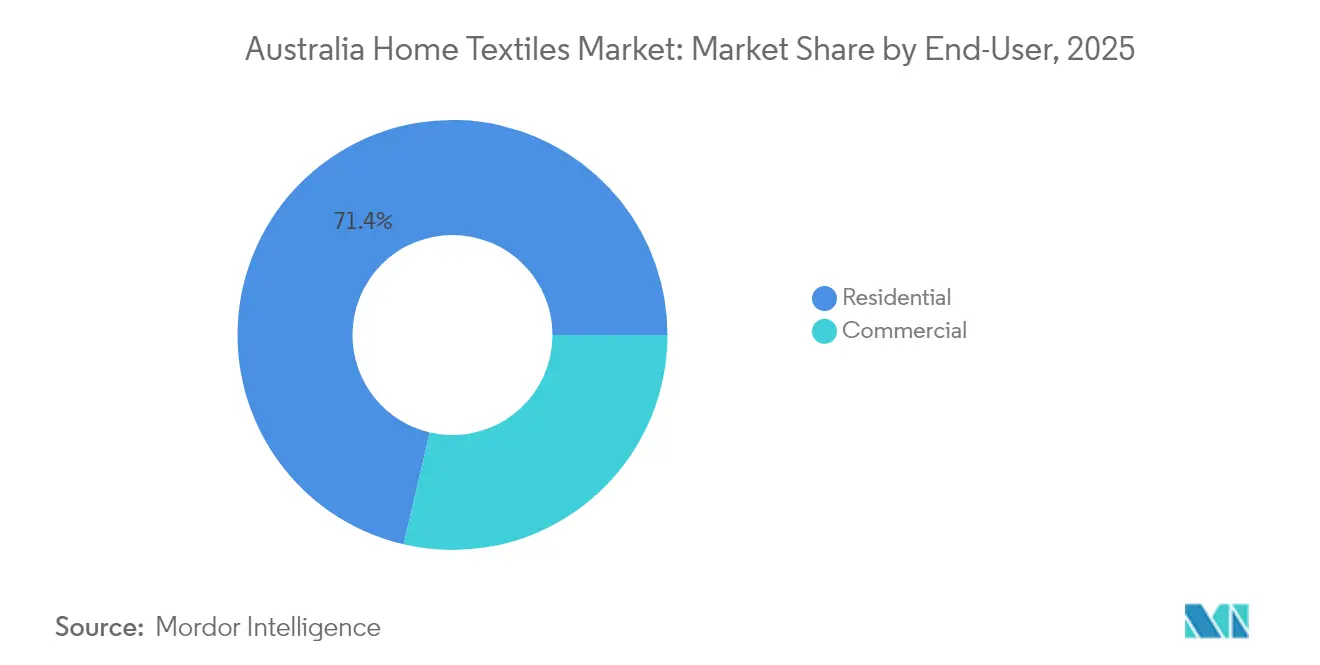
Residential buyers accounted for 71.35% of 2025 revenue, reflecting the sheer volume of households and the replacement cadence for everyday linens. The prolonged shift to hybrid work keeps household occupancy high, heightening wear rates for bedding and upholstery and driving more frequent upgrades. Real estate turnover sparks starter-bundle purchases for first-time homeowners, capturing demand for coordinated bedroom and bathroom sets. In contrast, the commercial segment’s 5.78% CAGR is propelled by hotel reopening, healthcare bed capacity expansions, and office refurbishments that prioritize employee wellness through acoustic and antimicrobial fabrics. Bulk-order economics and long-term supply contracts underpin stable margins for suppliers serving business clients.
Hospitality chains increasingly favor linen rental services that convert capex into opex and guarantee consistent aesthetics across properties. Hospitals and aged-care facilities adopt copper-infused and silver-ion fabrics to mitigate infection risks, illustrating how functional attributes secure price premiums. Co-working operators commission customized drapery with integrated sound-dampening layers, broadening the application scope for higher-margin technical textiles. Collectively, commercial uptake diversifies revenue streams and cushions macroeconomic volatility that may affect discretionary residential spending.
By Distribution Channel: Omnichannel Retail Matures
B2C retail, encompassing department stores, specialty chains, and e-commerce, captured 65.12% of 2025 sales, while B2B direct contracts gain ground amid public-sector procurement reforms. Brick-and-mortar chains refine experiential layouts, installing digital kiosks that let shoppers visualize fabric drape on 3D room renders before placing click-and-collect orders. Specialty stores leverage loyalty programs offering birthday linens and design consultations, deepening lifetime customer value. Marketplaces add long-tail SKUs and facilitate cross-border sales into New Zealand, broadening exporter reach.
Direct-to-consumer start-ups like Bed Threads open showrooms to reduce online return rates linked to color variances and hand-feel expectations. B2B portals integrate with government e-procurement platforms, automating compliance documentation and easing vendor-registration hurdles. The dual-channel approach allows mills to segment production runs, dedicating small-batch collections to boutiques while allocating high-volume SKUs to institutional contracts. Logistics providers roll out reusable shipper totes, aligning with circular-economy mandates and cutting last-mile cardboard waste.
Geography Analysis
Greater Sydney’s affluent catchment areas, combined with its robust logistics backbone, secure New South Wales’ 23.22% leadership position. The Port Botany container terminal supports rapid import clearance for specialty fabrics destined for flagship stores, and proximity to design schools feeds a creative talent pipeline. State grants fund pilot fiber-recycling plants that convert post-consumer linens into insulation panels, reinforcing circular-economy credentials.
Victoria remains the cultural hub for textile design despite operating-cost pressures. Collaborative clusters in Collingwood fuse digital printing studios with heritage mills, shortening prototype lead times for fashion-forward duvet covers. The state’s Creative Industries Strategy earmarks USD 6.22 million (AUD 10 million) for export mentoring, enabling boutique brands to penetrate Asian luxury resort accounts.
Queensland’s population gains and climate realities underwrite its fastest-growing status. Tropical humidity drives demand for moisture-wicking sheets and mildew-resistant curtains, areas where the Australia home textile market sees higher ASPs. The Gold Coast Health and Knowledge Precinct specifies antimicrobial textiles, creating anchor orders that de-risk capacity expansions for local converters.
Western Australia’s geographic distance encourages retailers to maintain larger safety stocks, translating into sizeable forward orders that smooth factory utilization. Mining-town housing-investment subsidies stimulate purchases of durable blackout drapes that conserve interior cooling. South Australia leverages green-hydrogen availability to position itself as a low-carbon dyeing hub, appealing to brands chasing scope-3 emission cuts.
Tasmania and the ACT together punch above their population weight via tourism and government procurement, respectively. Boutique lodges along the Tasman Peninsula specify artisanal wool throws woven at Launceston’s mills, while Canberra’s departmental tenders include stringent sustainability scorecards favoring recycled-content textiles. The Northern Territory’s extreme UV index accelerates trials of UPF50+ window sheers, positioning the region as a reference site for sun-protective innovations.
Regulatory Landscape
Australia home textiles sold into the local market fall under Australian Consumer Law product-safety obligations administered by the ACCC via Product Safety Australia, covering both in-store and cross-border e-commerce sellers. A key information requirement for household textiles is the Consumer Goods (Care Labelling) Information Standard 2023, which prescribes mandatory care labelling for textiles including bedding and furnishings, and references AS/NZS 1957:1998 or ISO 3758:2012 for symbol and instruction conventions.
For imported home textiles, Australian Border Force requirements apply at the border, with tariff classification and duties governed through the Customs Tariff Act 1995 (Schedule 3, Section XI for textiles and textile articles). Brands and importers increasingly focus compliance practice on factory-level specification control, pre-shipment testing documentation, and readiness for bans and recalls where mandatory standards apply.
Value Chain Analysis
The Australia home textiles value chain starts with fiber and yarn sourcing (cotton and other natural fibers), followed by fabric formation (weaving or knitting), wet processing (dyeing and finishing), and conversion (cut-and-sew) into bed linen, bath linen, kitchen textiles, upholstery covers, and inserts. Product development and brand owners then route goods through a mix of importers or wholesalers and direct brand distribution into B2C retail (department, specialty, online marketplaces) and B2B channels (hospitality, healthcare, and public-sector procurement). Click-and-collect and locker pickup models tighten the link between digital merchandising and store-based fulfillment, shifting more value-chain emphasis toward inventory accuracy and last-mile coordination.
Operationally, the chain is exposed to compliance steps (care labelling and product-safety obligations), raw material price swings (notably cotton), and logistics dependencies, especially for imported finished goods and components. Retailers and brands invest in warehousing and order orchestration to reduce lead times and returns friction, while domestic value-add tends to concentrate on higher-touch categories and differentiation through provenance, sustainability attributes, and specialized performance finishes.
Competitive Landscape
Competition in the Australia home textile market is moderate, with established domestic chains jostling against global mass merchants and digitally native newcomers. Adairs reduced SKU complexity by 12% after its Manhattan SCALE WMS rollout, unlocking USD 3.11 million (AUD 5 million) in annual savings that fund boutique-look store refurbishments. Sheridan deploys RFID tags across core bed-linen lines to tighten inventory accuracy and enable real-time click-and-collect allotment. Bed Bath Beyond leverages design collaborations with local artists, refreshing prints quarterly to avoid markdown fatigue.
Amart’s 2025 acquisition of Freedom Furniture yields purchasing power that compresses supplier lead times and enhances private-label penetration. IKEA experiments with subscription bedding that swaps seasonal colorways every six months, targeting younger renters craving novelty without large upfront spend. Pillow Talk positions as an everyday-premium alternative, offering free interior-style sessions that convert high-margin accessory sales. Smaller disruptors like Ettitude pioneer CleanBamboo lyocell sheets, securing eco-awards that drive influencer-led marketing.
Companies now routinely publish annual sustainability scorecards, highlighting metrics like water usage, energy consumption, and wage standards. These scorecards aim to enhance supply chain transparency, which has become a critical expectation in the current market. However, those without third-party verification are increasingly met with skepticism, particularly from urban millennials who prioritize accountability and ethical practices.
Australia Home Textiles Industry Leaders
Adairs
Sheridan
Bed Bath N’ Table
Pillow Talk
Linen House
- *Disclaimer: Major Players sorted in no particular order

Market Opportunities and Future Outlook
Government-led circularity and industry capability programs create room for home textile brands and suppliers that can show durability, repairability, and end-of-life solutions alongside standard comfort and design cues. A concrete catalyst is the Industry Research and Development (Additional Support for Clothing Textiles Circularity Grant Program) Instrument 2025 under the Department of Industry, Science and Resources, which supports circularity initiatives that can carry into home textiles through materials innovation, take-back logistics, and recycling-linked product redesign.
State-led ecosystem building also supports higher-value activity around design-to-manufacturing integration and technology adoption. The NSW Fashion Sector Strategy 2025-2028 (published May 2026) includes establishment of an Australian Fashion Hub to incubate talent and embed advanced manufacturing technologies, aligning with the report themes of premium natural-fiber adoption and climate-adaptive innovations. Separately, the Australian Fashion Council-led Seamless product stewardship scheme raises requirements around durability and recyclability, creating opportunities for suppliers that can provide traceability, standardized material disclosures, and scalable collection-and-sorting partnerships that fit omnichannel retail operations.
Recent Industry Developments
- June 2026: Sheridan highlighted progress from its in-store recycling program, reporting more than 200,000 kg of end-of-life bed linen and towels diverted from landfill over the first year of the initiative. The move supports circular-economy positioning and gives the brand a defensible sustainability proof point that can influence retailer assortments and institutional buyers with waste-diversion targets.
- December 2025: Bed Bath N’ Table won a High Court of Australia decision against Global Retail Brands Australia (House) over use of the “House Bed & Bath” name, which the court found misleading or deceptive. The ruling strengthens brand protection around descriptive naming in homewares and reduces the risk of customer confusion in a category where private label and lookalike merchandising are common.
- July 2024: Adairs completed a nationwide rollout of the Manhattan SCALE warehouse management platform, delivering reported annual savings of AUD 5 million and reducing order-to-ship lead time by 18%. Faster fulfillment and lower handling costs support omnichannel expansion, especially for bulky home textile parcels that benefit from tighter inventory accuracy and pick-pack efficiency.


Research Methodology Framework and Report Scope
Market Definition and Coverage
For this study, we define Australia home textiles as finished textile products used to dress, protect, or decorate home interiors, and they include bedding, bath, kitchen, upholstery fabrics, and floor coverings sold into residential and commercial end users.
Scope exclusions: We exclude apparel textiles and purely industrial or technical textiles that are not purchased for home furnishing use.
Segmentation Overview
- By Application
- Bed Linen
- Bath Linen
- Kitchen Linen
- Upholstery
- Carpets & Area Rugs
- By Material
- Cotton
- Linen
- Synthetic Fibres
- Other Materials (Wool, Hemp, Silk, Jute, Bamboo)
- By End-User
- Residential
- Commercial
- By Distribution Channel
- B2C/Retail Channels
- Mass Merchandisers (Hypermarkets/Supermarkets)
- Home Centers
- Specialty Stores
- Local Mom and Pop Stores
- Online
- Other Distribution Channels
- B2B/Direct from the Manufacturers
- B2C/Retail Channels
- By Region
- New South Wales
- Victoria
- Queensland
- Western Australia
- South Australia
- Tasmania
- Australian Capital Territory
- Northern Territory
Data Sources, Market Sizing, and Validation
Desk Research
Desk research started with aligning the product boundary to common statistical groupings, and then mapping demand signals to Australia specific retail and housing context. We mainly relied on public sources such as the Australian Bureau of Statistics for household spend and housing activity indicators, and the Australian Border Force import statistics for trade direction checks on key home textile categories.
To keep assumptions realistic, we also reviewed sources such as the Reserve Bank of Australia for inflation and consumer conditions, the Australian Competition and Consumer Commission for retail and pricing context, and industry bodies such as the Australian Homewares Association for channel and category cues. Company annual reports, investor decks, and reputable press were used to sanity check category growth and promotional intensity, and paid subscriptions were used selectively for company financials, news, patent lookups, and shipment level import export checks. These desk research sources are illustrative, and many other public and paid references were also used for validation and clarification.
Primary Interviews and Surveys
Primary work was used to pressure test the demand drivers behind bedding, bath, kitchen, upholstery, and floor covering sales, and to clarify price movements that are not visible in public statistics. We spoke with manufacturers, distributors, retailers, and large buyers in hospitality and commercial fit outs, and coverage was balanced across major states so regional assortment and freight effects were not missed.
Distribution of primary research fieldwork respondents
| Company type | Respondent position |
|---|---|
| Top tier: 32% | CXOs: 14% |
| Mid tier: 47% | Functional/Unit leaders: 38% |
| Smaller Players: 21% | Managers: 48% |
Market-Sizing & Forecasting
Sizing was built using a top-down and bottom-up sequence, where household consumption signals, housing completions, renovation activity, and import dependence were used to reconstruct the addressable demand pool for home textiles in Australia. We then corroborated totals with selective bottom-up checks, such as sampled category revenues of key suppliers and retailers, and ASP times volume approximations for high-throughput items like bed linen and towels, which helped adjust for gaps where direct reporting is limited.
Key inputs used in the model included household furnishings and textile related spend trends, dwelling approvals and completions, import value and mix shifts by category, online channel penetration signals from retailer commentary, and observed cotton and synthetic fiber cost pass-through patterns that influence retail prices. For forecasting, scenario analysis was used around consumer spending and housing cycle sensitivity, and each scenario was reviewed with interview feedback so the final forecast stays practical and traceable.
Data Validation & Update Cycle
Outputs were validated through repeated cross checks against independent signals, including trade patterns, retail pricing direction, and housing activity indicators, and then reviewed for outliers at category level before sign off. Where a data point looked inconsistent, we revisited assumptions, rechecked calculations, and re-contacted interviewees if the variance remained unexplained.
The model is refreshed annually, and interim updates are made when material events change prices, trade flows, or consumer demand. Before delivery, an analyst performs a final refresh pass so clients receive the latest available view.
Mordor Intelligence's Australia Home Textiles Market Sizing Compared With Other Published Estimates
Published market sizes for Australia home textiles can differ because each publisher chooses its own product basket and end-use treatment, and then applies different pricing and currency timing assumptions. Differences also show up when update cadence is slower, since home textile prices can move quickly with freight and fiber costs.
A frequent gap driver is scope creep into wider home decor or broader furnishing spend, which can inflate totals by pulling in adjacent non-textile categories or services. Some publishers also use a single retail price inflation factor across all categories, even though bedding, towels, and floor coverings do not always move together in the same season. Some estimates fold in broader home decor categories, and Mordor Intelligence counts only defined home textile products such as bed linen, bath linen, kitchen linen, upholstery textiles, and floor covering items, with category prices cross-checked against trade signals and interview feedback.
Benchmark comparison
| Source | Market Size | Gaps in Research Methodology |
|---|---|---|
| Mordor Intelligence | USD 2.24 B (2025) | |
| Industry Portal A | USD 1.75 B (2025) | Often narrows the scope mainly to bedding and may exclude upholstery textiles and floor coverings, and it can also undercount commercial demand tied to hospitality linen replacement cycles. |
| Market Publisher B | USD 2.90 B (2025) | Typically rolls home textiles into a wider home decor basket and uses blended retail pricing assumptions, which can overstate value when non-textile furnishings and higher margin decor items are included. |
The spread across published values largely comes down to what is included as a home textile product and how prices are translated into USD for the same year. By keeping the product list explicit, checking category level prices, and validating demand signals with trade and buyer feedback, the estimate stays easier to reproduce and explain on a planning call.


Key Questions Answered in the Report
What is the expected value of the Australia home textile market by 2031?
It is forecast to reach USD 3.11 billion, reflecting a 5.62% CAGR over 2026-2031.
Which product category currently generates the most revenue?
Bed linen leads with a 38.02% share of 2025 sales.
Which Australian state is projected to grow fastest through 2031?
Queensland, supported by population inflows and tourism recovery, is set for a 6.45% CAGR.
How are circular-economy policies affecting suppliers?
Extended-producer-responsibility rules push brands to fund take-back programs and invest in recycling technologies, raising compliance costs but encouraging higher-quality materials.
Which distribution channel shows the highest growth outlook?
B2B direct contracts, helped by local-content procurement mandates, are projected to grow at 5.66% annually.
What technological innovation is differentiating premium bedding lines?
Nanodiamond-coated fabrics developed by RMIT lower surface temperatures by up to 3 °C, appealing to consumers in hot climates.
Page last updated on:


 Your data is secure and never sold or shared.


