
Australia Floriculture Market Analysis by Mordor Intelligence
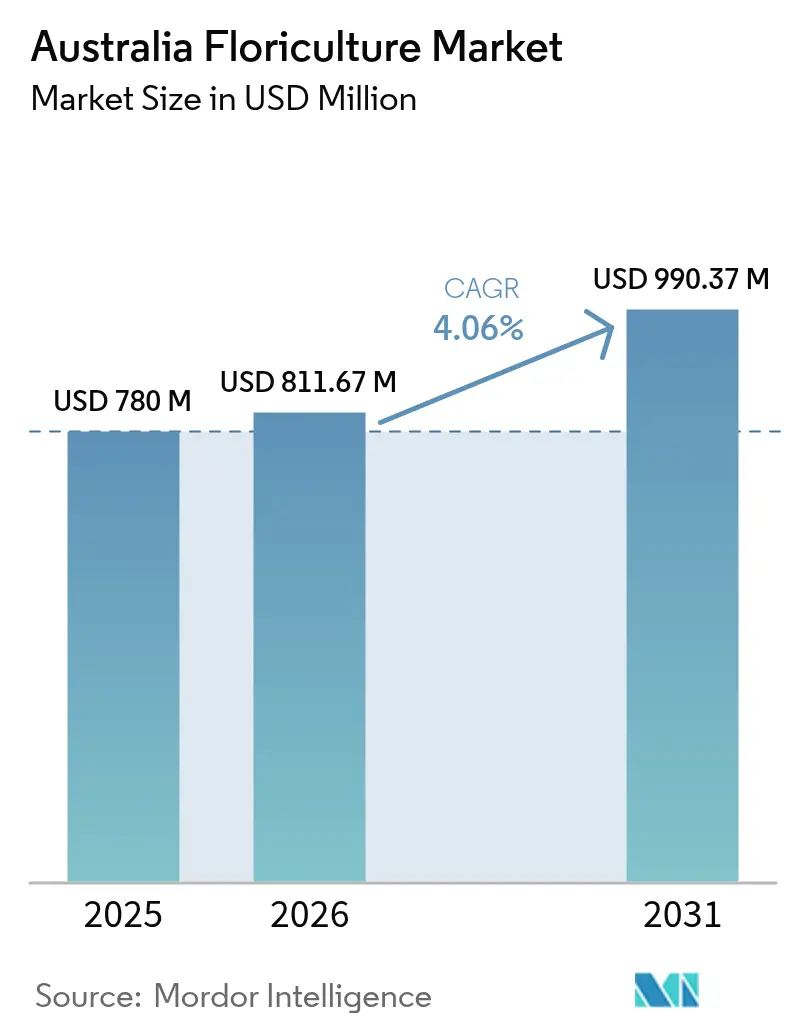
The Australia floriculture market size is expected to grow from USD 780 million in 2025 to USD 811.67 million in 2026 and is forecast to reach USD 990.37 million by 2031 at 4.06% CAGR over 2026-2031. Growth reflects resilient consumer demand, wider adoption of protected cultivation, and expanding export channels for native flowers. Consolidation among retail florists is giving large growers predictable order volumes while allowing supermarkets to expand private-label floral programs. Protected cropping now underpins roughly USD 1.5 billion of annual horticultural output, enabling growers to lengthen production windows and lift stem quality. Native-species breeding, spearheaded by AgriFutures Australia grants, positions Australian producers to command export premiums as global buyers seek distinctive, low-water flowers that support sustainability goals. E-commerce platforms are capturing urban consumers who prefer same-day delivery and transparent pricing, thereby widening domestic addressable demand and offsetting freight-related export headwinds.
Key Report Takeaways
- By flower type, roses led with 28.17% of Australia floriculture market share in 2025, while orchids are forecast to post the fastest 6.86% CAGR through 2031.
Note: Market size and forecast figures in this report are generated using Mordor Intelligence’s proprietary estimation framework, updated with the latest available data and insights as of 2026.
Australia Floriculture Market Trends and Insights
Drivers Impact Analysis*
| Driver | (~) % Impact on CAGR Forecast | Geographic Relevance | Impact Timeline |
|---|---|---|---|
| Increasing retail-florist consolidation boosts wholesale demand | +0.8% | Nationwide, strongest in Sydney, Melbourne, and Brisbane | Medium term (2-4 years) |
| Rising popularity of native Australian cut flowers in export markets | +0.6% | Victoria and New South Wales export hubs | Long term (≥ 4 years) |
| Growth in e-commerce floral gifting platforms | +0.5% | Major urban centers | Short term (≤ 2 years) |
| Expansion of protected cultivation technologies | +0.4% | South-east production belt | Medium term (2-4 years) |
| Government Research and Development grants for floriculture breeding programs | +0.3% | National research nodes | Long term (≥ 4 years) |
| Rising corporate sustainability procurement for locally-grown flowers | +0.2% | Corporate clusters in capital cities | Medium term (2-4 years) |
| Source: Mordor Intelligence | |||
Increasing retail-florist consolidation boosts wholesale demand
Australia’s integrated floral chains and supermarkets are centralizing procurement, which allows scale growers to secure multi-year supply contracts that stabilize cash flows. Independent florists align with national wholesalers to access volume pricing, pushing growers to standardize grades and invest in post-harvest cooling. Consolidation is most visible in metropolitan areas where high rents force mom-and-pop florists either to upscale or exit. Supermarket leader Bunnings estimated a 25% retail share for plants and flowers in 2024, signaling further room for channel concentration. Large chains’ weekly replenishment cycles motivate mechanized bouquet assembly at the farm level, trimming logistics costs.
Rising popularity of native Australian cut flowers in export markets
AgriFutures-funded breeding of Leptospermum, Acacia, Waxflower, and Boronia has improved vase life and stem uniformity, helping shipments win premium positioning with U.S. and Japanese buyers. Australia shipped USD 408,890 worth of native cuts to the United States in 2024, up 11% year-on-year. Native species exhibit up to 40% lower water demand than traditional roses, aligning with global corporate social responsibility sourcing. First Nations enterprises benefit from government Indigenous Procurement Policy contracts valued at USD 9.5 billion since 2015, channeling new capital into native flower production.
Growth in e-commerce floral gifting platforms
Pandemic-induced online adoption cemented digital ordering as a permanent buying behavior. Younger consumers prize real-time delivery tracking and curated subscriptions, which drives higher purchase frequency. Lynch Group’s value-added floral packs for supermarket click-and-collect illustrate how omnichannel models capture impulse demand outside conventional florist hours. Basket sizes grow during peak gifting events such as Valentine’s Day and Mother’s Day because platforms upsell vases and chocolates. Domestic e-commerce mitigates exposure to volatile export freight rates.
Expansion of protected cultivation technologies
Greenhouses and high tunnels shield crops from weather extremes and cut pesticide use by enabling biological control. Protected cropping is Australia’s fastest-growing food production subsector at roughly USD 1.5 billion annually. Growers using smart-farm sensors report up to 50% water savings versus open-field beds. Government-backed demonstration sites in Great Barrier Reef catchments show climate control systems lift premium-grade stem yield by 25%. Capital cost remains the key adoption barrier, but grant programs under the Rural Research and Development for Profit scheme subsidize technology trials.
Restraints Impact Analysis*
| Restraint | (~) % Impact on CAGR Forecast | Geographic Relevance | Impact Timeline |
|---|---|---|---|
| Labor shortages during peak harvest windows | -0.9% | Rural production clusters nationwide | Short term (≤ 2 years) |
| Increasing incidence of thrips and botrytis under warming climate | -0.6% | Humid coastal regions | Medium term (2-4 years) |
| Volatile freight rates erode export competitiveness | -0.4% | Export-oriented farms | Short term (≤ 2 years) |
| Water-allocation caps in Murray–Darling Basin | -0.3% | Basin irrigated districts | Long term (≥ 4 years) |
| Source: Mordor Intelligence | |||
Labor shortages during peak harvest windows
Farms reporting difficulty sourcing workers improved from 57% in 2022 to 34% in 2023, yet busy harvest weeks still spark bidding wars in the Riverina, where daily wages climbed to USD 200-300. Contract labor now represents 64% of seasonal horticulture staffing, adding agency fees to the cost of goods. Mechanization options remain limited in delicate cut-flower picking, perpetuating dependency on transient labor.
Water-allocation caps in Murray–Darling Basin
The Basin Plan recovered 2,100 gigaliters for environmental flows, constraining irrigation availability and lifting water prices by USD 45 per megaliter under modeled buyback scenarios.[1]Source: Australian Bureau of Agricultural and Resource Economics and Sciences, “Impacts of Further Water Recovery,” agriculture.gov.au Floriculture competes against almonds, which require 12.5 megaliters per hectare annually, intensifying market bidding for scarce water. Growers pivot to drought-tolerant natives and micro-irrigation to protect margins.
*Our forecasts treat driver/restraint impacts as directional, not additive. The impact forecasts reflect baseline growth, mix effects, and variable interactions.
Segment Analysis
By Flower Type: Market Leadership and Emerging Niches
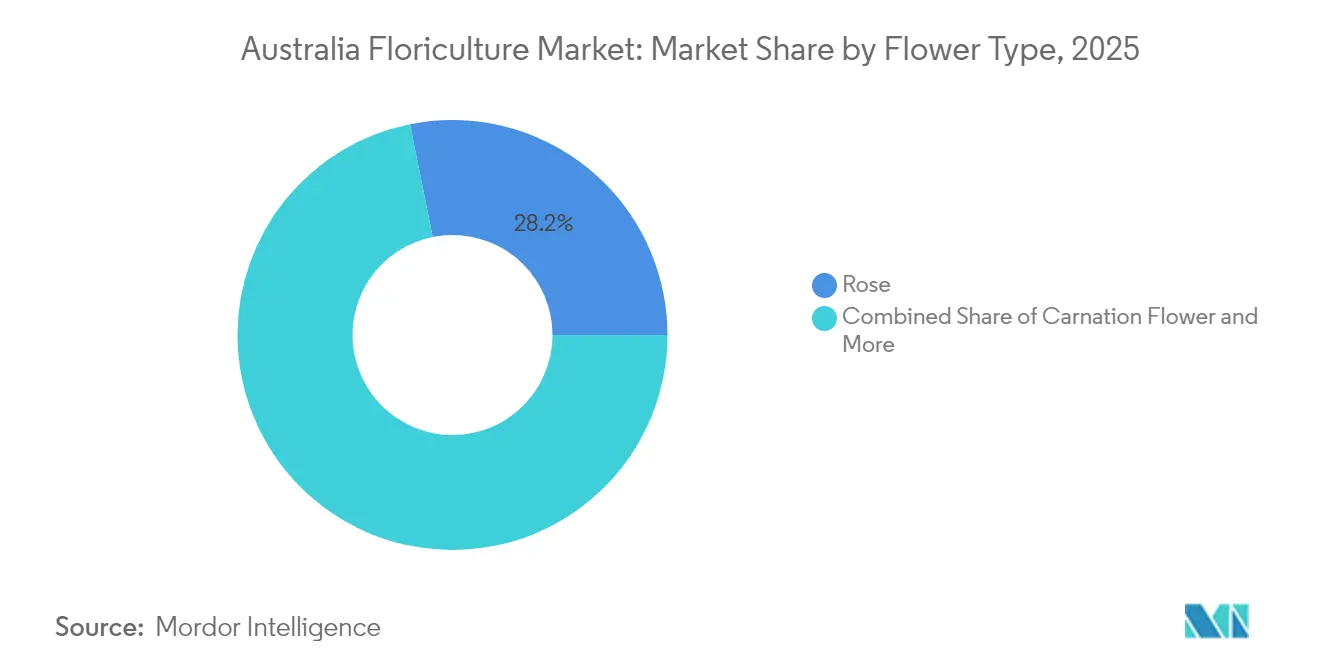
Roses retained 28.17% of Australia floriculture market share in 2025, owing to entrenched gifting traditions and a reliable year-round supply through protected cropping. Orchids, while holding 9.95% share, are projected to capture the highest 6.86% CAGR, contributing markedly to Australia floriculture market size growth driven by longer vase life and rising consumer preference for exotic aesthetics. Chrysanthemums and lilies together account for a 30.74% share, benefiting from seasonal events and broad color palettes that suit supermarket merchandising. Carnations anchor value-oriented bouquets, but their share edges down as buyers trade up to premium natives.
Production economics differ: roses and orchids profit most from high-tech greenhouses that stabilize temperatures and automate feeding. Native cuts such as Waxflower gain ground in open-field blocks with low water inputs, reinforcing sustainability messaging. Import pressure hits carnations hardest because their long post-harvest life makes sea freight viable for overseas suppliers, whereas quarantine restrictions and shorter shelf life insulate rose and native categories. Growers integrate bouquet assembly lines to add value. Lynch Group leads with vertically integrated farms and retail packaging that support supermarket programs.


Geography Analysis
Victoria and New South Wales contribute more than 60.25% of national output, leveraging proximity to Melbourne and Sydney wholesale markets and the Murray-Darling Basin’s irrigation network. Water caps elevate operational risk yet incentivize efficiency upgrades that preserve Australia floriculture market size expansion. Queensland’s tropical zones support specialty natives such as Leptospermum that demand warm nights, securing export premiums in winter months. Western Australia’s wildflower harvest delivers niche export volumes to Europe, supported by state biodiversity.
Protected-cultivation clusters expand fastest in southeastern regions where extreme weather swings and frost risk justify greenhouse investment. Tasmania maintains a cool-climate advantage for bulb crops, including lilies, extending national supply windows. Northern Territory output contracts as veteran growers retire without successors, underscoring labor challenges and logistic costs that thin margins. Freight access influences regional export share: Sydney’s cargo capacity favors New South Wales growers, whereas Western Australia producers face costlier east-to-west domestic transit before exporting.
Climate change prompts region-specific strategies: coastal growers battle humidity-driven disease and therefore adopt ventilated greenhouses inland farms conserve water via subsurface drip and focus on drought-resilient natives. Micro flower farms emerge around Canberra and Adelaide to serve hyper-local farmers' markets, aligning with consumer interest in provenance and lower carbon footprints.
Regulatory Landscape
Australia regulates fresh cut-flower and foliage trade mainly through federal biosecurity and export controls. Imports are governed under the Biosecurity Act 2015 and administered by the Department of Agriculture, Fisheries and Forestry (DAFF), with import conditions and compliance pathways managed through DAFF biosecurity settings. These include phytosanitary certification requirements issued by the exporting country NPPO, and for higher-risk pathways, Supply Chain Management Systems and NPPO-approved systems approaches.
Exports of plants and plant products operate under the Export Control Act 2020 and the Export Control (Plants and Plant Product) Rules 2021, which set registration, documentation, and inspection requirements for commercial shipments. For native flora, environmental rules also shape supply. New South Wales operates a Cut-flower Sustainable Management Plan 2023-2027 under the EPBC Act framework to manage harvesting and streamline compliant trade of eligible native plant material. State biosecurity regimes, such as Agriculture Victoria under the Plant Biosecurity Act 2010, add movement restrictions and zone controls that affect intra-state logistics and pest containment requirements for growers and wholesalers.
Value Chain Analysis
The Australian floriculture value chain starts with inputs such as planting material, substrates, fertilizers, crop protection products, and protected-cropping infrastructure. Production is split across open-field and protected systems, with protected cultivation increasingly used to support consistent year-round supply and quality. Post-harvest handling is where value is added, including grading, bunching, hydration, cold-chain management, and bouquet assembly, which together affect wastage and shelf life in domestic retail and export consignments.
Distribution relies on centralized procurement from supermarkets and large floral wholesalers, alongside florist networks and growing e-commerce delivery models. Lynch Group, as an integrated operator, connects farm supply with packaging and distribution to support supermarket programs and click-and-collect formats through value-added packs. Imports remain a key upstream supply source for retail channels, which increases sensitivity to biosecurity settings and documentation. Domestic growers compete by standardizing grades, investing in cooling, and differentiating via native species, provenance, and sustainability-led offerings. Across the chain, peak-season labor availability, thrips and botrytis pressure in humid zones, water constraints in irrigated districts, and freight volatility for time-sensitive export lanes remain recurring bottlenecks.
Market Opportunities and Future Outlook
Protected cultivation and technology-enabled production offer a practical path to steadier domestic supply, quality uplift, and improved water efficiency, particularly as retailers centralize procurement and demand consistent grades. The Australian Research Council launched a protected cropping Training Centre at Western Sydney University in September 2025, focused on high-value crop production, advanced crop health, and net-zero technologies. This supports a pipeline of growing and post-harvest solutions that growers can apply, complementing the Australian Protected Cropping Strategy 2021-2030, which provides an industry framework for longer production windows and reduced weather disruption.
Opportunities are concentrated around native flowers and differentiated local supply, supported by R&D activity and buyer preference for distinctive, lower-water products. AgriFutures-backed breeding work in native species strengthens export-grade consistency through vase life and stem uniformity, while domestic marketing emphasizes origin signaling to help local growers compete with imported stems in supermarkets. On sustainability-led offerings, the Australian Organic Horticulture RD&I Strategy 2026-2035, published June 2026, targets biological inputs and digital agriculture, supporting reduced-chemical production systems and provenance-driven premiumization in floriculture. At the broader sector level, official statistics indicating Australian horticulture value of AUD 19.5 billion in 2024-2025 provide additional context for supply-chain upgrade investments that also benefit flower logistics, cold-chain capacity, and controlled-environment expansion.
Recent Industry Developments
- June 2026: Lynch Group completed a corporate rebrand to Hasfarm Australia following its acquisition by Hasfarm Holdings, a subsidiary of TPG Capital Asia. The rebrand consolidates operations under a new parent identity and reflects deeper institutional ownership in a key integrated supplier. It reinforces ongoing consolidation across wholesale supply, packaging, and distribution that shapes how supermarkets and large buyers source flowers.
- December 2025: A transaction was completed in which TPG Capital Asia, through Hasfarm Holdings, acquired Lynch Group in a deal reported at AUD 270 million. The change in ownership brings a new capital base and governance structure to one of the largest players supplying packaged bouquets and floral products to major retail channels. The acquisition supports further operational scaling and investment in centralized processing and logistics capabilities.
- December 2024: The Australian government tightened import protocols, banning Adiantum, Dryopteris, Rosa, and Viburnum from Argentina and Japan to avert Phytophthora ramorum. The action changed import availability for selected lines and increased compliance scrutiny for inbound floral material. It also redirected some demand toward domestic growers able to substitute restricted products and meet retailer specifications.


Research Methodology Framework and Report Scope
Market Definition and Coverage
We size the Australia floriculture market as the value of flowers and ornamental plants produced and sold for decorative use, including cut flowers and nursery stock that move through wholesale and retail channels within Australia.
Scope exclusions: We exclude artificial flowers, floral accessories, and pure landscaping services that are not sold as a flower or plant product.
Segmentation Overview
- By Flower Type
- Rose
- Chrysanthemum
- Lily
- Carnation
- Orchid
Data Sources, Market Sizing, and Validation
Desk Research
Desk research starts by mapping the demand and supply flow for flowers in Australia, so the model reflects what is produced locally and what enters through imports before reaching end buyers. We anchor the core dataset using public statistics and sector references such as the Australian Bureau of Statistics, the Australian Department of Agriculture, Fisheries and Forestry, and border trade releases from the Australian Border Force.
To tighten product coverage, we also review materials such as Hort Innovation horticulture updates, customs classification notes used in trade reporting, and peer-reviewed horticulture studies on yields and protected cultivation. Annual reports and investor presentations are checked for pricing behavior, store mix, and channel shifts (for example, supermarkets and online), since these can affect selling values. In a few cases, a paid subscription that tracks import and export shipments and a paid company financials dataset are used to cross-check directional totals. These sources are illustrative, and many other public references were also used for data collection and clarification.
Primary Interviews and Surveys
Primary work is used to confirm what desk sources cannot explain well, especially pricing ladders, post-harvest losses, and how much volume is sold through each channel. We speak with growers, wholesalers, logistics participants, and retail decision-makers across major producing and consuming states, and then re-check assumptions with trade bodies and independent experts. The respondent inputs are used to adjust conversion factors and to sense-check the final value totals so they remain realistic for current market conditions.
Distribution of primary research fieldwork respondents
| Company type | Respondent position |
|---|---|
| Top tier: 33% | CXOs: 16% |
| Mid tier: 50% | Functional/Unit leaders: 25% |
| Smaller Players: 17% | Managers: 59% |
Market-Sizing & Forecasting
We build the headline market value using a top-down approach that reconstructs demand from Australia flower consumption signals and trade flows, and then ties it back to local production value where it is reported. What matters in floriculture is not only volume, so the model tracks average selling prices by key flower groups, typical seasonality patterns (Valentine's Day, Mother's Day, weddings, and year-end events), and the mix shift between domestic supply and imports.
To keep the totals grounded, selective bottom-up checks are applied using sampled wholesale price ranges, indicative yields under open-field versus protected cultivation, and channel shares reported by market participants. When a variable is not available consistently by flower type, we fill gaps through proxy logic, such as using close substitutes with similar cultivation methods, before results are reviewed with interviewees.
For forecasting, scenario analysis is used so the outlook reflects different paths for input costs, greenhouse expansion, and discretionary spending on gifting. The forward view is then finalized after aligning the assumptions with what industry participants expect for planted area, labor availability, and import pricing trends.
Data Validation & Update Cycle
Validation is done by comparing model outputs against independent signals such as import values, production value series, and observed retail pricing movements, and then checking that implied per-capita spend stays within a believable range for Australia. Outliers are flagged early, and the drivers are re-tested, which often leads to follow-up calls when pricing, channel share, or shrinkage assumptions look inconsistent.
Before sign-off, the market model is reviewed in multiple steps by another analyst who did not build the first version, so calculation errors and hidden double counting are easier to catch. Reports are refreshed annually, and interim updates are made when a material event changes trade conditions, major retail behavior, or input cost structures. Right before delivery, we do a final review pass so the published numbers reflect the latest available information.
Mordor Intelligence's Australia Floriculture Market Estimate Compared With Other Published Estimates
Published values for Australia floriculture often do not line up because the scope can shift from farm-gate production to retail turnover, and because product coverage can extend into artificial items or broader home decor. Differences also come from how prices are converted to USD, whether seasonality is normalized, and how quickly older assumptions get refreshed.
Some external estimates present a wider "flower market" that blends retail markups and non-floriculture items into the same total. In Mordor Intelligence, the market is counted as the value of floriculture products only, with flower-type coverage aligned to cultivated and traded categories and with pricing and trade checks refreshed to the current base year.
Benchmark comparison
| Source | Market Size | Gaps in Research Methodology |
|---|---|---|
| Mordor Intelligence | USD 0.78 B (2025) | |
| Trade Journal A | USD 1.14 B (2024) | Uses a broader Australia "flower market" lens that can blend retail markups and adjacent categories, and the year and currency timing may not match a floriculture-only valuation. |
| Industry Source B | USD 1.00 B (2026) | Tracks flower retailing revenue, which captures store-level turnover and service components, so it is not directly comparable to a floriculture product value model. |
The spread in the table is mainly explained by where value is measured, either at product value in the floriculture chain or at retail turnover with added margins and services. By keeping the scope tied to flower and nursery stock categories and then validating with trade and pricing signals, the estimate remains traceable to clear inputs that can be rechecked each year.


Key Questions Answered in the Report
What is the 2026 value of the Australia floriculture market?
The market is valued at USD 811.67 million in 2026.
How fast is the market projected to grow through 2031?
It is forecast to expand at a 4.06% CAGR through 2031.
Which cut-flower segment is growing fastest?
Orchids are projected to record a 6.86% CAGR between 2026 and 2031.
What is the main challenge restricting export growth?
Volatile air-freight rates continue to erode export margins for perishable flowers.
Page last updated on:


 Your data is secure and never sold or shared.


