
Market Overview
| Study Period | 2020 - 2031 |
|---|---|
| Forecast Data Period | 2026 - 2031 |
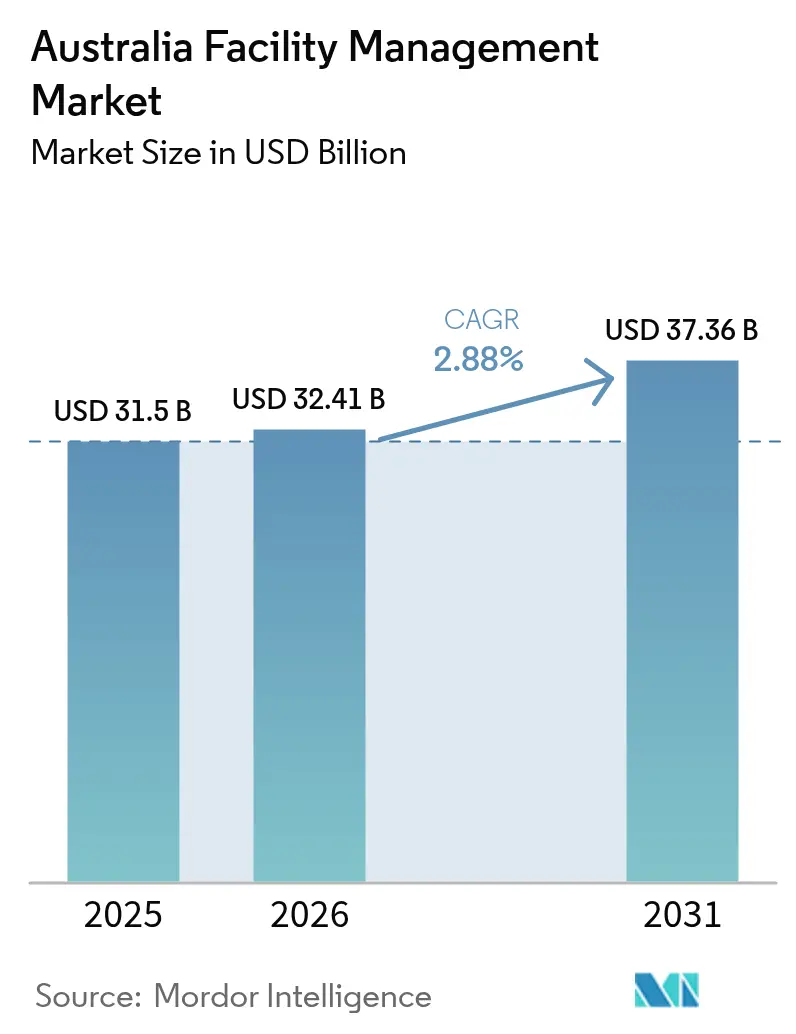
| Base Year Market Size (2025) | USD 31.50 Billion |
| Market Size (2026) | USD 32.41 Billion |
| Market Size (2031) | USD 37.36 Billion |
| Growth Rate (2026 - 2031) | 2.88% CAGR |
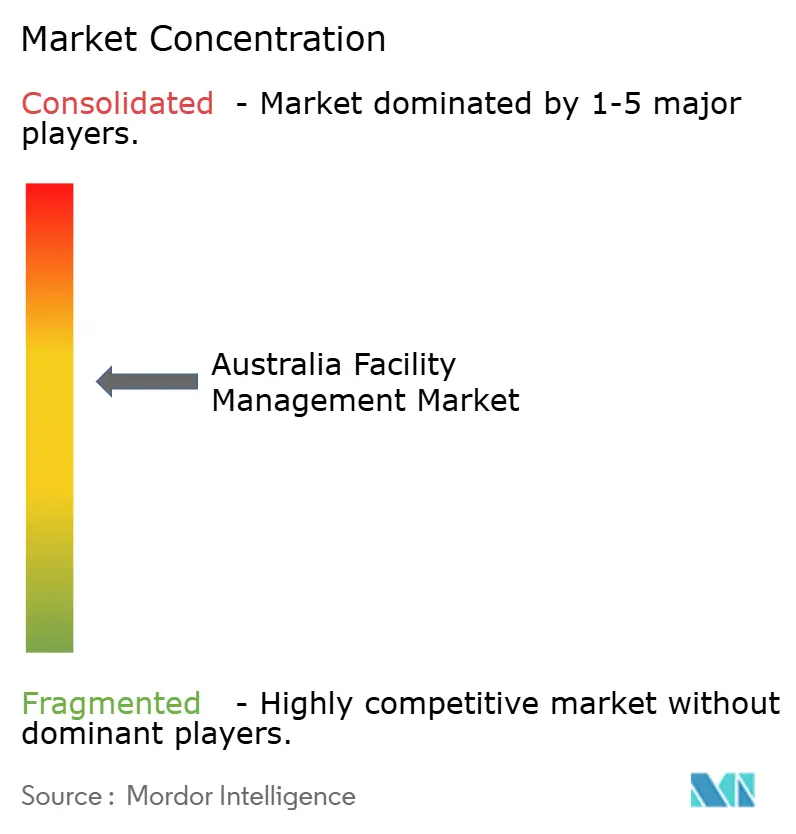
| Market Concentration | Medium |
Major Players *Disclaimer: Major Players sorted in no particular order Image © Mordor Intelligence. Reuse requires attribution under CC BY 4.0. | |
Australia Facility Management Market Analysis by Mordor Intelligence
The Australia facility management market size was valued at USD 31.50 billion in 2025 and estimated to grow from USD 32.41 billion in 2026 to reach USD 37.36 billion by 2031, at a CAGR of 2.88% during the forecast period (2026-2031). This measured expansion reflects the sector’s pivot from simple cost reduction toward strategic asset optimization and mandatory climate-related reporting. Large infrastructure projects delivered through Public Private Partnership frameworks are bringing facility management providers into project planning stages, while national sustainability rules introduced in 2025 embed ESG compliance into day-to-day operations. Digitalization, from IoT sensors to AI platforms, is now central to performance-based contracts that promise measurable uptime and energy-efficiency outcomes. Outsourcing remains the dominant approach, yet differentiation hinges on technology investment, data transparency, and lifecycle asset management. Rising energy price volatility and an acute shortage of skilled technicians impose operational pressure, but they also accelerate uptake of predictive maintenance and remote monitoring solutions that alleviate labor constraints.[1]Australian Broadcasting Corporation, “Rich in resources, but Australia's energy costs have tripled and manufacturers are hurting,” abc.net.au
Key Report Takeaways
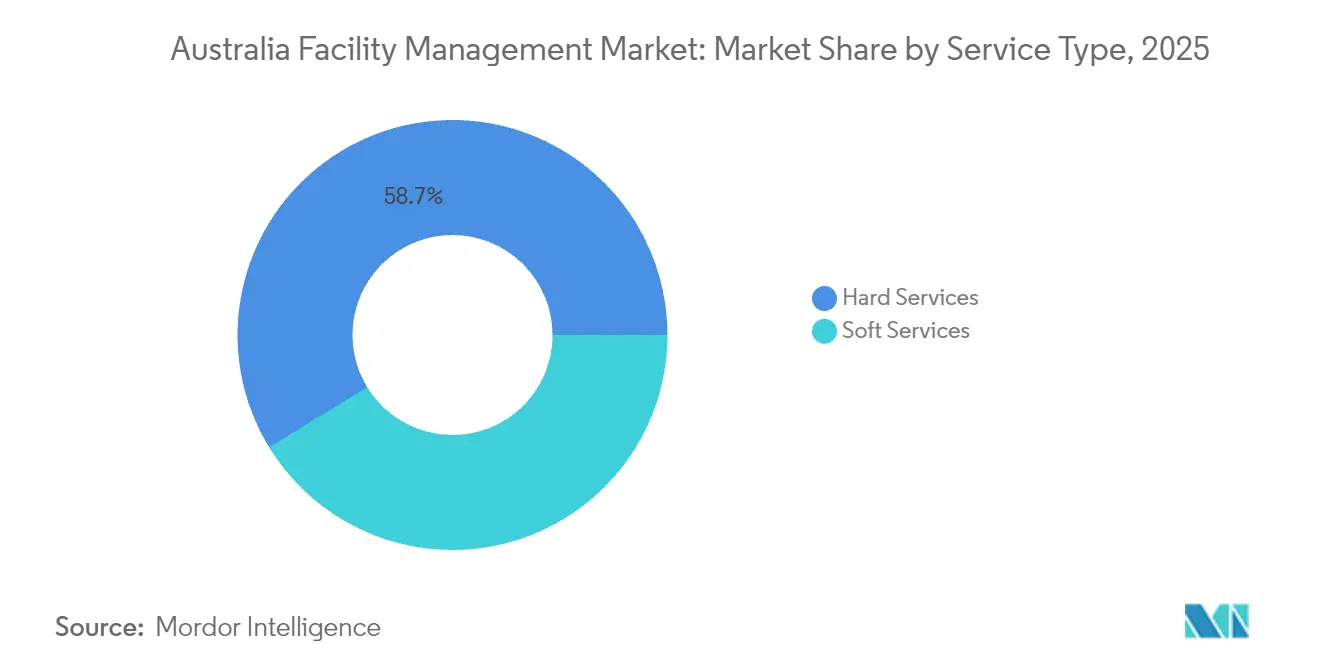
- By service type, hard services led with 58.74% of Australia facility management market share in 2025, while soft services are forecast to expand at a 3.55% CAGR to 2031.
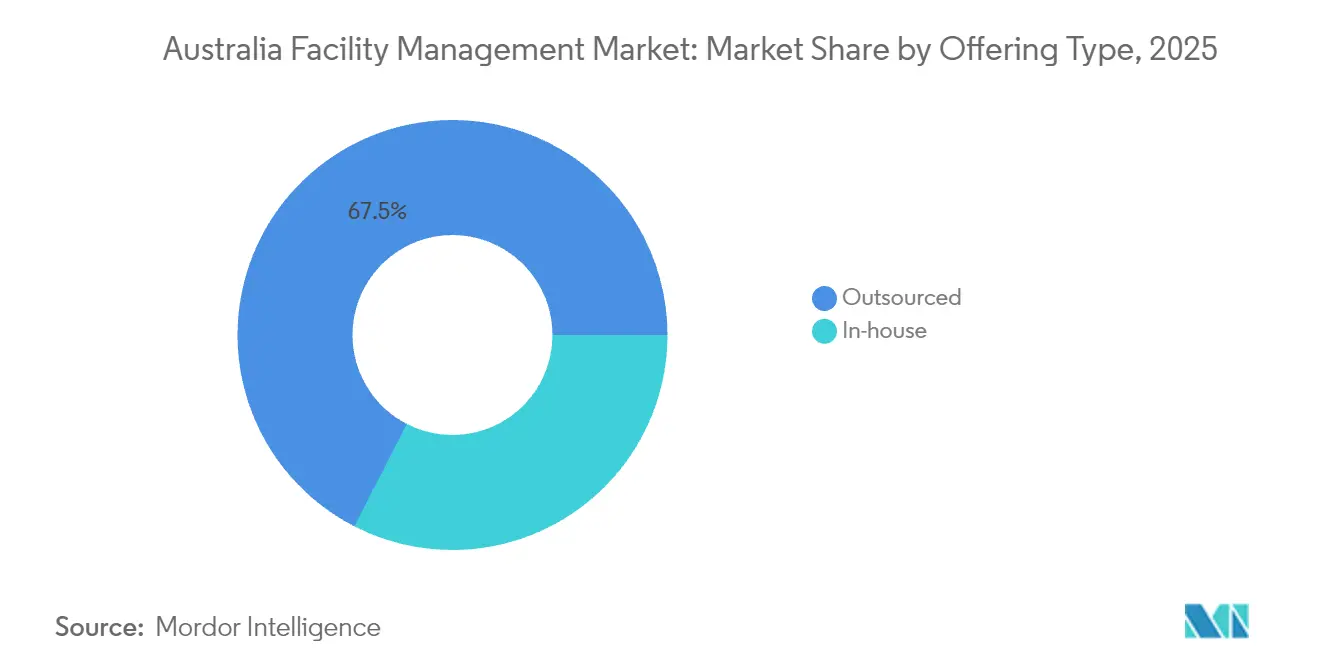
- By offering type, outsourced models accounted for 67.45% of Australia facility management market share in 2025 and are advancing at a 3.62% CAGR through 2031.
- By end-user industry, the commercial segment held 37.05% of the Australia facility management market size in 2025; institutional and public infrastructure is projected to register the fastest 3.18% CAGR between 2026 and 2031.
Note: Market size and forecast figures in this report are generated using Mordor Intelligence’s proprietary estimation framework, updated with the latest available data and insights as of 2026.
Australia Facility Management Market Trends and Insights
Drivers Impact Analysis*
| Driver | (~) % Impact on CAGR Forecast | Geographic Relevance | Impact Timeline |
|---|---|---|---|
| Digital transformation and smart building technologies | +0.8% | National; early uptake in Sydney, Melbourne, Brisbane | Medium term (2-4 years) |
| Increasing outsourcing trend | +0.6% | National; strongest in metropolitan areas | Short term (≤ 2 years) |
| ESG compliance and sustainability requirements | +0.5% | National; stricter in NSW and Victoria | Long term (≥ 4 years) |
| Infrastructure development and government investments | +0.4% | Queensland, Victoria, NSW corridors | Medium term (2-4 years) |
| Rising demand for integrated FM models from PPP projects | +0.3% | National; concentrated in major hubs | Long term (≥ 4 years) |
| Edge AI and predictive analytics cutting lifecycle costs | +0.2% | Major cities expanding to regional centres | Long term (≥ 4 years) |
| Source: Mordor Intelligence | |||
Digital Transformation and Smart Building Technologies
Nationwide roll-outs of IoT sensors, cloud control platforms, and AI analytics are redefining facility performance standards. International Towers Sydney integrates over 1 million real-time data points to automate lighting, HVAC, and security, delivering double-digit energy savings compared with traditional systems. CSIRO estimates USD 13.7 billion in cumulative national utility savings over a decade if similar digital controls are adopted at scale. [2]Commonwealth Scientific and Industrial Research Organisation, “Scoping the Digital Innovation Opportunity for Energy Productivity in Non-Residential Buildings,” energy.gov.au A successful case is the GPT Group, which lowered energy intensity by 52% and saved USD 20 million annually after deploying an enterprise ESG platform. Adoption momentum is strongest in premium commercial towers but is spreading to logistics hubs and healthcare campuses as predictive maintenance reduces downtime and offsets high labour costs.
Increasing Outsourcing Trend
Organisations are handing non-core functions to specialist partners that offer regulatory know-how, data analytics, and outcome-based pricing. Integrated service contracts secured by ISS at Roy Hill’s mining operations extend beyond cleaning and catering to include sustainability metrics and community engagement. The Queensland Government’s Facilities Management Improvement Initiative illustrates public-sector appetite for bundled services to manage AUD 14.8 billion in assets, with early pilots reporting measurable cost and compliance benefits.[3]The State of Queensland, “Beenleigh company to deliver steel for Queensland Train Manufacturing Program,” qld.gov.auOutsourcing growth is underpinned by the recognition that in-house teams lack scale to fund predictive analytics or ESG reporting tools now required under Australian Sustainability Reporting Standards.
ESG Compliance and Sustainability Requirements
Mandatory climate disclosures effective from 2025 oblige large entities to track Scope 1 and Scope 2 emissions and outline decarbonisation pathways. Macquarie Group’s pledge to reach net-zero operations in 2025 showcases private-sector ambition and sets a high bar for FM providers tasked with real-time carbon reporting. The rule set widens to waste, water, and indoor environmental quality, pushing FM bidders to embed lifecycle sustainability dashboards into proposals. Rio Tinto’s USD 5–6 billion decarbonisation plan, targeting a 50% cut in operational emissions by 2030, further elevates demand for providers able to integrate renewable energy assets and low-carbon materials into maintenance regimes.
Infrastructure Development and Government Investments
Pipeline projects such as the North East Link tunnel PPP, the New Footscray Hospital, and the Logan–Gold Coast Faster Rail collectively inject billions of AUD into transport and healthcare assets, each with 20- to 25-year maintenance obligations baked into the financial close.[4]Infrastructure Pipeline, “New Footscray Hospital,” infrastructurepipeline.org Facility management tenders now require evidence of lifecycle costing, community engagement, and digital twin integration from day one. The trend tightens collaboration between construction consortia and long-term operators, favouring FM companies with design-for-maintenance expertise.
Restraints Impact Analysis*
| Restraint | (~) % Impact on CAGR Forecast | Geographic Relevance | Impact Timeline |
|---|---|---|---|
| Skilled labour shortages | -0.7% | National; acute in regional areas | Short term (≤ 2 years) |
| High initial investment costs for technology integration | -0.4% | National; burdens smaller providers | Medium term (2-4 years) |
| Fragmented regulatory compliance across states | -0.3% | National; complexity varies by state | Long term (≥ 4 years) |
| Volatile energy prices impacting Opex savings ROI | -0.5% | National; industrial sites most affected | Short term (≤ 2 years) |
| Source: Mordor Intelligence | |||
Skilled Labour Shortages
Seventy-seven percent of employers cannot find technicians and tradespeople, up from 39% in 2020, according to the national employer body. The shortage pushes average wages higher, strains service quality, and lengthens response times, especially in regional towns competing with mining projects. Companies increase apprenticeships and virtual-reality training, yet the pipeline lags demand. Consequently, providers scale remote diagnostics and autonomous cleaning robots to stretch limited human resources.
Volatile Energy Prices Impacting Opex Savings ROI
Residential tariffs rose 14% in 2024, with comparable spikes for commercial users, complicating guaranteed-savings clauses in FM contracts. Manufacturers cite triple-digit increases since 2022, forcing some plants to curtail shifts, which in turn depresses FM revenue tied to occupancy. Providers respond by offering energy-risk-sharing models and on-site solar plus battery solutions that hedge grid volatility. However, smaller FM firms face capital constraints when procuring renewables or advanced analytics platforms, limiting their competitive stance.
*Our forecasts treat driver/restraint impacts as directional, not additive. The impact forecasts reflect baseline growth, mix effects, and variable interactions.
Segment Analysis
By Service Type: Hard Services Drive Infrastructure Complexity
Hard services accounted for 58.74% of the Australia facility management market size in 2025 due to mandatory HVAC, electrical, and fire-safety compliance. Predictive asset management tools are migrating from rail stock to high-rise towers, enabling condition-based maintenance that lifts asset uptime and trims spare-parts inventory. Energy-efficiency retrofits and IAQ mandates keep mechanical, electrical, and plumbing contractors in high demand. Soft services, though smaller in share, are rising at a 3.55% CAGR as clients reconfigure offices for hybrid work and hospitality-grade experiences. Workplace experience apps merge cleaning, catering, and concierge touchpoints into a single digital interface, boosting service transparency. The convergence of hard and soft portfolios favours vendors that can offer integrated dashboards covering critical systems and tenant amenities in one SLA.
Asset-specific insights reinforce growth: smart HVAC retrofits cut energy draw by 9-10% against legacy systems, underpinning demand amid volatile tariffs. Fire and life-safety upgrades gain traction as tall-building stock rises in Sydney and Melbourne, while remote monitoring of lifts and generators counters technician shortages. Within soft services, eco-certified cleaning chemicals and robotic scrubbers address ESG reporting needs and labour gaps, positioning sustainability-linked service lines as premium offerings.


By Offering Type: Outsourced Models Accelerate Integration
Outsourced provision captured 67.45% share in 2025 and is forecast to expand at 3.62% CAGR, keeping the Australia facility management market ahead of in-house models. Boards seek to redirect capital toward digital transformation and leave compliance, roster management, and asset analytics to specialised firms. Single-service contracts fade as bundled and integrated packages gain traction; bundled engagements consolidate two or three discrete services, whereas integrated deals place every site-related function under one point of accountability. Integrated FM deployments often embed IoT gateways and CMMS platforms by default, a cost few in-house teams can justify.
Outsourcing momentum is reinforced by regulatory stakes: climate disclosures, modern slavery rules, and Indigenous participation targets all require specialised reporting frameworks. Providers pitch outcome-based compensation tied to energy and uptime metrics, shifting financial risk from asset owners to FM partners. The model resonates with PPP sponsors, health networks, and global corporate tenants aiming to benchmark portfolio performance across continents.
By End-User Industry: Commercial Sector Leads Digital Adoption
Commercial real estate held 37.05% of the Australia facility management market share in 2025 thanks to premium office towers, data centres, and retail complexes that demand 24/7 availability and ESG certification. High-rise stock in Sydney’s Barangaroo and Melbourne’s Docklands acts as a proving ground for AI-enabled building operating systems. Tenant amenities such as touchless access and live IAQ dashboards move from nice-to-have to lease differentiators. Meanwhile, institutional and public infrastructure grows at 3.18% CAGR to 2031, buoyed by hospital expansions and rail megaprojects that require stringent safety and asset-management regimes.
Education campuses adopt flexible classrooms and blended-learning tech, raising maintenance complexity around AV gear and occupancy-sensor networks. Transportation nodes invest in cyber-secured SCADA and CCTV upgrades, which combine physical and digital risk oversight. Industrial clients, particularly mining and advanced manufacturing, need remote monitoring and harsh-environment maintenance protocols. Hospitality and multi-housing rebound with wellness-centred refurbishments, demanding FM partners who can harmonise guest services, energy control, and waste diversion targets in one dashboard.
Geography Analysis
New South Wales leads the Australia facility management market, anchored by Sydney’s headquarters cluster and PPP pipeline. Enhanced Work Health and Safety rules raise compliance workloads and favour providers with accredited processes. The Clarence Correctional Centre adds a 25-year facilities scope to the region, creating steady demand for security, cleaning, and technical maintenance. Sydney’s smart-city ambitions spur pilots of 5G-enabled building twins and micro-grid integration.
Victoria charts robust growth through investments such as the AUD 2 billion New Footscray Hospital PPP, which obliges whole-of-life FM oversight for 25 years. Melbourne’s manufacturing and logistics spine elevates demand for industrial FM specialists, particularly as renewable-energy mandates accelerate warehouse solar installs. Cultural and sporting venues in the state require adaptable service models able to scale for events yet minimise idle-time costs. Energy price swings are pronounced for Victorian manufacturers, intensifying adoption of demand-response and on-site generation.
Queensland’s facility management sector benefits from the Logan–Gold Coast Faster Rail and Train Manufacturing Program, together exceeding AUD 6 billion, that embed integrated FM into rail depot and station operations. Tourist precincts on the Gold Coast drive refurbishment cycles focused on environmental certifications to attract international visitors. Western Australia’s market remains shaped by government maintenance frameworks and the resources sector, with Programmed’s long-running state contract underlining a preference for consolidated regional suppliers. South Australia, Tasmania, and the Northern Territory together present niche opportunities in defence, space infrastructure, and eco-tourism lodges, yet distance and thin labour pools compel heavy reliance on remote monitoring technologies.
Regulatory Landscape
Facility management in Australia is shaped by national building performance and disclosure obligations that flow into maintenance, energy management, and reporting requirements for asset owners and their service partners. A major 2026 inflection point is the National Construction Code (NCC) 2025 release on 1 May 2026 by the Australian Building Codes Board (ABCB), which introduces tighter commercial-building energy efficiency settings and adds provisions that elevate the role of building systems. These include requirements around energy monitoring, with NCC provisions referenced around facilities energy monitoring such as Clause J9D3. In parallel, mandatory climate and energy reporting requirements under federal settings, including the National Greenhouse and Energy Reporting framework, and sustainability-linked procurement practices increase auditability across hard services such as HVAC, electrical, and fire safety.
Public-sector property policy also pushes standardized sustainability clauses into tenancy and operations. Under the Australian Government Department of Finance, Green Lease Schedules are required from January 2025 for qualifying non-corporate Commonwealth entity office leases (1,000 sqm or more and four years or more), embedding energy, water, and waste performance management into lease administration and day-to-day FM routines. In 2025, Building Ministers agreed to streamline the NCC and pause further residential changes after NCC 2025 (excluding essential quality and safety measures) until mid-2029, which reduces near-term code churn for providers while concentrating compliance effort on the 2025 code rollout and commercial performance upgrades.
Value Chain Analysis
Australia's facility management value chain starts with asset owners (commercial property, government estates, healthcare, education, transport, and resources), moving through principal FM contractors that deliver single, bundled, or integrated models. A broad subcontractor layer then carries out hard services (MEP, HVAC, fire and life safety, lifts) and soft services (cleaning, security, catering). Digital enablers run across the chain, including CMMS, BMS/BMCS, IoT sensors, analytics, and cybersecurity controls that connect field work to compliance reporting and performance-based SLAs. Public-sector requirements under energy-efficiency-in-government settings and building code developments are also pulling OEMs, controls integrators, and software vendors closer to core FM delivery.
Interoperability and standards compliance are increasingly a gating factor for participation, particularly in institutional portfolios that specify building automation protocols and governance. For example, public-sector and university estates that adopted BMCS standards referencing BACnet (ISO 16484) aim to reduce vendor lock-in and improve lifecycle maintainability, shaping how FM primes select controls contractors and data platforms. The main bottlenecks remain skilled technician shortages and the cost of technology integration, which supports greater use of remote monitoring and predictive maintenance while increasing reliance on specialist partners for automation, commissioning, and ongoing tuning of energy systems.
Competitive Landscape
Competition is moderate with a tendency toward consolidation as clients consolidate spend with fewer, full-service partners. International majors—ISS, Sodexo, Serco, CBRE—vie alongside domestic operators Ventia, Spotless, and Programmed. The ACCC’s 2024 cartel action against Ventia and Spotless over Defence base contracts underlines the high stakes in federal tenders and raises compliance scrutiny across the field. Technology investment is the prime differentiator; CBRE’s new Building Operations & Experience division pools facilities, property, and workplace services into a USD 20 billion revenue stream supported by unified data platforms.
Providers build in-house analytics hubs and strike alliances with software vendors to embed real-time asset health dashboards into client portals. ESG credentials are now standard bid requirements, pushing firms to quantify carbon reduction delivered through retrofits or electrification projects. Indigenous procurement quotas in government contracts spur joint ventures with First Nations enterprises, reshaping subcontracting structures. Smaller, regionally focused companies survive by specialising in heritage-listed sites, remote mining camps, or high-security defence locations where large corporates lack local depth.
M&A activity remains brisk as firms seek scale and niche capabilities. CBRE’s acquisition of J&J Worldwide Services expands defence facilities coverage and deepens engineering competencies, while ISS targets healthcare and mining verticals through multi-year contract extensions. Investors view AI-powered maintenance platforms as growth multipliers, prompting private-equity interest in mid-tier specialists with proprietary software. Entry barriers—state licensing, union agreements, and capital-intensive technology—protect incumbent positions yet simultaneously slow disruptive entrants.
Australia Facility Management Industry Leaders
ISS Australia
Sodexo Facilities Management Services
Australia Facilities Management
Ventia Services Group
Serco Facilities Management
- *Disclaimer: Major Players sorted in no particular order

Market Opportunities and Future Outlook
Contracting activity in logistics, resources, and municipal portfolios highlights whitespace for integrated, multi-site delivery models that combine engineering maintenance, workplace services, and digitized performance reporting. In February 2026, CBRE was awarded a five-year national facilities management contract by ESR for a large industrial and logistics portfolio across multiple states. The award reinforces the opportunity for providers that can standardize service delivery, asset data, and compliance processes at scale. On the resources side, Sodexo's May 2026 seven-year FM award to manage Rio Tinto's Pilbara operational sites, spanning FIFO accommodation and residential housing maintenance, supports demand for remote-region operating models that integrate asset uptime, workforce experience services, and measurable operational controls.
Technology-enabled building operations remain an execution gap across portfolios adding electrification loads and connected systems. Industry and government signals emphasize resilient, well-managed critical infrastructure, including data centres and AI-related infrastructure, and the need for facilities teams to manage complex integrated systems, from dashboards and real-time sensor data through to cybersecurity hygiene for connected plant. For FM providers, this points to packaged offerings around building management system optimization, energy monitoring and reporting aligned to evolving NCC requirements, and standardized controls frameworks, for example BACnet-aligned BMCS specifications, which reduce integration friction across multi-vendor estates.
Recent Industry Developments
- June 2026: Sodexo renewed a five-year contract with Westgold Resources to manage mine villages in Western Australia, covering village management and catering. The renewal reinforces the role of integrated soft services in remote operations and strengthens Sodexo's scale position in resource-linked facilities portfolios.
- May 2026: Sodexo was awarded a seven-year facilities management contract to manage Rio Tinto's Pilbara operations in Western Australia, covering FIFO accommodation and site services. The award signals how large resource operators are bundling accommodation, maintenance, and site services under longer-term agreements that favor providers with mature governance, safety, and data-led operations.
- January 2026: Ventia commenced a two-year extension of its facilities management agreement with the City of Sydney covering City-owned assets including Sydney Town Hall. The extension supports steady demand for FM across civic, cultural, and operational facilities with varied compliance requirements and underscores capability in multi-asset portfolio management for public-sector clients.


Research Methodology Framework and Report Scope
Market Definition and Coverage
For this study, the Australia facility management market is defined as the value of services used to operate, maintain, and support buildings and sites so they stay safe, compliant, and efficient across day to day use.
Scope exclusions: We exclude activities that are not delivered as facility management services, such as pure construction and one-time capital works that are billed outside ongoing FM contracts.
Segmentation Overview
- By Service Type
- Hard Services
- Asset Management
- MEP and HVAC Services
- Fire Systems and Safety
- Other Hard FM Services
- Soft Services
- Office Support and Security
- Cleaning Services
- Catering Services
- Other Soft FM Services
- Hard Services
- By Offering Type
- In-house
- Outsourced
- Single FM
- Bundled FM
- Integrated FM
- By End-user Industry
- Commercial (IT and Telecom, Retail and Warehouses, etc.)
- Hospitality (Hotels, Eateries, Large-scale Restaurants)
- Institutional and Public Infrastructure (Govt, Education, Transportation)
- Healthcare (Public and Private Facilities)
- Industrial and Process (Manufacturing, Energy, Mining)
- Other End-user Industries (Multi-housing, Entertainment, Sports and Leisure)
- By Region
- New South Wales
- Victoria
- Queensland
- Western Australia
- Rest of Regions
Data Sources, Market Sizing, and Validation
Desk Research
Desk research started with public information that helps map demand pools and service intensity in Australia. We referred to sources such as the Australian Bureau of Statistics, the Australian Government Department of Climate Change, Energy, the Environment and Water (for energy efficiency and building performance context), Safe Work Australia (for compliance and safety cues that affect inspection and maintenance cycles), and the Clean Energy Regulator (to understand the direction of building emissions and reporting obligations). Where procurement signals were useful, we also reviewed federal and state tender portals to see how hard and soft services are commonly packaged in outsourced contracts.
To ground the supplier side, we used company annual reports, investor presentations, and reputable press coverage on large contract wins and portfolio changes. A paid subscription focused on company financials and news helped cross-check Australia exposure and the service mix where disclosures were partial. The sources listed above are illustrative and not exhaustive, and we also used other public and paid references during data collection, validation, and research clarification.
Primary Interviews and Surveys
Primary discussions were used to confirm what typically sits inside hard and soft service scopes, and how contracts are priced, renewed, and expanded across commercial, public infrastructure, healthcare, and industrial sites. We spoke with a spread of service providers, subcontractors, and buyer side facility teams to validate assumptions on outsourcing mix, bundled versus integrated delivery, and how compliance requirements and energy upgrades change ongoing service intensity.
Distribution of primary research fieldwork respondents
| Company type | Respondent position | Region |
|---|---|---|
| Top tier: 29% | CXOs: 17% | |
| Mid tier: 54% | Functional/Unit leaders: 41% | |
| Smaller Players: 17% | Managers: 42% |
Market-Sizing & Forecasting
Sizing was built using a combined top-down and bottom-up logic, with Australia level demand reconstruction as the main spine. The top-down view was created by linking building and site activity to typical FM service needs, and then applying realistic outsourcing and service mix splits that were stress tested in interviews. Results were then corroborated with selective bottom-up approximations such as sampled contract values, provider revenue exposure to Australia operations, and channel checks on common rate cards.
Inputs that mattered in this market model included the active building stock by major end-use, the outsourced versus in-house delivery mix, hard services intensity tied to MEP and safety compliance cycles, soft services frequency (cleaning, security, landscaping) by site type, and the share of bundled and integrated contracts in larger portfolios. Where company disclosures were not clean, gaps were handled by using contract footprints, service coverage counts, and reasonable allocation keys discussed with practitioners.
For forecasting, we relied on scenario analysis supported by variable level expectations gathered from primary experts. Growth paths were aligned to observable drivers such as public infrastructure operations load, commercial occupancy normalization, wage and input cost pass-through behavior in contracts, and energy management and compliance led scope expansions, and then converted into a consistent USD series.
Data Validation & Update Cycle
Validation was done by triangulating the model total against independent signals, and then checking whether the implied per site spend and outsourcing shares looked realistic for Australia. Large variances were flagged, worked back to the underlying drivers, and reviewed again with a second analyst before being signed off.
The report is refreshed annually, and interim updates are triggered when material events occur, such as major outsourcing shifts, policy changes that alter compliance work, or unusually large contract awards. Before delivery, the latest data pass is completed so clients receive the most current view available at that time.
Mordor Intelligence's Australia Facility Management Market Sizing Compared With Other Published Estimates
Published market sizes for Australia facility management can look far apart, mainly because different studies count different service bundles, use different base years, and apply different currency and inflation timing choices.
The benchmark table shows a gap that is largely explained by what gets counted as facility management revenue, where in Mordor Intelligence's model the total includes hard and soft services delivered across in-house and outsourced arrangements (including single, bundled, and integrated contracts) instead of only outsourced management service revenue or only tender-tracked spend.
Benchmark comparison
| Source | Market Size | Gaps in Research Methodology |
|---|---|---|
| Mordor Intelligence | USD 31.50 B (2025) | |
| Trade Journal A | USD 26.10 B (2025) | Often built from awarded and tracked contract spend, which can undercount in-house delivery and smaller renewals, and can also mix calendar-year spend with fiscal-year reporting. |
| Industry Tracker B | USD 15.00 B (2026) | Typically reflects a narrower service definition closer to outsourced FM services only, and may exclude several soft services or integrated bundles that are billed inside wider FM contracts. |
Taken together, the spread is not just about forecasting optimism, it is mostly about what is included and how totals are constructed. Our approach stays traceable to clear demand drivers and contract realities, which helps decision makers compare like with like when they use the numbers for planning.


Key Questions Answered in the Report
What is the projected size of the Australia facility management market by 2031?
The Australia facility management market size is forecast to reach USD 37.36 billion by 2031.
Which service category currently dominates the market?
Hard services, covering HVAC, MEP, and safety systems, commanded 58.74% of market share in 2025.
Why are outsourced models gaining traction?
Outsourced models offer expert regulatory compliance, advanced analytics, and lifecycle asset management that many organisations cannot achieve with in-house teams.
How are energy price fluctuations affecting facility management contracts?
Volatile tariffs complicate guaranteed-savings clauses, prompting FM providers to include energy-risk-sharing models and renewable energy solutions in contracts.
Which end-user segment is expanding fastest through 2031?
Institutional and public infrastructure facilities, buoyed by government rail and hospital projects, are projected to grow at a 3.18% CAGR.
Page last updated on:


