| Study Period | 2017 - 2029 |
| Base Year For Estimation | 2023 |
| Forecast Data Period | 2024 - 2029 |
| Market Size (2024) | USD 532.59 Million |
| Market Size (2029) | USD 706.15 Million |
| CAGR (2024 - 2029) | 5.80 % |
| Market Concentration | High |
Major Players*Disclaimer: Major Players sorted in no particular order |

Australia Engineering Plastics Market Analysis
The Australia Engineering Plastics Market size is estimated at 532.59 million USD in 2024, and is expected to reach 706.15 million USD by 2029, growing at a CAGR of 5.80% during the forecast period (2024-2029).
Australia's engineering plastics industry is undergoing significant transformation driven by substantial infrastructure investments and manufacturing initiatives. The government has committed AUD 218 billion towards major infrastructure projects between 2021-2025, creating robust demand for engineering plastics across various applications. Additionally, under the 'Modern Manufacturing Initiative,' the government has allocated USD 871 million to enhance domestic manufacturing capabilities, aiming to reduce import dependency and strengthen local production capabilities. This focus on manufacturing self-sufficiency is particularly significant considering that imports currently account for approximately 80% of the country's plastic products.
The packaging sector continues to dominate the engineering plastics landscape, driven by evolving consumer preferences and sustainability initiatives. In 2022, packaging applications accounted for 46% of the total volume share, with PET emerging as the predominant resin type holding a 99% volume share in this sector. The industry is witnessing a significant shift towards sustainable practices, with the government setting ambitious targets to recycle 70% of plastic waste by 2050, prompting manufacturers to innovate and adapt their production processes accordingly.
The electrical and electronics sector has emerged as a crucial growth driver, accounting for 29% of the total engineering plastics consumption volume in 2022. This substantial market presence is supported by over 660 significant public infrastructure projects in the pipeline, many of which require advanced electronic components and systems. The sector's growth is further amplified by increasing domestic production of consumer electronics and the ongoing digital transformation across industries, necessitating high-performance industrial plastics components.
The aerospace segment is experiencing remarkable advancement in engineering plastics adoption, evidenced by an 8.16% increase in aircraft parts production revenue in 2022. This growth is primarily attributed to the country's strategic focus on developing domestic aerospace manufacturing capabilities. Boeing's initiative to produce the Loyal Wingman, an Australian-developed UAV platform, marks a significant milestone as the company's first aircraft developed outside the United States, demonstrating Australia's growing prominence in aerospace manufacturing and creating new opportunities for performance plastics applications.
Australia Engineering Plastics Market Trends
Consumer electronics to drive the growth
- The electrical and electronics production revenue declined significantly each year from 2017 to 2019, resulting in a 53.61% decline in the production value. This decline was attributed to the high cost of production, unavailability of cheap labor, and the shifting of electrical & electronics production to countries like Vietnam, India, and other ASEAN countries.
- As a result of the pandemic, the country faced several challenges in 2020. However, electrical and electronics production revenue increased by 5.88% compared to the previous year, owing to increased demand due to work-from-home execution, thus increasing the output by the end of the year. In 2021, manufacturing output reached a value of USD 64.8 billion, a 157.13% increase from 2020. Electrical and electronics production revenue grew rapidly, owing to the high demand for consumer electronics such as mobile phones, laptops, and headsets. The revenue also increased with the growing trend of working and studying from home. Simultaneously, government initiatives helped to increase manufacturing activities in the country.
- The country is expected to increase the production of electrical and electronic equipment under its plan of developing and increasing manufacturing activities due to increased smart devices and domestic demand. The rise in demand for advanced technologies, such as digitalization, robotics, virtual reality, augmented reality, IoT (Internet of Things), and 5G connectivity, is expected to drive the market in the coming years. Owing to these technological advancements, the electrical and electronics production revenue is expected to reach USD 101 billion by 2029, 48.67% higher than in 2022, while recording a CAGR of 5.18% during the forecast period (2023-2029).

Understand The Key Trends Shaping This Market
Download PDF
OTHER KEY INDUSTRY TRENDS COVERED IN THE REPORT
- Local demand and fleet upgrades are likely to boost aerospace components production
- Growing investments and schemes to boost the growth
- Australia to meet local demand only through imports
- Australia launched a National Plastics Plan which promotes product stewardship through Recycling and Waste Reduction
- Australia had a recycling rate of 21% in 2019 with total PET waste accounting for 100 kilotons
- Low profitability of automotive production in the country to hold back growth
- Regulatory policies to hold back plastic packaging growth
- Resin prices to remain under the influence of crude oil prices
- Mechanical recycling of polycarbonates to be a challenge due to the poor quality of the recovered material
- Australia generated over 0.7 million tons of WEEE in2019 which could be an opportunity for manufacturers to produce R-ABS
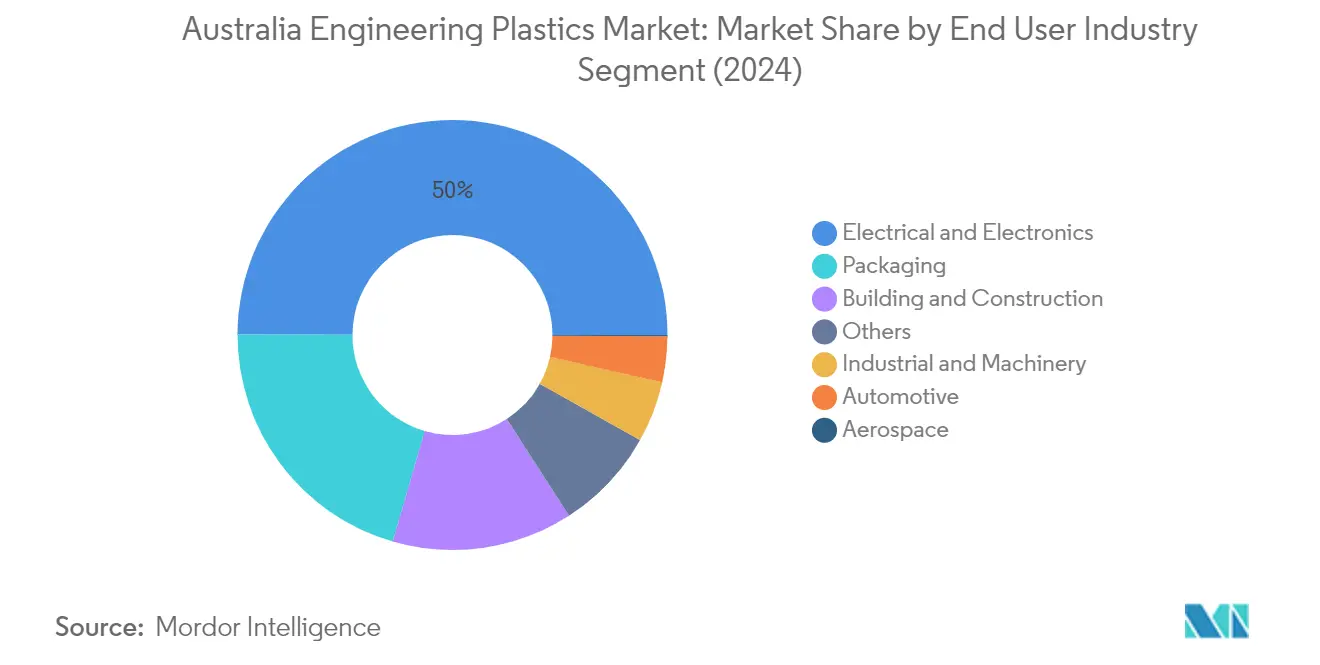
Segment Analysis: End User Industry
Electrical & Electronics Segment in Australia Engineering Plastics Market
The electrical and electronics industry dominates the Australian engineering plastics market, commanding approximately 50% of the total market value in 2024. This significant market share is primarily driven by the widespread applications of engineering plastics in various electronic components, including electrical insulation, wiring, switches, connectors, capacitors, printed circuit boards, integrated circuits, and semiconductors. The segment's dominance is further strengthened by the rising demand for smart electrical devices and attractive home appliances in the region, coupled with the growing trend of digitalization, robotics, virtual reality, augmented reality, IoT (Internet of Things), and 5G connectivity applications.
Aerospace Segment in Australia Engineering Plastics Market
The aerospace plastics segment is emerging as the fastest-growing sector in the Australian engineering plastics market, projected to expand at a rate of approximately 9% during 2024-2029. This remarkable growth is primarily attributed to the increasing adoption of lightweight and high-impact resistant composite plastics to replace traditional metal parts in aircraft manufacturing. The segment's growth is further supported by the government's focus on improving local aircraft manufacturing and repair services, along with ongoing airline fleet upgrades. Aerospace plastics are extensively used in aircraft interiors, including wall panels, fuselages, airflow ducting, luggage compartments, and aircraft doors, as reduced overall weight directly impacts an aircraft's effectiveness and performance.
Remaining Segments in End User Industry
The remaining segments in the Australian engineering plastics market include packaging, building and construction, automotive, and industrial machinery sectors. The packaging segment maintains a strong presence due to the rising demand for sustainable and durable packaging solutions in food and beverage applications. The building and construction sector utilizes polycarbonate and other thermoplastic compounds for their durability and corrosion resistance properties in various applications. The automotive plastics segment continues to drive demand through applications in dashboards, handles, carburetors, and engine components. The industrial machinery sector leverages industrial plastics for their superior mechanical properties and chemical resistance in various manufacturing applications.
Segment Analysis: Resin Type
PET Segment in Australia Engineering Plastics Market
Polyethylene terephthalate (PET) maintains its dominant position in the Australian engineering plastics market, commanding approximately 48% of the total market volume in 2024. This substantial market share is primarily driven by PET's extensive applications in the packaging industry, particularly in beverage bottles and food containers. The material's key properties, including recyclability, cost-effectiveness, and excellent barrier properties against moisture and gases, have made it the preferred choice for manufacturers. The growing emphasis on sustainable packaging solutions and the material's ability to be recycled multiple times without significant degradation of properties has further strengthened its market position. Additionally, PET's widespread use in thermoformed sheets, films, and other packaging applications continues to drive its consumption across various end-user industries in Australia.
Styrene Copolymers Segment in Australia Engineering Plastics Market
The styrene copolymers (ABS plastic and SAN) segment is emerging as the fastest-growing category in the Australian engineering plastics market, projected to expand at approximately a 6% volume growth rate during 2024-2029. This remarkable growth is attributed to the increasing adoption of these materials in various high-performance applications, particularly in the electrical and electronics industry. The superior properties of ABS plastic and SAN, including high impact strength, chemical resistance, and excellent surface finish, make them ideal for manufacturing consumer electronics, automotive plastics, and household appliances. The segment's growth is further supported by technological advancements in manufacturing processes, leading to enhanced material properties and expanded application possibilities. The rising demand for lightweight and durable materials in the automotive and consumer goods sectors is also contributing to the accelerated growth of styrene copolymers in the Australian market.
Remaining Segments in Resin Type
The Australian engineering plastics market encompasses several other significant resin types, including polycarbonate (PC), polymethyl methacrylate (PMMA), polyamides (PA), polybutylene terephthalate (PBT), and various other specialty resins. Polycarbonate maintains a strong presence due to its exceptional impact resistance and optical clarity, making it crucial for automotive plastics and construction applications. PMMA's transparency and weather resistance properties have established its importance in construction and automotive applications. Polyamides are valued for their mechanical strength and heat resistance, particularly in automotive and industrial applications. The diversity of these segments contributes to the market's robustness, with each resin type serving specific industrial requirements and contributing to technological advancement across various sectors.
Australia Engineering Plastics Industry Overview
Top Companies in Australia Engineering Plastics Market
The engineering plastics market in Australia is characterized by companies focusing heavily on product innovation and sustainable solutions to maintain their competitive edge. Major players are expanding their portfolios through the development of eco-friendly grades, including bio-based and recycled content materials, particularly in response to growing environmental concerns. Companies are demonstrating operational agility by strengthening their distribution networks and forming strategic partnerships with local distributors to ensure reliable supply chains across the country. Strategic moves in the market primarily revolve around acquisitions to broaden product portfolios and gain access to new technologies, while also investing in research and development to create specialized grades for emerging applications in the electronics and automotive sectors. Market leaders are also expanding their manufacturing capabilities in the Asia-Pacific region to better serve the Australian market and reduce delivery times.
Consolidated Market Led By Global Players
The Australian engineering plastics market exhibits a highly consolidated structure dominated by global chemical conglomerates with established manufacturing capabilities in the Asia-Pacific region. These multinational corporations leverage their extensive research and development capabilities, established distribution networks, and economies of scale to maintain their market positions. The market is characterized by the absence of local manufacturing facilities, making it entirely dependent on imports from regional production hubs, particularly from countries like China, Japan, and South Korea.
The market has witnessed significant merger and acquisition activities, particularly among global players seeking to strengthen their position in the Asia-Pacific region. These strategic moves are primarily aimed at acquiring complementary technologies, expanding product portfolios, and gaining access to established distribution networks. The consolidation trend is expected to continue as companies seek to achieve greater operational efficiency and market reach through strategic partnerships and acquisitions, while also investing in sustainable solutions and innovative products.
Innovation and Sustainability Drive Future Success
For incumbent players to maintain and increase their market share, focusing on sustainable product development and innovative solutions will be crucial. Companies need to invest in developing bio-based and recycled content materials while also expanding their product portfolios to address emerging applications in key end-user industries. Building strong relationships with distributors and maintaining reliable supply chains will be essential for success, as will the ability to provide technical support and customized solutions to meet specific customer requirements.
New entrants and contenders in the market face significant challenges due to the consolidated nature of the industry and the strong presence of established global players. Success will depend on their ability to identify and serve niche markets, develop innovative products for specific applications, and establish strong distribution partnerships. Companies must also consider potential regulatory changes regarding environmental sustainability and recycling requirements, while maintaining focus on end-user industries with growing demand, such as electronics and automotive sectors. The ability to offer competitive pricing while maintaining product quality will be crucial for gaining market share in this import-dependent market. Additionally, the development of specialty plastics and advanced polymers can provide a competitive edge in addressing specific customer needs in the electronics and automotive sectors.
Australia Engineering Plastics Market Leaders
-
Arkema
-
BASF SE
-
Covestro AG
-
LANXESS
-
SABIC
- *Disclaimer: Major Players sorted in no particular order

Need More Details on Market Players and Competiters?
Download PDF
Australia Engineering Plastics Market News
- February 2023: Covestro AG introduced Makrolon 3638 polycarbonate for healthcare and life sciences applications such as drug delivery devices, wellness and wearable devices, and single-use containers for biopharmaceutical manufacturing.
- October 2022: BASF SE introduced two new sustainable POM products, Ultraform LowPCF (Low Product Carbon Footprint) and Ultraform BMB (Biomass Balance), to reduce the carbon footprint, save fossil resources, and support the reduction of greenhouse gas (GHG) emissions.
- September 2022: LANXESS introduced a sustainable polyamide resin, Durethan ECO, which consists of recycled fibers made from waste glass to reduce its carbon footprint.
Free With This Report
We provide a complimentary and exhaustive set of data points on global and regional metrics that present the fundamental structure of the industry. Presented in the form of 15+ free charts, the section covers rare data on various end-user production trends including passenger vehicle production, commercial vehicle production, motorcycle production, aerospace components production, electrical and electronics production, and regional data for engineering plastics demand etc.


Australia Engineering Plastics Market Report - Table of Contents
1. EXECUTIVE SUMMARY & KEY FINDINGS
2. REPORT OFFERS
3. INTRODUCTION
- 3.1 Study Assumptions & Market Definition
- 3.2 Scope of the Study
- 3.3 Research Methodology
4. KEY INDUSTRY TRENDS
-
4.1 End User Trends
- 4.1.1 Aerospace
- 4.1.2 Automotive
- 4.1.3 Building and Construction
- 4.1.4 Electrical and Electronics
- 4.1.5 Packaging
- 4.2 Import And Export Trends
- 4.3 Price Trends
-
4.4 Recycling Overview
- 4.4.1 Polyamide (PA) Recycling Trends
- 4.4.2 Polycarbonate (PC) Recycling Trends
- 4.4.3 Polyethylene Terephthalate (PET) Recycling Trends
- 4.4.4 Styrene Copolymers (ABS and SAN) Recycling Trends
-
4.5 Regulatory Framework
- 4.5.1 Australia
- 4.6 Value Chain & Distribution Channel Analysis
5. MARKET SEGMENTATION (includes market size in Value in USD and Volume, Forecasts up to 2029 and analysis of growth prospects)
-
5.1 End User Industry
- 5.1.1 Aerospace
- 5.1.2 Automotive
- 5.1.3 Building and Construction
- 5.1.4 Electrical and Electronics
- 5.1.5 Industrial and Machinery
- 5.1.6 Packaging
- 5.1.7 Other End-user Industries
-
5.2 Resin Type
- 5.2.1 Fluoropolymer
- 5.2.1.1 By Sub Resin Type
- 5.2.1.1.1 Ethylenetetrafluoroethylene (ETFE)
- 5.2.1.1.2 Fluorinated Ethylene-propylene (FEP)
- 5.2.1.1.3 Polytetrafluoroethylene (PTFE)
- 5.2.1.1.4 Polyvinylfluoride (PVF)
- 5.2.1.1.5 Polyvinylidene Fluoride (PVDF)
- 5.2.1.1.6 Other Sub Resin Types
- 5.2.2 Liquid Crystal Polymer (LCP)
- 5.2.3 Polyamide (PA)
- 5.2.3.1 By Sub Resin Type
- 5.2.3.1.1 Aramid
- 5.2.3.1.2 Polyamide (PA) 6
- 5.2.3.1.3 Polyamide (PA) 66
- 5.2.3.1.4 Polyphthalamide
- 5.2.4 Polybutylene Terephthalate (PBT)
- 5.2.5 Polycarbonate (PC)
- 5.2.6 Polyether Ether Ketone (PEEK)
- 5.2.7 Polyethylene Terephthalate (PET)
- 5.2.8 Polyimide (PI)
- 5.2.9 Polymethyl Methacrylate (PMMA)
- 5.2.10 Polyoxymethylene (POM)
- 5.2.11 Styrene Copolymers (ABS and SAN)
6. COMPETITIVE LANDSCAPE
- 6.1 Key Strategic Moves
- 6.2 Market Share Analysis
- 6.3 Company Landscape
-
6.4 Company Profiles (includes Global Level Overview, Market Level Overview, Core Business Segments, Financials, Headcount, Key Information, Market Rank, Market Share, Products and Services, and Analysis of Recent Developments).
- 6.4.1 Arkema
- 6.4.2 BASF SE
- 6.4.3 Covestro AG
- 6.4.4 INEOS
- 6.4.5 LANXESS
- 6.4.6 Mitsubishi Chemical Corporation
- 6.4.7 SABIC
- 6.4.8 The Chemours Company
- 6.4.9 Toray Industries, Inc.
- 6.4.10 UBE Corporation
7. KEY STRATEGIC QUESTIONS FOR ENGINEERING PLASTICS CEOS
8. APPENDIX
-
8.1 Global Overview
- 8.1.1 Overview
- 8.1.2 Porter’s Five Forces Framework (Industry Attractiveness Analysis)
- 8.1.3 Global Value Chain Analysis
- 8.1.4 Market Dynamics (DROs)
- 8.2 Sources & References
- 8.3 List of Tables & Figures
- 8.4 Primary Insights
- 8.5 Data Pack
- 8.6 Glossary of Terms
You Can Purchase Parts Of This Report. Check Out Prices For Specific Sections
Get Price Break-up Now
List of Tables & Figures
- Figure 1:
- PRODUCTION REVENUE OF AEROSPACE COMPONENTS, USD, AUSTRALIA, 2017 - 2029
- Figure 2:
- PRODUCTION VOLUME OF AUTOMOBILES, UNITS, AUSTRALIA, 2017 - 2029
- Figure 3:
- FLOOR AREA OF NEW CONSTRUCTION, SQUARE FEET, AUSTRALIA, 2017 - 2029
- Figure 4:
- PRODUCTION REVENUE OF ELECTRICAL AND ELECTRONICS, USD, AUSTRALIA, 2017 - 2029
- Figure 5:
- PRODUCTION VOLUME OF PLASTIC PACKAGING, TONS, AUSTRALIA, 2017 - 2029
- Figure 6:
- IMPORT REVENUE OF ENGINEERING PLASTICS BY RESIN TYPE, USD, AUSTRALIA, 2017 - 2021
- Figure 7:
- EXPORT REVENUE OF ENGINEERING PLASTICS BY RESIN TYPE, USD, AUSTRALIA, 2017 - 2021
- Figure 8:
- PRICE OF ENGINEERING PLASTICS BY RESIN TYPE, USD PER KG, AUSTRALIA, 2017 - 2021
- Figure 9:
- VOLUME OF ENGINEERING PLASTICS CONSUMED, TONS, AUSTRALIA, 2017 - 2029
- Figure 10:
- VALUE OF ENGINEERING PLASTICS CONSUMED, USD, AUSTRALIA, 2017 - 2029
- Figure 11:
- VOLUME OF ENGINEERING PLASTICS CONSUMED BY END USER INDUSTRY, TONS, AUSTRALIA, 2017 - 2029
- Figure 12:
- VALUE OF ENGINEERING PLASTICS CONSUMED BY END USER INDUSTRY, USD, AUSTRALIA, 2017 - 2029
- Figure 13:
- VOLUME SHARE OF ENGINEERING PLASTICS CONSUMED BY END USER INDUSTRY, %, AUSTRALIA, 2017, 2023, AND 2029
- Figure 14:
- VALUE SHARE OF ENGINEERING PLASTICS CONSUMED BY END USER INDUSTRY, %, AUSTRALIA, 2017, 2023, AND 2029
- Figure 15:
- VOLUME OF ENGINEERING PLASTICS CONSUMED IN AEROSPACE INDUSTRY, TONS, AUSTRALIA, 2017 - 2029
- Figure 16:
- VALUE OF ENGINEERING PLASTICS CONSUMED IN AEROSPACE INDUSTRY, USD, AUSTRALIA, 2017 - 2029
- Figure 17:
- VALUE SHARE OF ENGINEERING PLASTICS CONSUMED IN AEROSPACE INDUSTRY BY RESIN TYPE, %, AUSTRALIA, 2022 VS 2029
- Figure 18:
- VOLUME OF ENGINEERING PLASTICS CONSUMED IN AUTOMOTIVE INDUSTRY, TONS, AUSTRALIA, 2017 - 2029
- Figure 19:
- VALUE OF ENGINEERING PLASTICS CONSUMED IN AUTOMOTIVE INDUSTRY, USD, AUSTRALIA, 2017 - 2029
- Figure 20:
- VALUE SHARE OF ENGINEERING PLASTICS CONSUMED IN AUTOMOTIVE INDUSTRY BY RESIN TYPE, %, AUSTRALIA, 2022 VS 2029
- Figure 21:
- VOLUME OF ENGINEERING PLASTICS CONSUMED IN BUILDING AND CONSTRUCTION INDUSTRY, TONS, AUSTRALIA, 2017 - 2029
- Figure 22:
- VALUE OF ENGINEERING PLASTICS CONSUMED IN BUILDING AND CONSTRUCTION INDUSTRY, USD, AUSTRALIA, 2017 - 2029
- Figure 23:
- VALUE SHARE OF ENGINEERING PLASTICS CONSUMED IN BUILDING AND CONSTRUCTION INDUSTRY BY RESIN TYPE, %, AUSTRALIA, 2022 VS 2029
- Figure 24:
- VOLUME OF ENGINEERING PLASTICS CONSUMED IN ELECTRICAL AND ELECTRONICS INDUSTRY, TONS, AUSTRALIA, 2017 - 2029
- Figure 25:
- VALUE OF ENGINEERING PLASTICS CONSUMED IN ELECTRICAL AND ELECTRONICS INDUSTRY, USD, AUSTRALIA, 2017 - 2029
- Figure 26:
- VALUE SHARE OF ENGINEERING PLASTICS CONSUMED IN ELECTRICAL AND ELECTRONICS INDUSTRY BY RESIN TYPE, %, AUSTRALIA, 2022 VS 2029
- Figure 27:
- VOLUME OF ENGINEERING PLASTICS CONSUMED IN INDUSTRIAL AND MACHINERY INDUSTRY, TONS, AUSTRALIA, 2017 - 2029
- Figure 28:
- VALUE OF ENGINEERING PLASTICS CONSUMED IN INDUSTRIAL AND MACHINERY INDUSTRY, USD, AUSTRALIA, 2017 - 2029
- Figure 29:
- VALUE SHARE OF ENGINEERING PLASTICS CONSUMED IN INDUSTRIAL AND MACHINERY INDUSTRY BY RESIN TYPE, %, AUSTRALIA, 2022 VS 2029
- Figure 30:
- VOLUME OF ENGINEERING PLASTICS CONSUMED IN PACKAGING INDUSTRY, TONS, AUSTRALIA, 2017 - 2029
- Figure 31:
- VALUE OF ENGINEERING PLASTICS CONSUMED IN PACKAGING INDUSTRY, USD, AUSTRALIA, 2017 - 2029
- Figure 32:
- VALUE SHARE OF ENGINEERING PLASTICS CONSUMED IN PACKAGING INDUSTRY BY RESIN TYPE, %, AUSTRALIA, 2022 VS 2029
- Figure 33:
- VOLUME OF ENGINEERING PLASTICS CONSUMED IN OTHER END-USER INDUSTRIES INDUSTRY, TONS, AUSTRALIA, 2017 - 2029
- Figure 34:
- VALUE OF ENGINEERING PLASTICS CONSUMED IN OTHER END-USER INDUSTRIES INDUSTRY, USD, AUSTRALIA, 2017 - 2029
- Figure 35:
- VALUE SHARE OF ENGINEERING PLASTICS CONSUMED IN OTHER END-USER INDUSTRIES INDUSTRY BY RESIN TYPE, %, AUSTRALIA, 2022 VS 2029
- Figure 36:
- VOLUME OF ENGINEERING PLASTICS CONSUMED BY RESIN TYPE, TONS, AUSTRALIA, 2017 - 2029
- Figure 37:
- VALUE OF ENGINEERING PLASTICS CONSUMED BY RESIN TYPE, USD, AUSTRALIA, 2017 - 2029
- Figure 38:
- VOLUME SHARE OF ENGINEERING PLASTICS CONSUMED BY RESIN TYPE, %, AUSTRALIA, 2017, 2023, AND 2029
- Figure 39:
- VALUE SHARE OF ENGINEERING PLASTICS CONSUMED BY RESIN TYPE, %, AUSTRALIA, 2017, 2023, AND 2029
- Figure 40:
- VOLUME OF FLUOROPOLYMER CONSUMED BY SUB RESIN TYPE, TONS, AUSTRALIA, 2017 - 2029
- Figure 41:
- VALUE OF FLUOROPOLYMER CONSUMED BY SUB RESIN TYPE, USD, AUSTRALIA, 2017 - 2029
- Figure 42:
- VOLUME SHARE OF FLUOROPOLYMER CONSUMED BY SUB RESIN TYPE, %, AUSTRALIA, 2017, 2023, AND 2029
- Figure 43:
- VALUE SHARE OF FLUOROPOLYMER CONSUMED BY SUB RESIN TYPE, %, AUSTRALIA, 2017, 2023, AND 2029
- Figure 44:
- VOLUME OF ETHYLENETETRAFLUOROETHYLENE (ETFE) CONSUMED, TONS, AUSTRALIA, 2017 - 2029
- Figure 45:
- VALUE OF ETHYLENETETRAFLUOROETHYLENE (ETFE) CONSUMED, USD, AUSTRALIA, 2017 - 2029
- Figure 46:
- VALUE SHARE OF ETHYLENETETRAFLUOROETHYLENE (ETFE) CONSUMED BY END USER INDUSTRY, %, AUSTRALIA, 2022 VS 2029
- Figure 47:
- VOLUME OF FLUORINATED ETHYLENE-PROPYLENE (FEP) CONSUMED, TONS, AUSTRALIA, 2017 - 2029
- Figure 48:
- VALUE OF FLUORINATED ETHYLENE-PROPYLENE (FEP) CONSUMED, USD, AUSTRALIA, 2017 - 2029
- Figure 49:
- VALUE SHARE OF FLUORINATED ETHYLENE-PROPYLENE (FEP) CONSUMED BY END USER INDUSTRY, %, AUSTRALIA, 2022 VS 2029
- Figure 50:
- VOLUME OF POLYTETRAFLUOROETHYLENE (PTFE) CONSUMED, TONS, AUSTRALIA, 2017 - 2029
- Figure 51:
- VALUE OF POLYTETRAFLUOROETHYLENE (PTFE) CONSUMED, USD, AUSTRALIA, 2017 - 2029
- Figure 52:
- VALUE SHARE OF POLYTETRAFLUOROETHYLENE (PTFE) CONSUMED BY END USER INDUSTRY, %, AUSTRALIA, 2022 VS 2029
- Figure 53:
- VOLUME OF POLYVINYLFLUORIDE (PVF) CONSUMED, TONS, AUSTRALIA, 2017 - 2029
- Figure 54:
- VALUE OF POLYVINYLFLUORIDE (PVF) CONSUMED, USD, AUSTRALIA, 2017 - 2029
- Figure 55:
- VALUE SHARE OF POLYVINYLFLUORIDE (PVF) CONSUMED BY END USER INDUSTRY, %, AUSTRALIA, 2022 VS 2029
- Figure 56:
- VOLUME OF POLYVINYLIDENE FLUORIDE (PVDF) CONSUMED, TONS, AUSTRALIA, 2017 - 2029
- Figure 57:
- VALUE OF POLYVINYLIDENE FLUORIDE (PVDF) CONSUMED, USD, AUSTRALIA, 2017 - 2029
- Figure 58:
- VALUE SHARE OF POLYVINYLIDENE FLUORIDE (PVDF) CONSUMED BY END USER INDUSTRY, %, AUSTRALIA, 2022 VS 2029
- Figure 59:
- VOLUME OF OTHER SUB RESIN TYPES CONSUMED, TONS, AUSTRALIA, 2017 - 2029
- Figure 60:
- VALUE OF OTHER SUB RESIN TYPES CONSUMED, USD, AUSTRALIA, 2017 - 2029
- Figure 61:
- VALUE SHARE OF OTHER SUB RESIN TYPES CONSUMED BY END USER INDUSTRY, %, AUSTRALIA, 2022 VS 2029
- Figure 62:
- VOLUME OF LIQUID CRYSTAL POLYMER (LCP) CONSUMED, TONS, AUSTRALIA, 2017 - 2029
- Figure 63:
- VALUE OF LIQUID CRYSTAL POLYMER (LCP) CONSUMED, USD, AUSTRALIA, 2017 - 2029
- Figure 64:
- VALUE SHARE OF LIQUID CRYSTAL POLYMER (LCP) CONSUMED BY END USER INDUSTRY, %, AUSTRALIA, 2022 VS 2029
- Figure 65:
- VOLUME OF POLYAMIDE (PA) CONSUMED BY SUB RESIN TYPE, TONS, AUSTRALIA, 2017 - 2029
- Figure 66:
- VALUE OF POLYAMIDE (PA) CONSUMED BY SUB RESIN TYPE, USD, AUSTRALIA, 2017 - 2029
- Figure 67:
- VOLUME SHARE OF POLYAMIDE (PA) CONSUMED BY SUB RESIN TYPE, %, AUSTRALIA, 2017, 2023, AND 2029
- Figure 68:
- VALUE SHARE OF POLYAMIDE (PA) CONSUMED BY SUB RESIN TYPE, %, AUSTRALIA, 2017, 2023, AND 2029
- Figure 69:
- VOLUME OF ARAMID CONSUMED, TONS, AUSTRALIA, 2017 - 2029
- Figure 70:
- VALUE OF ARAMID CONSUMED, USD, AUSTRALIA, 2017 - 2029
- Figure 71:
- VALUE SHARE OF ARAMID CONSUMED BY END USER INDUSTRY, %, AUSTRALIA, 2022 VS 2029
- Figure 72:
- VOLUME OF POLYAMIDE (PA) 6 CONSUMED, TONS, AUSTRALIA, 2017 - 2029
- Figure 73:
- VALUE OF POLYAMIDE (PA) 6 CONSUMED, USD, AUSTRALIA, 2017 - 2029
- Figure 74:
- VALUE SHARE OF POLYAMIDE (PA) 6 CONSUMED BY END USER INDUSTRY, %, AUSTRALIA, 2022 VS 2029
- Figure 75:
- VOLUME OF POLYAMIDE (PA) 66 CONSUMED, TONS, AUSTRALIA, 2017 - 2029
- Figure 76:
- VALUE OF POLYAMIDE (PA) 66 CONSUMED, USD, AUSTRALIA, 2017 - 2029
- Figure 77:
- VALUE SHARE OF POLYAMIDE (PA) 66 CONSUMED BY END USER INDUSTRY, %, AUSTRALIA, 2022 VS 2029
- Figure 78:
- VOLUME OF POLYPHTHALAMIDE CONSUMED, TONS, AUSTRALIA, 2017 - 2029
- Figure 79:
- VALUE OF POLYPHTHALAMIDE CONSUMED, USD, AUSTRALIA, 2017 - 2029
- Figure 80:
- VALUE SHARE OF POLYPHTHALAMIDE CONSUMED BY END USER INDUSTRY, %, AUSTRALIA, 2022 VS 2029
- Figure 81:
- VOLUME OF POLYBUTYLENE TEREPHTHALATE (PBT) CONSUMED, TONS, AUSTRALIA, 2017 - 2029
- Figure 82:
- VALUE OF POLYBUTYLENE TEREPHTHALATE (PBT) CONSUMED, USD, AUSTRALIA, 2017 - 2029
- Figure 83:
- VALUE SHARE OF POLYBUTYLENE TEREPHTHALATE (PBT) CONSUMED BY END USER INDUSTRY, %, AUSTRALIA, 2022 VS 2029
- Figure 84:
- VOLUME OF POLYCARBONATE (PC) CONSUMED, TONS, AUSTRALIA, 2017 - 2029
- Figure 85:
- VALUE OF POLYCARBONATE (PC) CONSUMED, USD, AUSTRALIA, 2017 - 2029
- Figure 86:
- VALUE SHARE OF POLYCARBONATE (PC) CONSUMED BY END USER INDUSTRY, %, AUSTRALIA, 2022 VS 2029
- Figure 87:
- VOLUME OF POLYETHER ETHER KETONE (PEEK) CONSUMED, TONS, AUSTRALIA, 2017 - 2029
- Figure 88:
- VALUE OF POLYETHER ETHER KETONE (PEEK) CONSUMED, USD, AUSTRALIA, 2017 - 2029
- Figure 89:
- VALUE SHARE OF POLYETHER ETHER KETONE (PEEK) CONSUMED BY END USER INDUSTRY, %, AUSTRALIA, 2022 VS 2029
- Figure 90:
- VOLUME OF POLYETHYLENE TEREPHTHALATE (PET) CONSUMED, TONS, AUSTRALIA, 2017 - 2029
- Figure 91:
- VALUE OF POLYETHYLENE TEREPHTHALATE (PET) CONSUMED, USD, AUSTRALIA, 2017 - 2029
- Figure 92:
- VALUE SHARE OF POLYETHYLENE TEREPHTHALATE (PET) CONSUMED BY END USER INDUSTRY, %, AUSTRALIA, 2022 VS 2029
- Figure 93:
- VOLUME OF POLYIMIDE (PI) CONSUMED, TONS, AUSTRALIA, 2017 - 2029
- Figure 94:
- VALUE OF POLYIMIDE (PI) CONSUMED, USD, AUSTRALIA, 2017 - 2029
- Figure 95:
- VALUE SHARE OF POLYIMIDE (PI) CONSUMED BY END USER INDUSTRY, %, AUSTRALIA, 2022 VS 2029
- Figure 96:
- VOLUME OF POLYMETHYL METHACRYLATE (PMMA) CONSUMED, TONS, AUSTRALIA, 2017 - 2029
- Figure 97:
- VALUE OF POLYMETHYL METHACRYLATE (PMMA) CONSUMED, USD, AUSTRALIA, 2017 - 2029
- Figure 98:
- VALUE SHARE OF POLYMETHYL METHACRYLATE (PMMA) CONSUMED BY END USER INDUSTRY, %, AUSTRALIA, 2022 VS 2029
- Figure 99:
- VOLUME OF POLYOXYMETHYLENE (POM) CONSUMED, TONS, AUSTRALIA, 2017 - 2029
- Figure 100:
- VALUE OF POLYOXYMETHYLENE (POM) CONSUMED, USD, AUSTRALIA, 2017 - 2029
- Figure 101:
- VALUE SHARE OF POLYOXYMETHYLENE (POM) CONSUMED BY END USER INDUSTRY, %, AUSTRALIA, 2022 VS 2029
- Figure 102:
- VOLUME OF STYRENE COPOLYMERS (ABS AND SAN) CONSUMED, TONS, AUSTRALIA, 2017 - 2029
- Figure 103:
- VALUE OF STYRENE COPOLYMERS (ABS AND SAN) CONSUMED, USD, AUSTRALIA, 2017 - 2029
- Figure 104:
- VALUE SHARE OF STYRENE COPOLYMERS (ABS AND SAN) CONSUMED BY END USER INDUSTRY, %, AUSTRALIA, 2022 VS 2029
- Figure 105:
- MOST ACTIVE COMPANIES BY NUMBER OF STRATEGIC MOVES, AUSTRALIA, 2019 - 2021
- Figure 106:
- MOST ADOPTED STRATEGIES, COUNT, AUSTRALIA, 2019 - 2021
- Figure 107:
- REVENUE SHARE OF ENGINEERING PLASTICS BY MAJOR PLAYERS, %, AUSTRALIA, 2022
Australia Engineering Plastics Industry Segmentation
Aerospace, Automotive, Building and Construction, Electrical and Electronics, Industrial and Machinery, Packaging are covered as segments by End User Industry. Fluoropolymer, Liquid Crystal Polymer (LCP), Polyamide (PA), Polybutylene Terephthalate (PBT), Polycarbonate (PC), Polyether Ether Ketone (PEEK), Polyethylene Terephthalate (PET), Polyimide (PI), Polymethyl Methacrylate (PMMA), Polyoxymethylene (POM), Styrene Copolymers (ABS and SAN) are covered as segments by Resin Type.| End User Industry | Aerospace | |||
| Automotive | ||||
| Building and Construction | ||||
| Electrical and Electronics | ||||
| Industrial and Machinery | ||||
| Packaging | ||||
| Other End-user Industries | ||||
| Resin Type | Fluoropolymer | By Sub Resin Type | Ethylenetetrafluoroethylene (ETFE) | |
| Fluorinated Ethylene-propylene (FEP) | ||||
| Polytetrafluoroethylene (PTFE) | ||||
| Polyvinylfluoride (PVF) | ||||
| Polyvinylidene Fluoride (PVDF) | ||||
| Other Sub Resin Types | ||||
| Liquid Crystal Polymer (LCP) | ||||
| Polyamide (PA) | By Sub Resin Type | Aramid | ||
| Polyamide (PA) 6 | ||||
| Polyamide (PA) 66 | ||||
| Polyphthalamide | ||||
| Polybutylene Terephthalate (PBT) | ||||
| Polycarbonate (PC) | ||||
| Polyether Ether Ketone (PEEK) | ||||
| Polyethylene Terephthalate (PET) | ||||
| Polyimide (PI) | ||||
| Polymethyl Methacrylate (PMMA) | ||||
| Polyoxymethylene (POM) | ||||
| Styrene Copolymers (ABS and SAN) | ||||
Need A Different Region or Segment?
Customize Now
Market Definition
- End-user Industry - Packaging, Electrical & Electronics, Building & Construction, and Others are the end-user industries considered under the engineering plastics market.
- Resin - Under the scope of the study, consumption of virgin resins like Fluoropolymer, Polycarbonate, Polyethylene Terephthalate, Polybutylene Terephthalate, Polyoxymethylene, Polymethyl Methacrylate, Styrene Copolymers, Liquid Crystal Polymer, Polyether Ether Ketone, Polyimide, and Polyamide in the primary forms are considered. Recycling has been provided separately under its individual chapter.
| Keyword | Definition |
|---|---|
| Acetal | This is a rigid material that has a slippery surface. It can easily withstand wear and tear in abusive work environments. This polymer is used for building applications such as gears, bearings, valve components, etc. |
| Acrylic | This synthetic resin is a derivative of acrylic acid. It forms a smooth surface and is mainly used for various indoor applications. The material can also be used for outdoor applications with a special formulation. |
| Cast film | A cast film is made by depositing a layer of plastic onto a surface then solidifying and removing the film from that surface. The plastic layer can be in molten form, in a solution, or in dispersion. |
| Colorants & Pigments | Colorants & Pigments are additives used to change the color of the plastic. They can be a powder or a resin/color premix. |
| Composite material | A composite material is a material that is produced from two or more constituent materials. These constituent materials have dissimilar chemical or physical properties and are merged to create a material with properties unlike the individual elements. |
| Degree of Polymerization (DP) | The number of monomeric units in a macromolecule, polymer, or oligomer molecule is referred to as the degree of polymerization or DP. Plastics with useful physical properties often have DPs in the thousands. |
| Dispersion | To create a suspension or solution of material in another substance, fine, agglomerated solid particles of one substance are dispersed in a liquid or another substance to form a dispersion. |
| Fiberglass | Fiberglass-reinforced plastic is a material made up of glass fibers embedded in a resin matrix. These materials have high tensile and impact strength. Handrails and platforms are two examples of lightweight structural applications that use standard fiberglass. |
| Fiber-reinforced polymer (FRP) | Fiber-reinforced polymer is a composite material made of a polymer matrix reinforced with fibers. The fibers are usually glass, carbon, aramid, or basalt. |
| Flake | This is a dry, peeled-off piece, usually with an uneven surface, and is the base of cellulosic plastics. |
| Fluoropolymers | This is a fluorocarbon-based polymer with multiple carbon-fluorine bonds. It is characterized by high resistance to solvents, acids, and bases. These materials are tough yet easy to machine. Some of the popular fluoropolymers are PTFE, ETFE, PVDF, PVF, etc. |
| Kevlar | Kevlar is the commonly referred name for aramid fiber, which was initially a Dupont brand for aramid fiber. Any group of lightweight, heat-resistant, solid, synthetic, aromatic polyamide materials that are fashioned into fibers, filaments, or sheets is called aramid fiber. They are classified into Para-aramid and Meta-aramid. |
| Laminate | A structure or surface composed of sequential layers of material bonded under pressure and heat to build up to the desired shape and width. |
| Nylon | They are synthetic fiber-forming polyamides formed into yarns and monofilaments. These fibers possess excellent tensile strength, durability, and elasticity. They have high melting points and can resist chemicals and various liquids. |
| PET preform | A preform is an intermediate product that is subsequently blown into a polyethylene terephthalate (PET) bottle or a container. |
| Plastic compounding | Compounding consists of preparing plastic formulations by mixing and/or blending polymers and additives in a molten state to achieve the desired characteristics. These blends are automatically dosed with fixed setpoints usually through feeders/hoppers. |
| Plastic pellets | Plastic pellets, also known as pre-production pellets or nurdles, are the building blocks for nearly every product made of plastic. |
| Polymerization | It is a chemical reaction of several monomer molecules to form polymer chains that form stable covalent bonds. |
| Styrene Copolymers | A copolymer is a polymer derived from more than one species of monomer, and a styrene copolymer is a chain of polymers consisting of styrene and acrylate. |
| Thermoplastics | Thermoplastics are defined as polymers that become soft material when it is heated and becomes hard when it is cooled. Thermoplastics have wide-ranging properties and can be remolded and recycled without affecting their physical properties. |
| Virgin Plastic | It is a basic form of plastic that has never been used, processed, or developed. It may be considered more valuable than recycled or already used materials. |
Need More Details on Market Definition?
Ask a Question
Research Methodology
Mordor Intelligence follows a four-step methodology in all our reports.
- Step-1: Identify Key Variables: The quantifiable key variables (industry and extraneous) pertaining to the specific product segment and country are selected from a group of relevant variables & factors based on desk research & literature review; along with primary expert inputs. These variables are further confirmed through regression modeling (wherever required).
- Step-2: Build a Market Model: In order to build a robust forecasting methodology, the variables and factors identified in Step-1 are tested against available historical market numbers. Through an iterative process, the variables required for market forecast are set and the model is built on the basis of these variables.
- Step-3: Validate and Finalize: In this important step, all market numbers, variables and analyst calls are validated through an extensive network of primary research experts from the market studied. The respondents are selected across levels and functions to generate a holistic picture of the market studied.
- Step-4: Research Outputs: Syndicated Reports, Custom Consulting Assignments, Databases & Subscription Platforms

Get More Details On Research Methodology
Download PDF


