
Market Overview
| Study Period | 2022 - 2031 |
|---|---|
| Forecast Data Period | 2026 - 2031 |
| Historical Data Period | 2022 - 2024 |
| Growth Rate | 26.79 % |
| Market Concentration | Medium |
Major Players *Disclaimer: Major Players sorted in no particular order Image © Mordor Intelligence. Reuse requires attribution under CC BY 4.0. | |
Australia Energy Storage Systems (ESS) Market Analysis by Mordor Intelligence
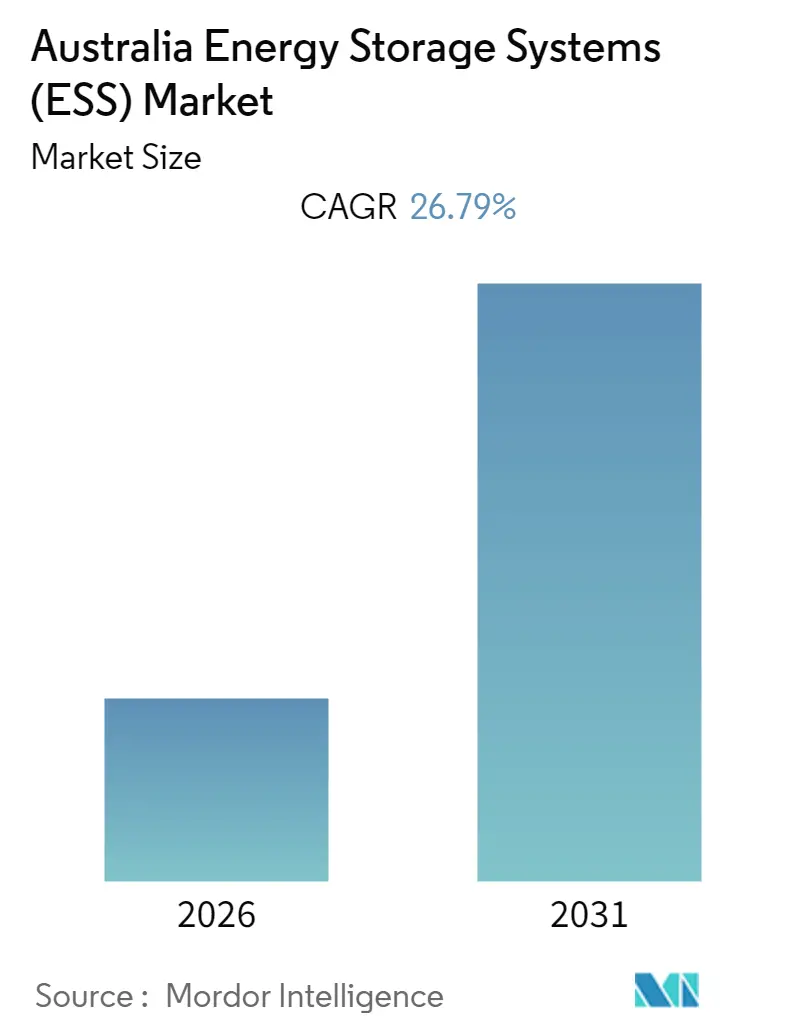
The Australia Energy Storage Systems (ESS) Market size is expected to register a CAGR of 26.79% during the forecast period.
Although the market studied was affected by the COVID-19 pandemic in 2020, it recovered and reached pre-pandemic levels.
The decrease in prices of batteries and rapid adoption of renewable energy supported by government initiatives are expected to drive the growth of the market studied during the forecast period.
However, high initial capital requirements, along with the high cost of the components, are anticipated to restrain the demand for energy storage from the residential and small-scale commercial sectors, thus, inhibiting the growth of the market studied.
The development of new advanced batteries and the increasing commercialization of compressed air energy storage (CAES) technology is expected to create several opportunities for Australian energy storage systems (ESS) providers.
Note: Market size and forecast figures in this report are generated using Mordor Intelligence’s proprietary estimation framework, updated with the latest available data and insights as of 2026.
Australia Energy Storage Systems (ESS) Market Trends and Insights
Battery Energy Storage Systems (BESS) Expected to Witness Significant Growth
Battery energy storage is considered a critical technology in transitioning to a sustainable energy system. The battery energy storage systems regulate voltage and frequency, reduce peak demand charges, integrate renewable sources, and provide a backup power supply. Batteries are crucial in energy storage systems and are responsible for around 60% of the system's total cost.
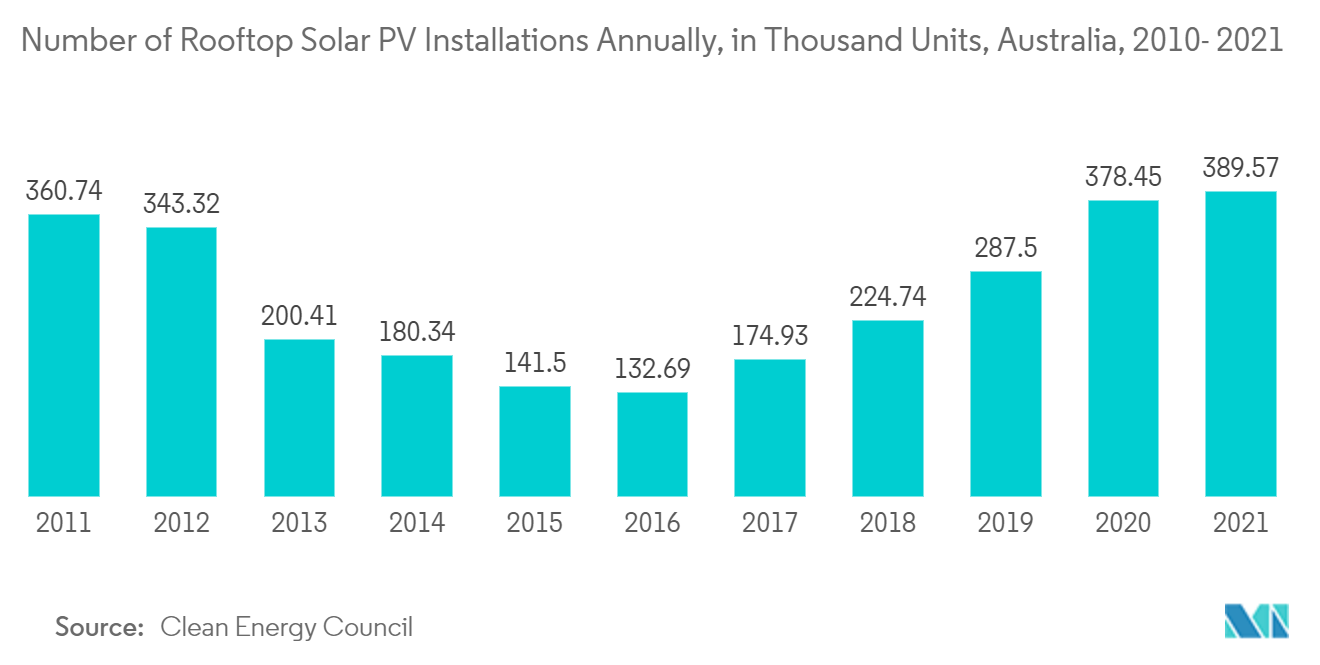
In 2021, the country witnessed significant growth in rooftop solar PV installations. The number of solar PV installations increased from 378.45 thousand units in 2020 to 389.57 thousand units in 2021, a growth of more than 2.5%.
Due to declining prices, lithium-ion batteries have been witnessing a massive demand in the Australian BESS market. Lithium-ion batteries are expected to hold the most significant share in the battery energy storage market, as they require less maintenance, are lightweight, have a reliable cycle life, and have high energy density in terms of volume and high charge/discharge efficiency.
According to the Clean Energy Council, in 2021, 34,731 energy storage batteries with a combined capacity of 347 MWh were installed in Australia, witnessing a growth of 45.7% compared to 2020.
According to Clean Energy Council, there were 30 large-scale batteries under construction by the end of 2021, representing more than 921 MW of new storage capacity. The battery energy storage systems use utility grids to supply electricity to consumers, reducing energy bills. The battery energy storage systems used in utilities are a cost-effective alternative to conventional infrastructure, especially in helping substations and transmission and distribution (T&D) lines meet the growing demand. These factors are contributing to the growth of the BESS market in Australia.
For instance, in February 2021, CEP Energy announced the largest proposed grid-scale battery project in Australia, with a rated output of up to 1,200 MW. The construction of the grid was anticipated to begin in early 2022 and is expected to be in operation by 2023. Thus, upcoming projects in Australia are expected to boost the demand for battery energy storage systems (BESS) during the forecast period.
Therefore, based on the above factors, battery energy storage systems (BESS) are expected to witness significant demand in the country during the forecast period.
Growing Renewable Energy Sector Expected to Drive the Market
Renewable power is an intermittent energy source. Therefore, electricity storage is essential to maintain the constant power distribution of generated renewable power. Thus, compared to conventional electricity generation sources, renewable power has a higher need for energy storage.
The cost of renewable power generation in Australia is continuously declining, mainly for solar power. The primary reasons behind the declining costs of renewable power generation are innovations in the manufacturing and installation of PV power generation, improved wind turbine materials and designs, and economies of scale. Due to lower costs, renewable energy is becoming competitive and cheaper than conventional power plants.
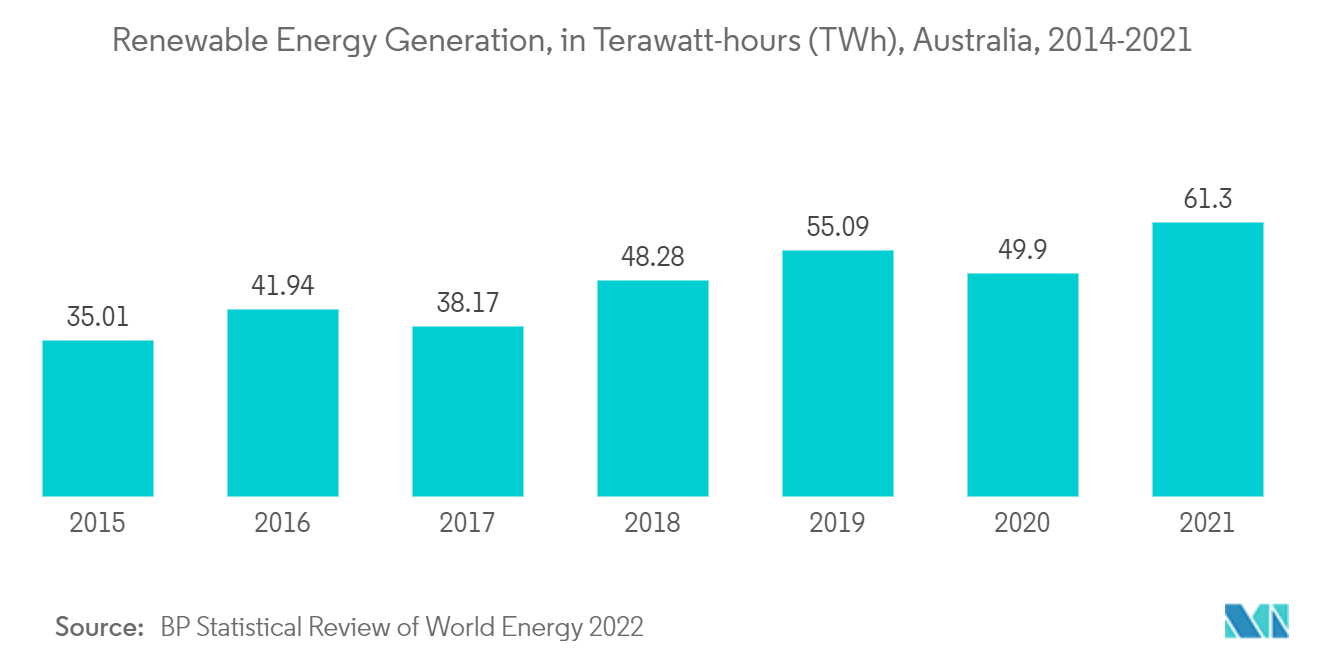
As of 2021, renewable energy sources accounted for 10.3% of Australian energy consumption. In 2021, Australia's renewable electricity generation was about 61.3 TWh, 22.84% higher than the entire renewable electricity generation in 2020. In 2021, 22.9% of Australia's total electricity generation was from renewable energy sources, including solar (9%), wind (9%), and hydro (6%).
The renewables share in Australia's National Electricity Market (NEM) power generation mix is expected to double to 41% by 2030. With the growing share of renewables, the demand for energy storage applications is also expected to grow during the forecast period.
The country's government and the major private players are focusing on developing large-utility-scale renewable power projects. The large-scale solar sector's momentum witnessed 1.2 GW capacity installations in 2021, increasing the total large-scale solar capacity to more than 5.1 GW. The large-scale solar industry is expected to perform strongly in the next couple of years, with 42 large-scale solar farms under construction at the end of 2021.
Therefore, growth in the renewable energy sector with government assistance is expected to drive the energy storage systems market's growth during the forecast period.
Regulatory Landscape
Australia's ESS participation framework continues to evolve through Australian Energy Market Commission (AEMC) rule changes and Australian Energy Market Operator (AEMO) implementation programs. Storage assets, including batteries and pumped hydro, are exempt from the Retailer Reliability Obligation (RRO) effective 3 December 2024, and the National Electricity Market (NEM) participant framework includes the Integrated Resource Provider (IRP) category to accommodate bi-directional resources such as storage, hybrids, and aggregators.
In 2026, rulemaking and procedures focused on access standards and system services. The Renewable Energy Legislation Amendment (2026 Measures No. 1) Regulations 2026 (registered February 2026) introduced changes affecting solar-connected batteries certified on or after 1 May 2026, while AEMO's Wholesale Electricity Market (WEM) Supplementary Essential System Service Mechanism (SESSM) procedure became effective on 30 January 2026. In March 2026, AEMC published a draft determination for the National Electricity Amendment (Improving the NEM access standards, Package 2), proposing to extend technical access standard visibility requirements to all Schedule 5 Participants. Separately, AEMO's May 2026 NEM Reform Program Industry Status Report tracked go-live planning through late 2026 for integrating price-responsive resources, shaping how storage and aggregators participate in dispatch and bidding.
Value Chain Analysis
The Australia ESS value chain spans upstream inputs (cells, modules, electrolyte materials for alternative chemistries, power electronics, and balance-of-plant) through system integration, EPC, grid connection, commissioning, and long-life operations and service. Technology and integration are provided by global OEMs and integrators, alongside local system providers and installers serving residential and C&I segments. Utility-scale projects also depend on grid studies, inverter and protection settings, and compliance testing aligned to NEM and WEM technical requirements.
Project origination and financing are increasingly influenced by public procurement and underwriting mechanisms, which affect downstream contracting and bankability. In June 2026, the federal Capacity Investment Scheme (CIS) selected 15 battery projects totaling 4.2 GW / 16.1 GWh, reinforcing a pipeline of four-hour class assets while tightening expectations around connection readiness, delivery schedules, and performance. State and federal policy settings also shape permitting and compliance workload. For example, Queensland's State code 27 for battery storage facility development became effective on 12 December 2025 for larger projects, and federal amendments effective 1 January 2026 removed electricity used for energy storage from being treated as a relevant acquisition under the Renewable Energy (Electricity) Act 2000, reducing compliance frictions for grid-scale charging and discharging operations.
Competitive Landscape
The Australian energy storage systems (ESS) market is moderately fragmented. Some of the major players in the market (in no particular order) include Pacific Green Technologies Group, LG Energy Solution Ltd, Tesla Inc., Century Yuasa Batteries Pty Ltd, and EVO Power Pty Ltd, among others.
Australia Energy Storage Systems (ESS) Industry Leaders
-
Pacific Green Technologies Group
-
LG Energy Solution Ltd
-
Tesla Inc.
-
EVO Power Pty Ltd
-
Century Yuasa Batteries Pty Ltd
- *Disclaimer: Major Players sorted in no particular order
_Market.webp)
Market Opportunities and Future Outlook
Large-scale procurement programs and system planning targets create near-term space for developers, integrators, and service providers focused on connection-ready, bankable projects. AEMO's 2026 Integrated System Plan (published June 2026) set out a total storage requirement of 40 GW by 2050 (35 GW short and medium duration plus 5 GW long duration). In parallel, the federal Capacity Investment Scheme storage-only tender results in June 2026 awarded 15 projects totaling 4.2 GW and about 16.2 GWh. Together, these steps support increased contracting activity across EPC, grid connection services, inverter and controls tuning, and long-term O&M for utility-scale BESS.
Opportunities are also developing around grid integration, long-duration technologies, and domestic capability building aligned to government strategies and programs. NSW's target of a minimum 28 GWh of long-duration storage by 31 December 2033 (including 16 GWh by 2029) is pulling demand toward technologies and project designs beyond two-hour systems, and toward dispatch optimization capabilities that can capture multiple revenue streams. On the delivery side, Origin Energy's Mortlake BESS development documentation (300 MW/650 MWh, February 2026) highlights the role of specialist engineering, approvals, and connection milestone management. Policy initiatives such as the National Battery Strategy and ARENA storage programs also continue to support commercialization pathways and supply chain development for batteries and related components within Australia.
Recent Industry Developments
- June 2026: Pacific Green Technologies Group received planning approval from the Victorian Government for the Nine Mile Energy Park, comprising two grid-scale BESS units sized 250 MW/500 MWh and 250 MW/1,000 MWh. The approval advances a multi-stage development into a more financeable, execution-ready position and adds competitive pressure in Victoria for utility-scale storage sites with grid access.
- June 2026: The Australian Government announced the results of Capacity Investment Scheme (CIS) Tender 8, selecting 15 storage projects totaling 4.2 GW/16.1 GWh across the National Electricity Market. The tender outcome reinforces procurement momentum for four-hour batteries and tightens the focus on developers and suppliers that can meet schedule, connection, and performance requirements at scale.
- August 2025: Pacific Green Technologies Group signed a commitment agreement with ZEN Energy covering 10-year tolling arrangements across three BESS projects in Victoria, New South Wales, and Queensland totaling 1.5 GWh. The arrangement strengthens revenue visibility for multiple assets and supports a portfolio approach to financing and delivery rather than single-project execution.
Research Methodology Framework and Report Scope
Market Definition and Coverage
For this methodology, the Australia energy storage systems market is the total revenue generated from energy storage systems deployed in Australia, where value is linked to the system sale and integration for storage used across residential, commercial, industrial, and utility applications.
Scope exclusions: We exclude upstream raw material mining and general power equipment that does not provide energy storage functionality.
Segmentation Overview
- By Type
- Battery Energy Storage System (BESS)
- Pumped-storage Hydroelectricity (PSH)
- Other Types
- By End User
- Residential
- Commercial and Industrial
- Utility Scale
Data Sources, Market Sizing, and Validation
Desk Research
Desk research was used to build the first structure of the market and to keep assumptions tied to observable energy system activity in Australia. We referred to public sources such as the Australian Energy Regulator (market outcomes and reliability signals), the Australian Energy Market Operator (system planning and storage related updates), the Clean Energy Council (project activity snapshots), and the Australian Bureau of Statistics (macro series that help normalize investment cycles).
To convert activity into market value, we also used supporting evidence from sources such as government policy and tender announcements, grid connection and commissioning updates published by market bodies, and company annual reports and investor presentations for spend patterns and project timing. Where a specific datapoint needed a cross-check (for example, import flows for battery packs or major equipment), we used an import export shipment-level database and a company financials and intelligence subscription to confirm directionally consistent ranges. The desk sources listed here are illustrative, and many other public references were also used during data collection, validation, and clarification.
Primary Interviews and Surveys
Primary work focused on validating what is actually getting built and monetized in Australia, because storage pipelines and announcements can move quickly. We spoke with a mix of system developers, integrators, EPC related stakeholders, utilities, and large customer groups to confirm typical pricing movements, average project durations, and how revenue is recognized across residential and large-scale deployments.
Distribution of primary research fieldwork respondents
| Company type | Respondent position |
|---|---|
| Top tier: 35% | CXOs: 16% |
| Mid tier: 48% | Functional/Unit leaders: 29% |
| Smaller Players: 17% | Managers: 55% |
Market-Sizing & Forecasting
Sizing was built using a top-down and bottom-up approach, where the main value model starts from Australia storage deployment signals and is then reconciled with supplier and channel checks. For the top-down side, we reconstructed annual demand by tracking utility-scale storage additions, behind-the-meter adoption trends, and project milestones (financial close, construction, commissioning) and then applied price and system cost ranges that were verified through interviews.
To keep the totals realistic, we corroborated the outcome with selective bottom-up approximations, such as sampling typical system pricing by duration and application, and then scaling by observed project volumes and expected commissioning timing. Inputs that mattered most included installed and committed MW and MWh, typical storage duration mixes, EPC and integration cost share shifts, timing lags between commitment and energization, and the effect of ancillary service and capacity mechanisms on the build-out pace. When direct value data was missing for a sub-area, the gap was handled using range-based unit economics tied to project type, followed by conservative adjustments after validation.
For forecasting, scenario analysis was used to reflect uncertainty in connection queues, policy support, and wholesale price volatility, and then a base case was selected based on the most repeated view from primary respondents. The forecast also reflects expected learning curve pricing for batteries and balance-of-system costs, while ensuring results still align with independent grid development signals.
Data Validation & Update Cycle
Results were checked through multiple passes, where we compared modeled market value against independent signals such as annual storage additions, major project commissioning timelines, and public investment commitments. If an outlier showed up (for example, a sudden jump tied to one large project), the underlying drivers were rechecked and respondents were recontacted to confirm whether timing or pricing assumptions had shifted.
Before sign-off, the model is reviewed by another analyst to test sensitivity around the main variables, and then the narrative is aligned to the same assumptions used in the numbers. Reports are refreshed annually, and interim updates are made when material events occur, such as major policy changes or large project cancellations. Right before delivery, we do a final data pass so clients receive the latest updated view.
Mordor Intelligence's Australia Energy Storage Systems Market Size Measured Against Other Published Estimates
Published market values for energy storage in Australia can differ widely, even when the topic name looks similar. The biggest reasons are usually the included technologies, whether the estimate is counting full system revenue or only hardware, and how project timing is treated when a large pipeline exists.
In this study, gaps typically come from whether pumped storage is included alongside battery systems, whether residential installs are counted consistently, and how multi-year utility projects are recognized across the build period. Some publishers also apply fixed exchange rates or older system price points, which can overstate or understate the value when costs move fast, and these differences will naturally widen the spread.
Benchmark comparison
| Source | Market Size | Gaps in Research Methodology |
|---|---|---|
| Mordor Intelligence | USD 3.59 B (2026) | |
| Industry Association A | USD 2.46 B (2024) | Often reported as annual investment tied to projects reaching financial commitment, which can miss revenue recognized during construction and can undercount smaller behind-the-meter installs. |
| Trade Journal B | USD 50.00 B (2025) | Commonly presented as a forward pipeline investment potential, which is not the same as realized market revenue and can include uncommitted projects and broad cost assumptions. |
The table shows that one set of numbers is tied to committed annual investment and another is tied to pipeline potential, so they are not measuring the same thing as a revenue market size. By grounding the value in deployed systems and in-year revenue recognition rules, and then filtering out pipeline-only value, the estimate stays closer to what is actually monetized in Australia, which is the choice applied by Mordor Intelligence.
Key Questions Answered in the Report
What is the current Australia Energy Storage Systems (ESS) Market size?
The Australia Energy Storage Systems (ESS) Market is valued at USD 3.59 billion in 2026, and is projected to register a CAGR of 26.79% during the forecast period (2026-2031).
Who are the key players in Australia Energy Storage Systems (ESS) Market?
Pacific Green Technologies Group, LG Energy Solution Ltd, Tesla Inc., EVO Power Pty Ltd and Century Yuasa Batteries Pty Ltd are the major companies operating in the Australia Energy Storage Systems (ESS) Market.
What years does this Australia Energy Storage Systems (ESS) Market cover?
The report covers the Australia Energy Storage Systems (ESS) Market historical market size for years: 2022, 2023, 2024 and 2025. The report also forecasts the Australia Energy Storage Systems (ESS) Market size for years: 2026, 2027, 2028, 2029, 2030 and 2031.