
Market Overview
| Study Period | 2020 - 2031 |
|---|---|
| Forecast Data Period | 2026 - 2031 |
| Base Year Market Size (2025) | USD 88.89 Million |
| Market Size (2026) | USD 106.42 Million |
| Market Size (2031) | USD 219.87 Million |
| Growth Rate (2026 - 2031) | 15.62% CAGR |
| Market Concentration | Medium |
Major Players *Disclaimer: Major Players sorted in no particular order Image © Mordor Intelligence. Reuse requires attribution under CC BY 4.0. | |
Australia Emergency Lighting Market Analysis by Mordor Intelligence
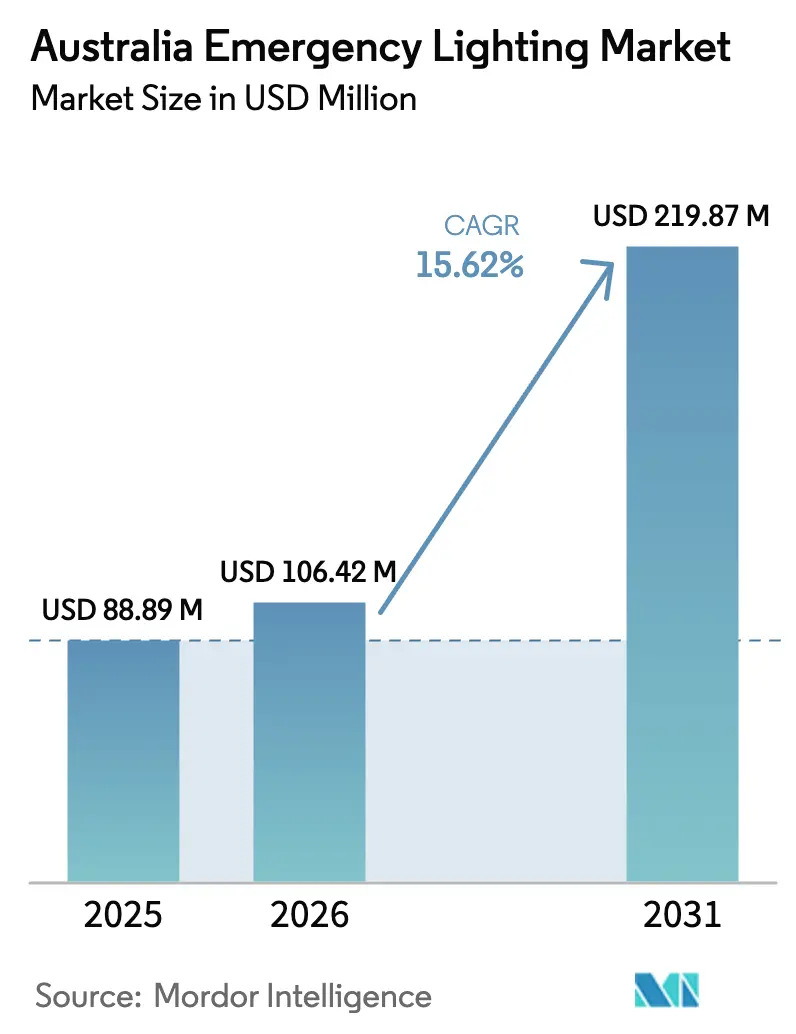
The Australia emergency lighting market size is projected to be USD 88.89 million in 2025, USD 106.42 million in 2026, and reach USD 219.87 million by 2031, growing at a CAGR of 15.62% from 2026 to 2031. A construction pipeline topping USD 77 billion, sweeping changes to AS/NZS 2293 and National Construction Code Part E4, and the 2025 phase-out of legacy lamps together underpin robust demand for compliant, energy-efficient systems. The Australia emergency lighting market is also benefiting from sustained retrofits in hospitals and build-to-rent towers, where operators view modern luminaires as low-risk ways to lift sustainability ratings and lower power bills. Competitive intensity has increased as global brands embed cloud dashboards and mesh networks into hardware, allowing them to defend share against price-driven importers. Meanwhile, lithium-iron phosphate batteries and IoT-enabled self-testing are becoming the default specifications in new tenders, reducing lifecycle costs and supporting the momentum of the Australian emergency lighting market.
Key Report Takeaways
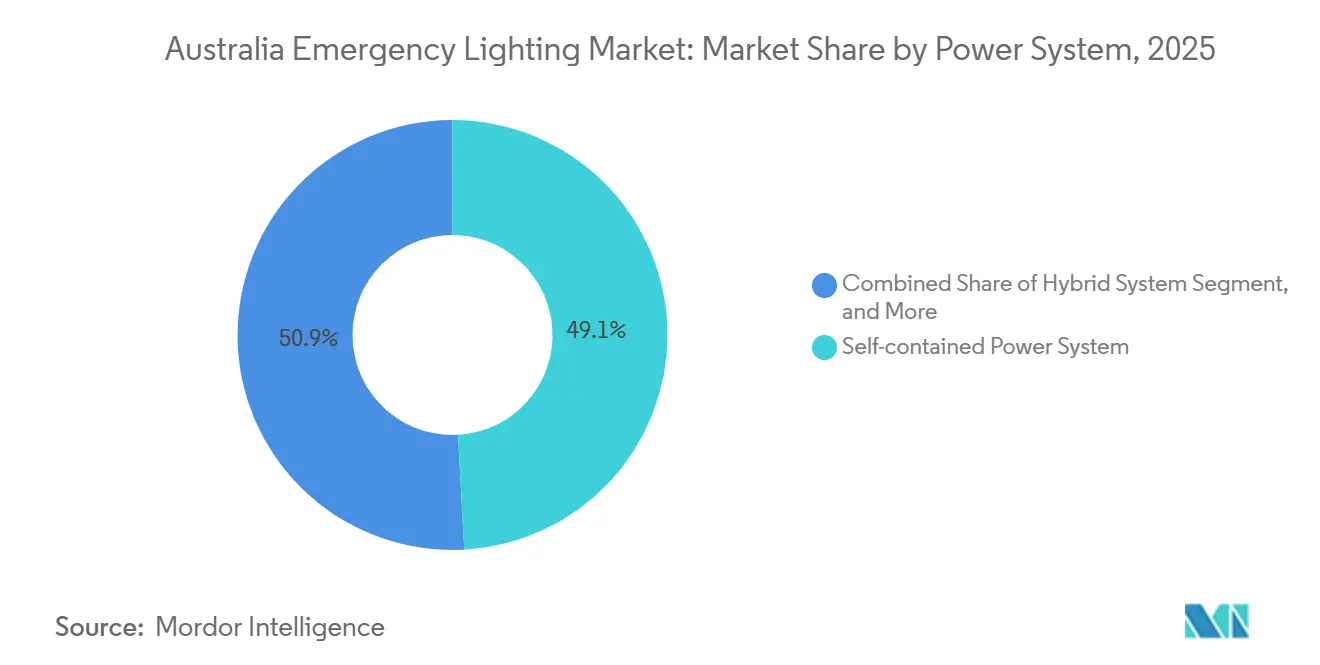
- By power system, self-contained luminaires led with 49.13% revenue share in 2025, while hybrid systems are projected to expand at a 16.22% CAGR through 2031.
- By 2025, LED products captured 79.26% of the Australia emergency lighting market share and are predicted to grow at a 16.29% CAGR through 2031.
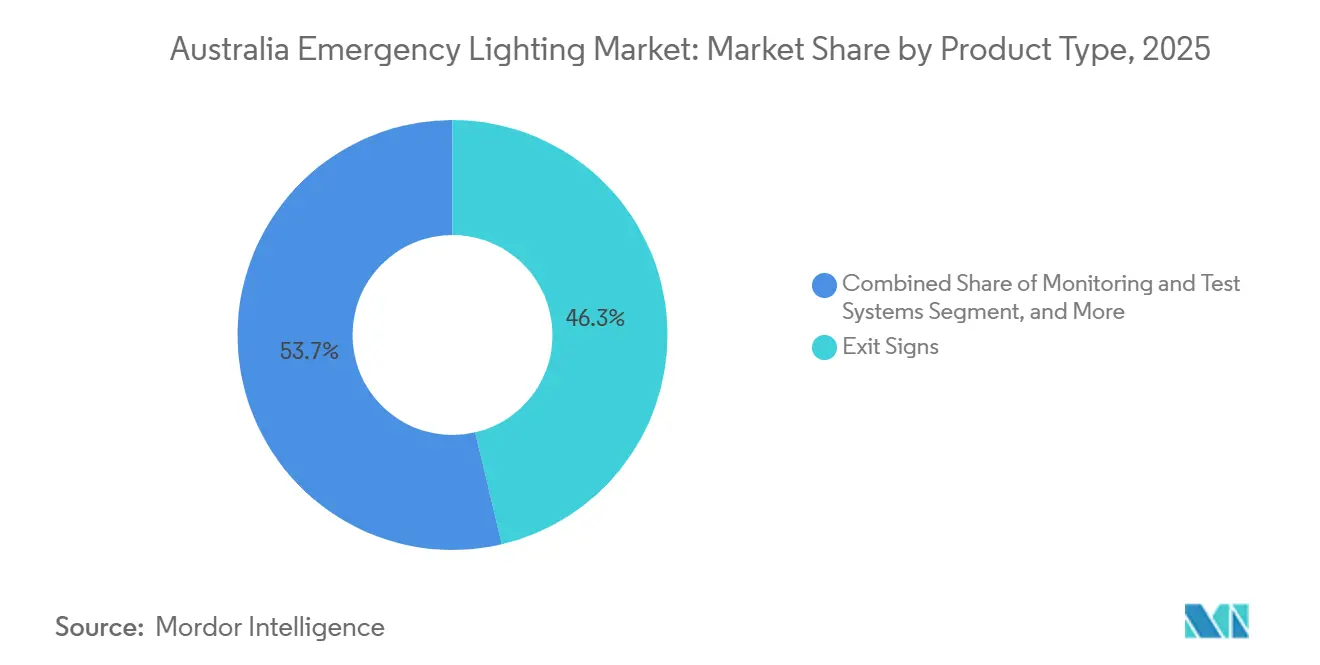
- By product type, exit signs accounted for 46.33% of the Australia emergency lighting market size in 2025, and monitoring and test systems are advancing at a 16.34% CAGR through 2031.
- By end-user vertical, commercial buildings accounted for 42.91% of demand in 2025, whereas public infrastructure and institutional projects recorded the fastest expansion at a 16.56% CAGR to 2031.
Note: Market size and forecast figures in this report are generated using Mordor Intelligence’s proprietary estimation framework, updated with the latest available data and insights as of January 2026.
Australia Emergency Lighting Market Trends and Insights
Drivers Impact Analysis*
| Driver | (~) % Impact on CAGR Forecast | Geographic Relevance | Impact Timeline |
|---|---|---|---|
| Stringent updates to AS/NZS 2293 and NCC E4 boosting compliance spending | +3.2% | National, with early gains in Sydney, Melbourne, Brisbane | Medium term (2-4 years) |
| Rising commercial construction and retrofit activity in urban centers | +2.8% | New South Wales, Victoria, Queensland | Short term (≤ 2 years) |
| Accelerated LED adoption driven by energy-efficiency mandates | +2.6% | National | Short term (≤ 2 years) |
| Emergence of IoT-enabled self-testing emergency luminaires in remote facilities | +2.1% | National, with concentration in multi-site commercial and industrial operators | Medium term (2-4 years) |
| Shift toward lithium-iron phosphate batteries to address high-ambient temperatures | +1.9% | National, particularly Northern Territory, Queensland, Western Australia | Medium term (2-4 years) |
| Public scrutiny of photoluminescent exit signs prompting electric sign retrofits | +1.6% | National, with accelerated activity in New South Wales and Victoria | Short term (≤ 2 years) |
| Source: Mordor Intelligence | |||
Stringent Updates to AS/NZS 2293 and NCC E4 Boosting Compliance Spending
Tighter clauses under AS/NZS 2293.2 and the 2022 NCC Part E4 require six-month functional tests, annual duration tests, and electronic certificates within seven days of service completion, driving a measurable uptick in compliance budgets.[1]Australian Building Codes Board, “National Construction Code 2022 Part E4,” abcb.gov.au Building owners risk penalties up to USD 550,000 for missed submissions, prompting widespread adoption of automated reporting software that ships with modern luminaires. Vendors offering cloud dashboards now bundle annual subscriptions that automatically archive test records, creating new annuity streams and boosting the value of the Australia emergency lighting market. Demand is especially strong among asset managers responsible for hundreds of small retail sites, where paper logbooks once made audits onerous. Local distributors confirm that automated systems outsell manual variants by a two-to-one margin in metropolitan projects started after 2025.
Rising Commercial Construction and Retrofit Activity in Urban Centers
Office and retail permits rebounded to USD 4.7 billion in June 2025, and landlords continue to refresh lighting to attract tenants amid elevated vacancy rates.[2]Australian Bureau of Statistics, “Building Activity, Australia,” abs.gov.au Build-to-rent projects totaling 44,139 units specify standardized exit signs and self-testing luminaires to streamline handover inspections. Institutional upgrades, notably the 4,100-square-meter Sydney Children’s Hospital Stage 1, require high-reliability circuits and networked testing that exceed base-code requirements. These big tickets flow directly into the Australia emergency lighting market, adding short-cycle orders for wiring accessories and batteries. Contractors also use lighting upgrades to demonstrate environmental gains and earn Green Star points, further accelerating retrofit schedules.
Accelerated LED Adoption Driven by Energy-Efficiency Mandates
The Greenhouse and Energy Minimum Standards determination outlawed incandescent and halogen lamps in October 2025, completing the technology pivot to LEDs.[3]Department of Climate Change Energy the Environment and Water, “GEMS Determination for LED Lamps 2025,” energy.gov.au A 20-watt LED batten consumes 120 kWh per year, compared with 300 kWh for a 50-watt fluorescent, resulting in a sub-three-year payback in most states. Longer lifespans, often above 50,000 hours, reduce maintenance calls, which is critical in labor-constrained regions such as Western Australia. Because LEDs are low-voltage by design, suppliers can incorporate microprocessors for self-testing and BLE or mesh radios without oversizing power supplies, reinforcing the Australia emergency lighting market’s tilt toward connected solutions. Many large builders now specify LEDs exclusively in project master plans, cementing the technology’s hold.
Emergence of IoT-Enabled Self-Testing Luminaires in Remote Facilities
Mesh-based platforms such as Zoneworks HIVE eliminate the need to dispatch electricians to dozens of distant locations, cutting travel costs that commonly exceed USD 1,000 per visit. The Interact Emergency Lighting System pushes real-time battery diagnostics to the cloud, giving corporate safety officers a single compliance dashboard for nationwide portfolios. Legrand’s Galaxy Range cuts commissioning time by half, encouraging facility managers to retrofit older high-rise cores without pulling new data cables. Adoption is fastest in mining camps and logistics depots, where mandatory testing burdens once made emergency lighting an operational headache. Vendor roadmaps now center on cybersecurity, following national guidance that calls for device encryption and strict network segmentation.
Restraints Impact Analysis*
| Restraint | (~) % Impact on CAGR Forecast | Geographic Relevance | Impact Timeline |
|---|---|---|---|
| High upfront cost of central battery systems for legacy buildings | -1.8% | National, with concentration in New South Wales and Victoria heritage buildings | Medium term (2-4 years) |
| Skilled labour shortage for compliance testing and documentation | -2.1% | National, with acute shortages in Western Australia and Northern Territory | Long term (≥ 4 years) |
| Supply chain volatility for lithium-ion cells after EV demand spikes | -1.4% | National | Short term (≤ 2 years) |
| Cybersecurity concerns slowing adoption of networked lighting controls | -1.2% | National, with heightened sensitivity in government and critical infrastructure sectors | Medium term (2-4 years) |
| Source: Mordor Intelligence | |||
Skilled Labor Shortage for Compliance Testing and Documentation
Australia faces a projected shortfall of 42,000 electricians over the next decade, limiting the number of contractors qualified to certify emergency systems. Western Australia alone needs 10,000 additional licenses by 2030, which could threaten inspection backlogs for remote facilities. Barriers remain high because state rules require public liability insurance and experienced technical supervisors, discouraging small firms from entering the segment. Although the National Productivity Fund promises unified licensing, implementation will be gradual. As a result, building owners increasingly adopt IoT luminaires that self-test and auto-file records, partially offsetting the labor constraint but highlighting its persistent drag on the Australia emergency lighting market.
High Upfront Cost of Central Battery Systems for Legacy Buildings
A mid-rise retrofit can exceed USD 100,000 when inverters, distribution panels, and fire-rated cabling are included, a figure many small landlords cannot quickly amortize. Heritage structures add complexity because invasive wiring risks asbestos discovery and fire-seal breaches, triggering expensive remediation. While lifecycle savings are attractive, most owners default to self-contained luminaires due to lower day-one costs, even though they accept higher future battery replacements. Financing tools remain scarce outside major public-private partnerships, limiting wider rollout. Consequently, central systems dominate only in new towers, capping their contribution to overall growth in the Australian emergency lighting market.
*Our forecasts treat driver/restraint impacts as directional, not additive. The impact forecasts reflect baseline growth, mix effects, and variable interactions.
Segment Analysis
By Power System: Hybrid Architectures Balance Capital and Maintenance
Hybrid solutions blend centralized battery racks in core zones with self-contained fittings at the perimeter, allowing developers to retrofit without full rewiring. In 2025, self-contained luminaires accounted for 49.13% of revenue, yet hybrid platforms are set to register a 16.22% CAGR, expanding their share of the Australia emergency lighting market over the forecast period. Contractors appreciate that hybrid wiring uses existing power circuits for outer areas while centralizing batteries where access is simpler. This mix lowers inspection time because a smaller pool of battery strings services hundreds of fittings, reducing lift callouts in multi-story assets.
Lifecycle optimization propels adoption. Lithium-iron phosphate packs housed in self-contained heads withstand 40 °C in plant rooms common in Queensland, while centralized inverters maintain optimal temperatures for longer runtimes in lower floors. Vendors such as Legrand tie both subsystems into a single web portal, so facility managers need just one compliance report. As license shortages deepen, owners regard automated hybrid dashboards as insurance against missed statutory tests, fueling the broader shift in the Australia emergency lighting market toward connected power topologies.


By Lighting Technology: LED Dominance Becomes Irrevocable
LED products already hold a 79.26% share, and continuous policy pressure cements their lead. The government ban on halogen and incandescent lamps in 2025 accelerated disposals of fluorescent battens, causing LED orders to spike across shopping malls, offices, and government facilities. Energy gains of roughly 60% boost payback narratives, and maintenance crews value 50,000-hour life ratings that align with five-year leasing cycles. Consequently, LEDs are included in virtually every new tender, locking in forward revenue for driver ICs, optics, and battery chemistries.
LED versatility is equally compelling. Because chips draw less current, manufacturers integrate self-test chips plus BLE or Thread radios without enlarging housings, aligning with AS/NZS 2293 photometric distribution charts. ABB, Haneco, and others advertise emergency-ready downlights and panels whose drivers automatically switch to 2-hour battery mode on mains loss, a mandatory clause under AS/NZS 2293.3. With R&D budgets flowing to smarter optics rather than fluorescents, the Australia emergency lighting market share of legacy lamps will steadily evaporate through 2031.
By Product Type: Monitoring Systems Surge as Digital Compliance Becomes Standard
Exit signs delivered 46.33% of 2025 revenue and remain the visual hallmark for egress, yet monitoring and test systems are the breakout category, advancing at a 16.34% CAGR. Software modules, gateways, or embedded radios now ship with most premium fittings, granting cloud visibility that audit teams demand. This digital layer transforms luminaires from one-time purchases into subscription-based products, a shift that expands the size of the Australian emergency lighting market in dollar terms.
Electric exit signs are also mid-upgrade. Photoluminescent products fell out of favor after luminance readings failed to meet AS/NZS thresholds, prompting LED retrofits across campuses in New South Wales and Victoria. Combining electric signage with mesh monitoring enables consolidated dashboards, so project managers increasingly bundle both categories in a single RFP. Over the forecast period, monitoring hardware and licenses are expected to outpace pure fixtures, driving higher average selling prices.
By End-User Vertical: Public Infrastructure Builds Momentum
Commercial properties accounted for 42.91% in 2025, but public infrastructure, hospitals, universities, and transit halls posted the fastest growth at a 16.56% CAGR. Health precincts like Randwick and Prince Charles Hospital include surgical suites that require higher illuminance and redundancy, increasing the bill-of-materials value. In addition, government projects specify lifetime digital logging to simplify regulator oversight, reinforcing demand for software layers.
Education and rail renovations follow similar paths. Schools moving to full-electric kitchens upgrade switchboards, triggering emergency lighting checks, while transport hubs migrate to lithium-iron phosphate packs that tolerate platform heat. Residential build-to-rent discussions increasingly embed standardized emergency kits, giving manufacturers repeat volume across multiple towers. Altogether, steady institutional budgets and safety-first procurement elevate public spending as a pivotal growth node for the Australia emergency lighting market.
Geography Analysis
New South Wales is the largest contributor to the Australia emergency lighting market, buoyed by rigorous electronic certification rules that came into force in March 2026. The eCert portal obliges contractors to upload compliance files within seven days, driving brisk orders for luminaires capable of exporting digital logs. Sydney’s multi-billion-dollar hospital upgrades and airport expansions further anchor statewide demand. Suppliers note that hybrid battery racks and IoT dashboards are now standard tender items on health projects.
Victoria and Queensland constitute the second tier. Melbourne landlords eager to cut 14.1% central business district vacancy rates favor LED retrofits to slash outgoings and entice tenants. Brisbane’s Prince Charles Hospital expansion and the Cross River Rail stations specify emergency fittings with wireless monitoring to minimize overnight inspection closures. These orders increase the size of the Australia emergency lighting market across both states and sustain distributor inventories even during seasonal lulls.
Western Australia and Northern Territory, though smaller in value, exhibit outsized growth because mining camps require self-testing luminaires to offset sparse electrician coverage. High ambient temperatures accelerate battery degradation, making lithium-iron phosphate chemistry a procurement staple. The Australian Capital Territory and South Australia represent niche opportunities tied to single mega-projects such as the Canberra Hospital Critical Services Building. Producers with nationwide warehouses, notably Haneco, leverage logistics reach to meet shorter lead-time expectations across dispersed locales.
Regulatory Landscape
Emergency lighting and exit signs in Australia are governed by the National Construction Code (NCC) and the AS/NZS 2293 series. The standards cover system design and installation (AS/NZS 2293.1), routine service and maintenance (AS/NZS 2293.2), and luminaire and exit sign performance and testing (AS/NZS 2293.3). NCC 2022 (Part E4) tightened documentation and testing expectations that are now appearing in project specifications, while state-level compliance processes such as New South Wales electronic certification (eCert) rules effective March 2026 reinforce a shift toward digitally reportable testing records.
On the product-safety side, emergency lighting equipment sold in Australia falls under the Electrical Equipment Safety System (EESS) framework, which requires registration and the Regulatory Compliance Mark (RCM) for in-scope equipment categories. Other electrical and building rules also feed into requirements for public facilities, including AS/NZS 3000 wiring rules and state public-building guidance, such as Western Australia requirements for electrical and lighting in public buildings. Together, these obligations raise the compliance workload for installers and maintenance providers and support adoption of self-testing and monitored systems that make evidence capture easier.
Value Chain Analysis
The value chain begins with component inputs such as LED modules, drivers and controls, optics, housings, and battery packs. It then moves through product engineering, compliance testing, and assembly by manufacturers, followed by distribution via electrical wholesalers and specialist distributors, and ultimately specification, installation, and ongoing inspection and maintenance by contractors. In Australia, the NCC requirements and the AS/NZS 2293 series shape upstream design choices, including photometrics, duration ratings, and test features, and they also drive downstream service obligations under AS/NZS 2293.2. That raises the importance of monitoring software, gateways, and data storage alongside luminaires and exit signs.
Industry participation includes global and local suppliers and specialist emergency-lighting firms. Associations such as Lighting Council Australia, IESANZ, and FPA Australia influence education and consultation around standards updates, including industry briefings on proposed AS/NZS 2293.1 changes during 2025. Service providers and installers sit at the demand interface, where skilled-labor availability and documentation requirements are steering portfolios toward networked and self-testing systems that reduce routine site visits and help streamline compliance record submission.
Competitive Landscape
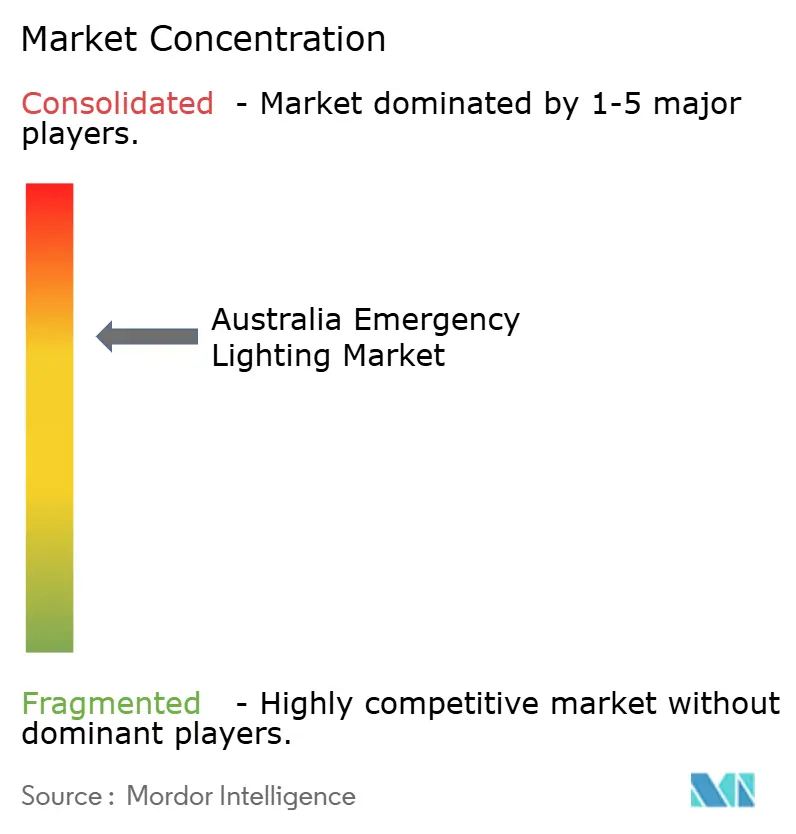
Competition remains moderate, with the top five players accounting for just over 50% of total revenue, yielding a mid-range concentration profile. Clevertronics differentiates through its Zoneworks HIVE mesh network, now deployed across more than 4,000 sites, and by licensing software on a per-node basis, which anchors customer lock-in. Signify leverages the Pierlite channel to push Interact dashboards into corporate portfolios; the company bundles cloud fees at discounted rates when bundled with bulkhead luminaires, driving multi-year contracts.
Legrand responds with Galaxy Range wireless panels that require no new control cabling, slashing retrofit downtime in high-rise offices. ABB addresses cost-sensitive owners via its Stanilite Economy range launched in 2025, pairing lithium-iron phosphate packs with simplified drivers to maintain code compliance at lower price points. Local brands Haneco and NHP exploit agile lead times and national wholesaler ties, targeting small contractors wary of overseas shipping delays.
Leading players in the cybersecurity market are actively promoting encrypted firmware and over-the-air patching solutions, which are designed to align with the stringent guidelines established by the Australian Cyber Security Centre. These advancements underscore the growing importance of secure-by-design principles in the industry. In contrast, midsized firms that fail to meet these standards are experiencing a significant erosion in their market share, as tenders increasingly prioritize compliance with secure-by-design requirements.
Australia Emergency Lighting Industry Leaders
Clevertronics Pty Ltd
ABB Ltd.
Legrand Australia Pty Ltd
Eaton Industries Pty Ltd
Haneco Lighting Australia Pty Ltd
- *Disclaimer: Major Players sorted in no particular order

Market Opportunities and Future Outlook
The clearest opportunity is in digital compliance and automation. NCC Part E4-aligned documentation practices and state e-certification workflows, including NSW eCert from March 2026, favor emergency lighting systems that can generate exportable test logs and electronic records on demand. This expands the addressable market beyond fixtures into monitoring and test systems, cloud dashboards, gateways, and lifecycle services, particularly for multi-site operators in retail, logistics, and public infrastructure where manual logbooks add audit friction.
There is also ongoing whitespace in mapping emergency lighting portfolios to broader energy-efficiency and sustainability procurement pathways, even though emergency lighting can be treated differently within commercial energy provisions. NCC 2025 energy-efficiency materials published in June 2026 note exclusions under Part J7. In parallel, the Greenhouse and Energy Minimum Standards (LED Lamps) Determination 2025 commenced on 3 March 2026, which sets higher compliance expectations across the wider lighting supply chain and encourages suppliers to standardize on higher-performance LED platforms. With the NSW Energy Savings Scheme settings changing as the Commercial Lighting Energy Savings Formula ends on 31 March 2026, suppliers can reposition retrofit value propositions toward compliance risk reduction, reduced maintenance burden via self-testing, and portfolio-level reporting, rather than relying on incentive-led economics.
Recent Industry Developments
- June 2026: Legrand Australia launched its Integrated Satellite emergency lighting range, using a single-body design with 75% recycled plastic content and lower product weight versus earlier designs. The update targets faster installation and reduced materials intensity, positioning emergency fittings for sustainability-driven procurement in commercial and institutional projects.
- December 2025: The New South Wales Government confirmed mandatory use of the eCert portal from 1 March 2026, with fines up to USD 550,000 for late compliance submissions. This increased the value of luminaires and monitoring systems that can produce digital test records and shorten administrative cycles for contractors managing large site portfolios.
- October 2025: Legrand Australia introduced the Galaxy Range wireless monitoring platform, positioning it as delivering significantly faster commissioning than wired systems. Wireless monitoring supports retrofit feasibility in occupied buildings by reducing cabling work and helping owners maintain AS/NZS 2293 testing evidence with less on-site labor.


Research Methodology Framework and Report Scope
Market Definition and Coverage
For this methodology, the market covers revenues from emergency lighting products installed in Australia to provide illumination and exit guidance when mains power fails, across new builds and retrofit projects.
Scope exclusions: Decorative or general lighting that does not provide emergency backup function, and standalone consumer flashlights or torches, are not counted.
Segmentation Overview
- By Power System
- Self-contained Power System
- Central Battery System
- Hybrid System
- By Lighting Technology
- LED
- Fluorescent
- Other Lighting Technologies
- By Product Type
- Exit Signs
- Emergency Luminaires
- Monitoring and Test Systems
- By End-user Vertical
- Residential
- Commercial
- Industrial
- Public Infrastructure and Institutional
Data Sources, Market Sizing, and Validation
Desk Research
Desk work starts by mapping the demand pool for compliant emergency lighting in Australia and the main places it gets installed. We referenced public inputs such as the National Construction Code (including Part E4) and AS-NZS 2293 guidance summaries, along with Australian Bureau of Statistics building and construction statistics and state building regulator publications for safety and compliance context.
To translate activity into a value model, we also reviewed sources such as trade and procurement notices, customs and import statistics for relevant lighting and battery categories, and peer reviewed papers on LED and battery performance that inform replacement cycles. Company annual reports, investor presentations, and reputable trade press were used to cross-check pricing direction and channel dynamics, and patent databases were used to spot technology shifts in monitoring and test systems. The desk sources listed above are illustrative only, and additional public and paid sources were consulted as needed for data collection, validation, and clarification.
Primary Interviews and Surveys
Primary work focused on installers, electrical contractors, facility managers, distributors, and product specialists who see ordering patterns and compliance driven replacement decisions. We used these discussions to confirm typical bill of materials mixes between exit signs, emergency luminaires, and monitoring and test systems, and to validate how choices change across commercial buildings, public infrastructure, and industrial sites.
Distribution of primary research fieldwork respondents
| Company type | Respondent position | Region |
|---|---|---|
| Top tier: 31% | CXOs: 20% | |
| Mid tier: 47% | Functional/Unit leaders: 35% | |
| Smaller Players: 22% | Managers: 45% |
Market-Sizing & Forecasting
Sizing uses a top-down build that reconstructs annual emergency-lighting value from Australia building activity and installed-base upkeep, which is then shaped by compliance requirements and retrofit intensity. We start with construction and renovation indicators, then apply penetration and replacement logic to estimate how many sites require compliant emergency luminaires and exit signs.
Several market fingerprints are used as inputs, such as construction pipeline movement, retrofit share in healthcare and public buildings, LED conversion pace, monitoring and test system adoption, and battery replacement cycles that affect service and product demand timing. Price is handled through a simple ASP ladder by product group, and then adjusted for mix shifts between self-contained, central battery, and hybrid systems, based on what buyers and contractors report.
Forecasts are generated using scenario analysis that ties the outlook to building activity, regulation-led upgrades, and technology substitution, and then checked for plausibility against year-on-year ordering behavior shared in interviews. Where bottom-up visibility is weaker for smaller projects, bounded assumptions are applied and then pressure-tested through distributor and contractor channel checks.
Data Validation & Update Cycle
Outputs are validated through triangulation across independent signals, so the final totals align with building activity, compliance drivers, and realistic pricing. We run variance checks on growth rates, mix shifts, and implied unit volumes, and then anomalies are reviewed by a second analyst before sign-off.
The model is refreshed annually, and interim updates are triggered when material events occur, such as a major code clarification, an unusual construction swing, or a step-change in component pricing. Before delivery, we do a final pass to re-check currency timing assumptions and confirm no late-breaking market events were missed.
Mordor Intelligence's Australia Emergency Lighting Market Size Compared With Other Published Estimates
Published market sizes can differ even when they sound like the same topic, because the counted products, price timing, and upgrade triggers can vary across studies. In this market, the biggest spreads typically come from how retrofit demand is treated and whether monitoring and test systems are bundled into a broader lighting controls bucket.
When ASP ladders are refreshed close to publication and checked against distributor and installer feedback, it becomes easier to keep year-to-year shifts realistic, which is a control step used in Mordor Intelligence for this Australia market.
Benchmark comparison
| Source | Market Size | Gaps in Research Methodology |
|---|---|---|
| Mordor Intelligence | USD 0.09 B (2025) | |
| Industry Association A | USD 0.07 B (2025) | Often focuses on compliant luminaires and exit signage only, and may exclude monitoring and test systems plus central battery related components, which lowers the total value. |
| Trade Journal B | USD 0.11 B (2026) | Commonly applies broad construction-led growth and a single average price assumption, which can overstate the jump into 2026 if retrofit timing and product mix shifts are not separated. |
The table shows that differences are mostly explained by scope boundaries and how pricing and timing are handled between years. When the included product set is clearly defined and the pricing checks are repeated on a set cadence, the final number stays traceable and practical for planning.


Key Questions Answered in the Report
How large is the Australia emergency lighting market in 2026?
The market is worth USD 106.42 million in 2026 and is forecast to climb to USD 219.87 million by 2031, reflecting a 15.62% CAGR.
What is fueling rapid adoption of LED emergency luminaires?
A federal ban on incandescent and halogen lamps effective Oct 2025, combined with up to 60% energy savings and 50,000-hour life ratings, is accelerating LED installations.
Why are hybrid power systems gaining attention?
Hybrid architectures lower upfront costs by using self-contained heads on perimeters while centralizing batteries in core zones, trimming maintenance hours without full rewiring.
Which end-user group is expanding fastest?
Public infrastructure and institutional facilities, led by hospital redevelopments, are growing at a 16.56% CAGR through 2031 due to stringent safety and uptime demands.
How are suppliers addressing skilled labor shortages?
Vendors embed self-testing and cloud dashboards that automate mandatory inspections, reducing reliance on licensed electricians for routine compliance checks.
What cybersecurity measures apply to networked lighting?
The Australian Cyber Security Centre recommends encrypted firmware and strict network segmentation, prompting manufacturers to design secure-by-default IoT luminaires.
Page last updated on:






