
Market Overview
| Study Period | 2019 - 2031 |
|---|---|
| Forecast Data Period | 2026 - 2031 |
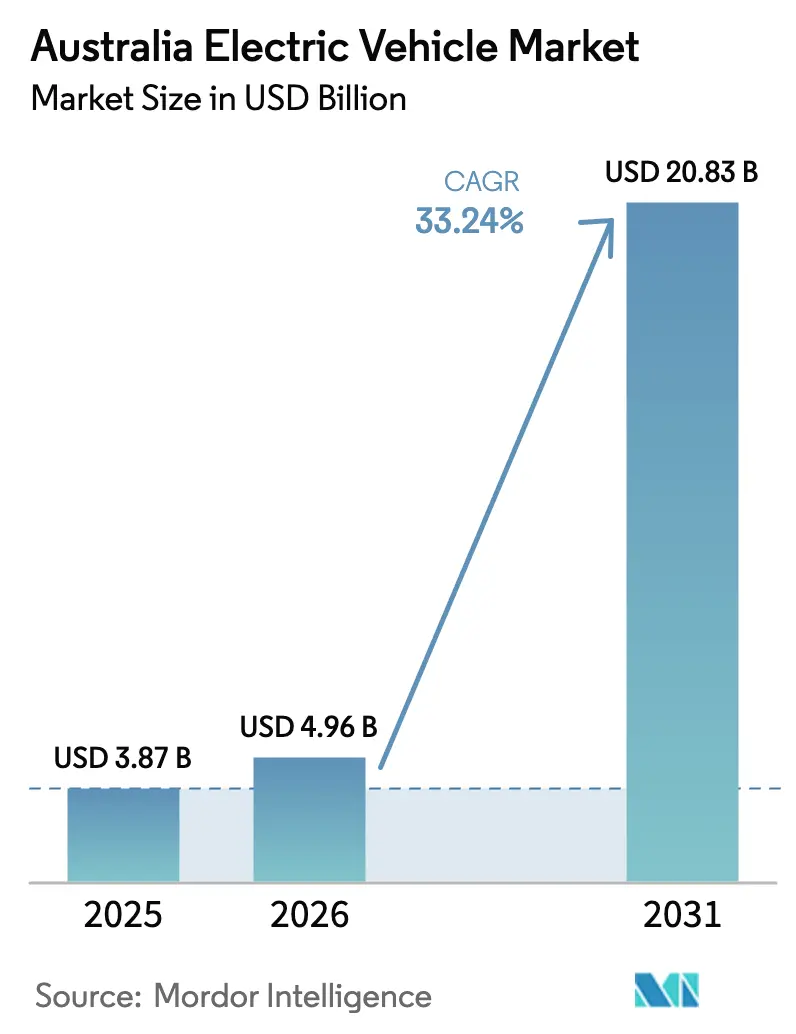
| Base Year Market Size (2025) | USD 3.87 Billion |
| Market Size (2026) | USD 4.96 Billion |
| Market Size (2031) | USD 20.83 Billion |
| Growth Rate (2026 - 2031) | 33.24 % |
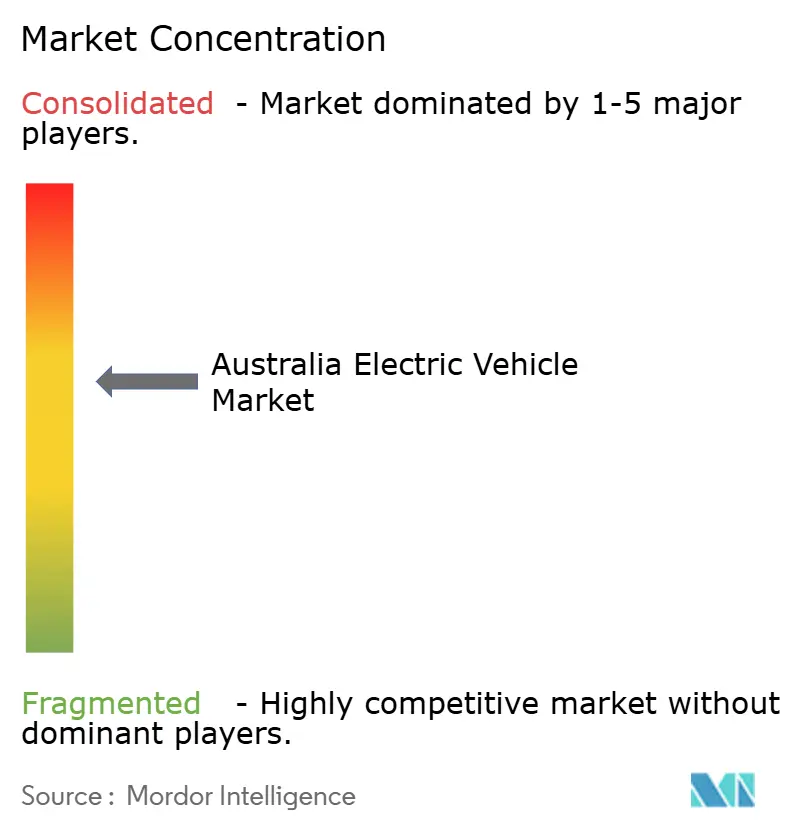
| Market Concentration | Medium |
Major Players *Disclaimer: Major Players sorted in no particular order Image © Mordor Intelligence. Reuse requires attribution under CC BY 4.0. | |
Australia Electric Vehicle Market Analysis by Mordor Intelligence
The Australia electric vehicle market size was valued at USD 3.87 billion in 2025 and is estimated to grow from USD 4.96 billion in 2026 to reach USD 20.83 billion by 2031, at a CAGR of 33.24% during the forecast period (2026-2031). The nation’s new Vehicle Efficiency Standard, effective January 2025, is forcing automakers to increase battery-electric vehicle allocations, while state rebates and fringe-benefit tax waivers lower ownership costs and widen the addressable base. Chinese brands are intensifying price competition in the sub USD 30,000 bracket, eroding Tesla’s first-mover advantage and nudging legacy OEMs to accelerate right-hand-drive launches. Inter-city fast-charging corridors now span every mainland capital, easing range anxiety and enabling longer-distance household adoption. Corporate decarbonization pledges by ASX-listed companies, combined with Australia’s world-leading rooftop solar penetration, are amplifying total-cost-of-ownership advantages that favor EV uptake.
Key Report Takeaways
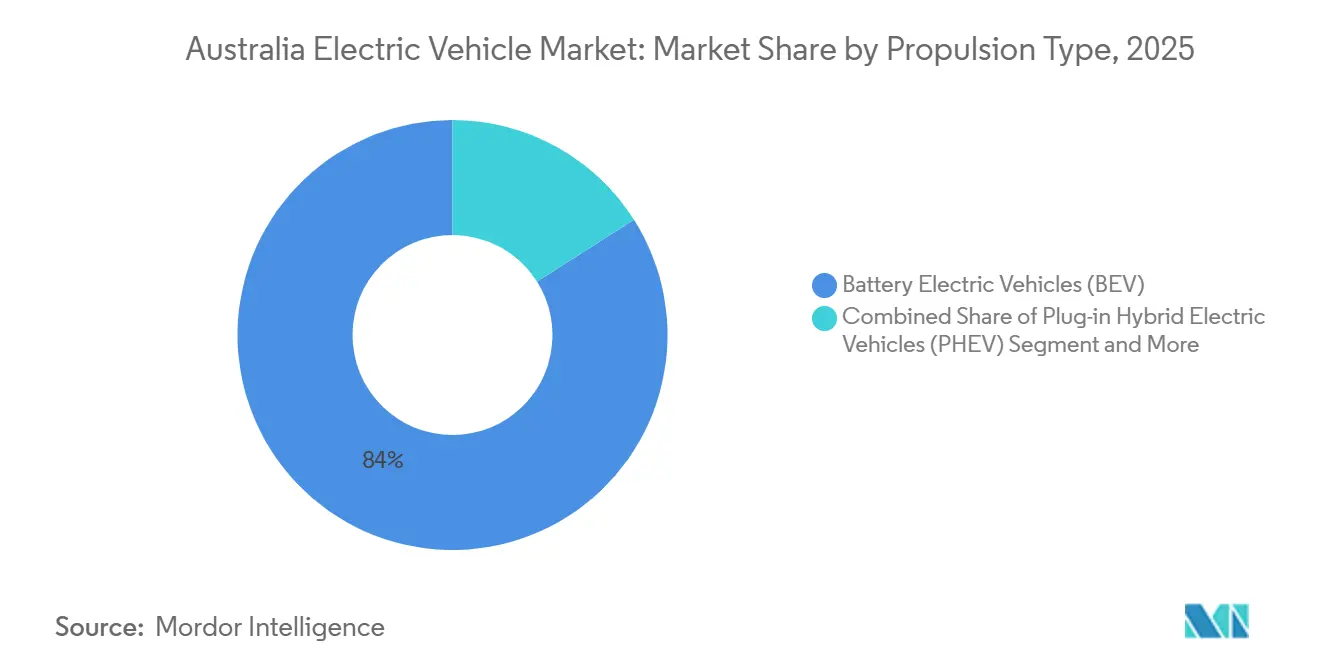
- By propulsion type, battery-electric vehicles accounted for 84.01% in 2025, while fuel-cell electric vehicles are on track for a 43.15% CAGR through 2031.
- By vehicle type, passenger cars accounted for 83.25% of 2025 registrations, while light commercial vehicles are the fastest-growing segment, with a 35.02% CAGR to 2031.
- By range, the 200-400 km group held a 47.13% share in 2025, whereas the 400-600 km cohort is projected to grow at a 34.12% CAGR by 2031.
- By battery chemistry, nickel-cobalt chemistries accounted for 58.23% of battery demand in 2025; meanwhile, lithium iron phosphate cells are projected to rise at a 37.55% CAGR by 2031.
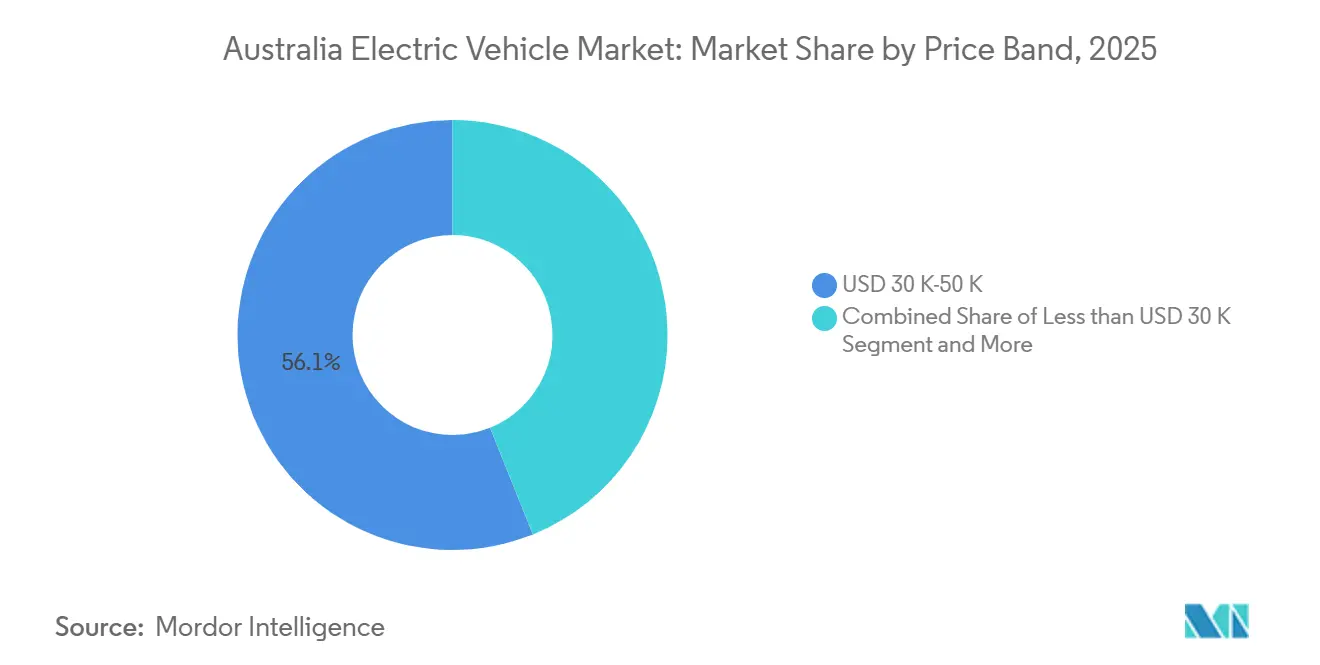
- By price band, the USD 30,000-50,000 models accounted for 56.11% of 2025 sales, but sub-USD 30,000 models are expanding at a 38.24% CAGR by 2031.
- By ownership model, private individuals held a 74.25% share in 2025, while corporate fleets are advancing at a 34.75% CAGR by 2031.
- By state/territory, Queensland captured 30.05% of 2025 deliveries, while New South Wales is forecast to accelerate at 36.14% CAGR through 2031.
Note: Market size and forecast figures in this report are generated using Mordor Intelligence’s proprietary estimation framework, updated with the latest available data and insights as of January 2026.
Australia Electric Vehicle Market Trends and Insights
Drivers Impact Analysis*
| Driver | (~) % Impact on CAGR Forecast | Geographic Relevance | Impact Timeline |
|---|---|---|---|
| Entry of Sub-USD 30 K Brands | +7.1% | Metro and peri-urban markets nationwide | Short term (≤ 2 years) |
| Federal and State Incentive Schemes | +6.2% | NSW, VIC, QLD, ACT | Medium term (2-4 years) |
| Expansion of Inter-City Fast-Charging | +5.8% | Interstate highways nationwide | Medium term (2-4 years) |
| New Vehicle Efficiency Standard | +5.4% | National | Medium term (2-4 years) |
| Corporate Fleet Decarbonization Commitments | +4.5% | Major metros nationwide | Long term (≥ 4 years) |
| High Rooftop Solar Penetration | +3.9% | QLD, SA, WA | Short term (≤ 2 years) |
| Source: Mordor Intelligence | |||
Entry of Sub-USD 30 k Chinese Brands (BYD, MG) Broadening Consumer Base
BYD, MG, and GWM have begun offering compact EVs in Australia at more affordable prices, positioning them significantly below established competitors. These manufacturers utilize cost-effective Lithium Iron Phosphate batteries, reducing battery expenses while still achieving competitive ranges. Standard inclusions such as adaptive cruise control, 360-degree cameras, and over-the-air updates help dispel any notions of compromise associated with budget models. Additionally, fringe-benefit-tax exemptions further lower effective lease costs over a multi-year period[1]. Consequently, Australia’s electric vehicle market is witnessing a surge in demand, particularly from first-time buyers who were once priced out of the segment.
Federal and State Incentive Schemes Accelerating EV Uptake
New South Wales provides rebates and waives stamp duty. Queensland offers subsidies, while the ACT removes both stamp duty and registration fees. Victoria's decision to repeal its road-user charge in 2024 eliminated a significant barrier to adoption. Fleet operators take advantage of these jurisdictional differences by registering vehicles in regions with the most attractive incentives and deploying them nationwide. With the addition of federal fringe-benefit-tax relief, many electric vehicles (EVs) now achieve price competitiveness with internal combustion engine (ICE) alternatives at the point of purchase. This comprehensive support is expected to significantly enhance the growth rate during the forecast period.
Expansion of Inter-City Fast-Charging Corridors (NRMA, Chargefox, Evie)
NRMA, Chargefox, and Evie Networks have installed numerous DC fast chargers, significantly reducing average highway gaps[2]. Priority 150-350 kW hardware restores 300 km of range in 20-30 minutes, easing charging-time anxiety. The Perth-Albany corridor in Western Australia now features strategically placed chargers, paving the way for a surge in EV tourism. To address grid-capacity challenges in rural towns, battery-backed demand-management systems, supported by federal grants, have been introduced. As corridor coverage improves, consumers are increasingly gravitating towards mid-range models, leading to a notable shift in market dynamics.
New Vehicle Efficiency Standard Creating Supply-Side Push
By the mid-term, the NVES will impose stricter CO₂ emission limits for passenger cars, with further tightening expected by the long-term. Vehicles exceeding these limits will face significant penalties for each additional gram of emissions. Toyota, Volkswagen, and Hyundai must expand zero-emission allocations or buy credits from EV-heavy competitors like Tesla and BYD. Automakers increasingly bundle EVs with profitable ICE utes to hit fleet targets and guarantee domestic supply. The rule turns compliance into the dominant constraint, ensuring EV availability even if retail sentiment cools. This supply-side mandate underpins long-run price competitiveness and volume growth.
Restraints Impact Analysis*
| Restraint | (~) % Impact on CAGR Forecast | Geographic Relevance | Impact Timeline |
|---|---|---|---|
| Limited EV Ute/4x4 Availability | -4.2% | Rural WA, NT, QLD | Medium term (2-4 years) |
| Supply Chain Bottlenecks and Wait Times | -3.8% | National | Short term (≤ 2 years) |
| Suburban Grid Constraints | -3.1% | Fringe suburbs of major metros | Medium term (2-4 years) |
| Immature Used-EV Resale Market | -2.9% | Metro used-car hubs | Long term (≥ 4 years) |
| Source: Mordor Intelligence | |||
Scarcity of EV Utes / 4x4 Models Vital for Rural Buyers
Utes account for 20% of national new-vehicle demand, yet only LDV’s eT60 and BYD’s Shark 6 PHEV are available and compromise on towing or range. Ford’s Ranger PHEV and F-150 Lightning remain unallocated for right-hand-drive production, preserving diesel dominance. Rural operators need 3.5-ton towing and 400 km real-world range at sub-USD 70,000 price points, specifications that current batteries cannot deliver profitably. Limited options slow rural adoption and subtract an estimated 4.2 percentage points from market CAGR. OEMs that first satisfy ute buyers stand to capture a lucrative white-space segment.
Supply Shortages and Extended Wait-Lists for Popular Models
In 2024, buyers of the Tesla Model Y and Hyundai Ioniq 5 faced significant waiting periods[3]. This delay was due to right-hand-drive build slots being prioritized for the larger markets of the United Kingdom and Japan. Consumers, unwilling to endure long waits, turned to Chinese brands with shorter lead times, resulting in a decline in the incumbents' market share. In response, OEMs are contemplating local assembly to secure their allocations. However, the pipeline's tightness is expected to continue for the foreseeable future. This situation not only defers demand but also encourages brand switching, thereby impacting market growth. Market volumes are expected to stabilize once global capacity for right-hand-drive models expands.
*Our forecasts treat driver/restraint impacts as directional, not additive. The impact forecasts reflect baseline growth, mix effects, and variable interactions.
Segment Analysis
By Propulsion Type: Battery Dominance With Fuel-Cell Upside
Battery Electric Vehicles (BEVs) captured 84.01% of 2025 registrations, while Fuel-cell Electric Vehicles (FCEVs) sold fewer units yet promise a 43.15% CAGR by 2031 as hydrogen corridors emerge. The growing allocation of BYD, Tesla, and MG models ensures that BEVs retain their structural leadership despite penalties on hybrids from NVES. Plug-in hybrids address regional buyers’ range concerns, though real-world charging habits will ultimately determine the environmental benefits. Fuel-cell uptake hinges on Canberra–Sydney refueling nodes scheduled for the coming years, with Hyundai’s Nexo fleet pilots guiding early demand. Overall, the choice of propulsion remains a core variable influencing the trajectories of Australia's electric vehicle market.
Metro commuters are opting for BEVs due to their low running costs, while regional drivers continue to value the versatility of PHEVs. Government fleet targets are driving an increased focus on zero-emission purchases, bolstering confidence in large BEV orders and their residual values. Although FCEV costs remain high, transitioning LNG infrastructure to hydrogen offers a viable medium-term solution for long-distance freight. Consequently, while batteries will drive mainstream growth, the diversity of propulsion methods is set to expand rather than contract.

By Vehicle Type: LCV Electrification Outpaces Passengers
Passenger Cars owned 83.25% of the 2025 volume, yet Light Commercial Vehicles logged a 35.02% CAGR, positioning them as swing contributors to the Australian electric vehicle market share through 2031. Supermarket chains deploy LDV eDeliver 9 vans on 150-km metro routes, proving compelling total-cost-of-ownership advantages. Depot charging aligns with solar PV generation, flattening demand peaks and supporting grid stability. Corporate fleet refresh cycles of three to five years will fuel a secondary-market wave from 2027, expanding affordability for sole traders and SMEs.
In contrast, medium-duty truck electrification remains in its early stages. Battery weight trims payloads by up to 1.5 tons, limiting adoption to volume-constrained parcels and beverage runs. Volvo’s FM Electric pilots indicate that cost break-even is achieved only when daily distances remain under 250 km. Nonetheless, federal grants for zero-emission freight corridors could accelerate the adoption of medium-duty vehicles late in the decade. Passenger segments, meanwhile, wrestle with the absence of electric utes, delaying rural adoption until credible tow-capable models appear.
By Range: 400-600 km Segment Erodes Anxiety
The 400-600 km bracket surged at a 34.12% CAGR, eroding the dominance of 200-400 km models, which still accounted for 47.13% of 2025 sales. Improved charging density now permits 300-km cars to traverse Sydney–Melbourne with two stops, though surveys show buyers still demand a psychological buffer of 400 km. Battery costs have declined since 2022, making longer-range variants financially viable, which supports an upshift in the mix and boosts the Australian electric vehicle market size for mid-range trims. Premium models exceeding 600 km remain niche status symbols due to steep price premiums.
Additional inter-city chargers are likely to moderate future range escalation, steering consumers back toward 300-350 km cars that strike a balance between cost and weight. Automakers are trialing subscription-based battery upgrades, allowing owners to unlock extra range for holiday road trips. Such flexibility could realign expectations and reduce over-specification of battery capacity, improving per-kilowatt utilization across the fleet.
By Battery Chemistry: LFP Gains Mirror Chinese Ascent
Nickel-Cobalt chemistries held a 58.23% share in 2025 but face steady erosion as Lithium Iron Phosphate (LFP) cells expand at 37.55% CAGR, spearheaded by Chinese OEM imports. LFP’s superior thermal stability reduces insurance premiums and simplifies pack architecture, enabling cell-to-body designs that help reclaim some of the energy-density deficit. Tesla’s switch to LFP for Model 3 RWD trims shaved a significant share off the bill of materials, driving price competition across the Australian electric vehicle market. Premium marques will retain Nickel Cobalt Manganese (NCM)/Nickel Cobalt Aluminum (NCA) for 500-km-plus variants, where range trumps cost.
Reduced cobalt dependence shields buyers from supply risks linked to geopolitical tensions in Central Africa, reinforcing the sustainability narrative that underpins government fleet mandates. Recycling players are scaling LFP-dedicated processes, signaling confidence in chemistry-specific circular-economy economics. As costs fall, LFP penetration is expected to capture parity share with nickel-based chemistries by 2028.
By Price Band: Barbell Structure Emerges
The USD 30,000-50,000 tier, which owned 56.11% of the 2025 volume, is now under siege from sub-USD 30,000 entrants expanding at a 38.24% CAGR. Fringe-benefit-tax exemptions on vehicles below the luxury-car threshold sharpen corporate appetite for Tesla Model 3 and Hyundai Ioniq 5 leases, sustaining mid-band strength. Value-seeking private buyers, however, gravitate toward MG4 and BYD Dolphin offers, compressing the ownership-cost gap with ICE substitutes. Above USD 50,000 demand remains resilient among performance and luxury enthusiasts, insulated from price sensitivity.
Expect a barbell outcome: aggressive volume growth at the bottom end and healthy margins at the top, while the middle becomes contested terrain in the Australian electric vehicle industry. Legacy automakers must decide whether to match Chinese brands on price or differentiate through design and after-sales service to defend segment share.
By Ownership Model: Fleets Seed Secondary Market
Private buyers accounted for 74.25% in 2025; however, corporate fleets are projected to grow at a 34.75% CAGR by 2031, as Woolworths, Qantas, and Telstra electrify their logistics and service vehicles. Tax exemptions and guaranteed utilization often mean fleets secure factory allocations ahead of retail orders, thereby smoothing supply volatility in the Australian electric vehicle market. Government agencies aim to achieve 75% low-emission procurement by 2025, thereby anchoring baseline demand even during consumer downturns.
Fleet vehicles will enter the used market after typical three-year lease cycles, alleviating today’s residual-value uncertainty that suppresses private-buyer confidence. This pipeline could reduce the resale-value gap between EVs and ICE counterparts by 2028, accelerating mainstream acceptance. Subscription models, such as Karmo’s partnership with AUSEV, further democratize EV access by enabling month-to-month use without long-term financial commitments.
Geography Analysis
New South Wales is poised to overtake Queensland as the most significant contributor to the Australian electric vehicle market by 2028, with a 36.14% CAGR by 2031, driven by a substantial incentive package and an enduring rebate. Queensland’s subsidy drove an early 30.05% share in 2025, yet its slower charging corridor rollout tempers long-term momentum. Victoria recovered from its abandoned road-user charge and now targets notable zero-emission sales by 2031, aided by reliable port access that shortens delivery times.
The Australian Capital Territory maintains national leadership on a per capita basis, thanks to zero stamp duty and free registration, as well as its dense urban geography that neutralizes range anxiety. Western Australia and South Australia remain mid-single-digit contributors; vast distances and a later start to corridor development constrain uptake, though new tourism-route chargers are closing the gap. Tasmania and the Northern Territory lag behind due to a scarcity of dealerships and concerns about extreme climate-driven battery degradation, but targeted grants for off-grid solar-plus-storage are beginning to shift momentum.
Fragmented state policies complicate OEM allocation decisions, prompting some buyers to purchase in Sydney or Melbourne and register vehicles interstate. Harmonizing incentives could unlock two to three percentage points of incremental CAGR for the Australian electric vehicle market by reducing administrative friction and balancing inventory flows.
Regulatory Landscape
Australia has shifted to compliance-led electrification, anchored by the national New Vehicle Efficiency Standard (NVES) that commenced on 1 January 2025 and pushes OEMs to increase low- and zero-emission allocations to manage fleet-average CO2 outcomes. In parallel, the Australian Government (DCCEEW) continues to steer implementation through the National Electric Vehicle Strategy, including workstreams on fleet procurement, remote and regional charging, and national data sharing.
Charging regulation is tightening around reliability and interoperability. DCCEEW guidance for government-supported public EV charging sets minimum operating standards such as CCS Type 2 connectors and 98% annual uptime, which flows into procurement specifications for network operators and site hosts. From 1 April 2026, an interim regulatory framework for EVSE energy measurement for billing (NMI 14/4/0) commenced, adding compliance requirements for metering accuracy in public charging. Jurisdictions are also continuing to align on cybersecurity and smart-charging functionality following the August 2025 agreement on national standards.
Value Chain Analysis
Australia's EV value chain remains import-led for finished passenger vehicles, while commercial vehicles place increasing weight on local capability and upstream battery materials. One downstream manufacturing node is taking shape around Volvo Group Australia's Wacol facility in Queensland, which integrates local assembly of battery-electric OEM trucks to global production standards and links local body and build work to global driveline and battery supply.
Charging hardware, software, and grid connection approvals form a second critical chain. Distribution Network Service Providers (DNSPs) control technical access through Service and Installation Rules, so connection processes and capacity constraints directly affect depot and public fast-charger deployment timelines. Interoperability requirements are strengthening as networks move to common protocols such as OCPP 2.0.1 and ISO 15118, supported by national coordination efforts under DCCEEW, including mapping and planning tools developed with Evenergi to prioritize sites and reduce corridor duplication.
Competitive Landscape
Chinese challengers are chipping away at Tesla's once-dominant position. In recent times, Tesla's market share has declined, while competitors like BYD have gained traction, and MG has emerged as a significant player. As Chinese imports achieve price-feature parity, they squeeze profit margins, prompting established automakers to accelerate their local launches or risk a decline in market share. The electric ute segment presents an opportunity; with BYD's Shark 6 PHEV being the sole affordable option, a substantial market remains ripe for disruption.
Tesla leverages vertical integration and its Supercharger network, yet Chargefox and Evie's expansion is eroding that advantage. BYD supplies battery packs to Toyota’s forthcoming bZ4X variant, signaling an increasing level of coopetition that blurs traditional rivalries. Polestar positions between mass-market Chinese brands and German luxury, while Rivian’s 2024 trademark filings hint at a premium ute launch targeting adventure-lifestyle buyers. The combined share of the top three fell 10 percentage points year over year, underscoring a shift toward multipolar competition in the Australian electric vehicle market.
Legacy incumbents counter by bundling PHEV variants, refreshing ICE mainstays, and lobbying for transitional incentives, but global right-hand-drive allocation constraints limit near-term impact. Expect continued fragmentation as new brands exploit price gaps and as OEMs experiment with agency sales models to retain margin in an increasingly crowded channel.
Australia Electric Vehicle Industry Leaders
-
Tesla Inc.
-
SAIC Motor Corp., Ltd. (MG Motor Australia)
-
Toyota Motor Corporation
-
BYD Company Limited
-
Hyundai Motor Group
- *Disclaimer: Major Players sorted in no particular order
Market Opportunities and Future Outlook
Fleet and freight electrification is opening a clearer commercialization pathway for medium- and heavy-duty EVs, supported by named projects and financing. Volvo Group Australia commencing local manufacturing of battery-electric trucks at Wacol (Queensland) in July 2026, alongside Clean Energy Finance Corporation support and early deployment by Linfox, provides an execution template for other fleets that need predictable supply, service coverage, and local fit-out capability. Complementary grant-backed programs, including ARENA support for Linfox's Heavy Truck Electrification Project, are accelerating depot charging, route validation, and operational data that can be reused across logistics, retail distribution, and service fleets.
Upstream and enabling technologies also create whitespace as Australia translates critical-minerals positioning into EV-adjacent manufacturing. In June 2026, the federal government awarded AUD 45 million to Sicona Battery Technologies to scale commercial silicon-anode manufacturing at Port Kembla, targeting a step-change in domestic anode output and creating a more localized battery material anchor for import pack assemblers and potential future domestic cell initiatives. On the infrastructure side, stricter minimum operating standards for government-supported public charging, together with the April 2026 EVSE billing-measurement framework, increases demand for compliant, high-uptime hardware, software, and O&M services, particularly for highway corridors and multi-site fleet depots that need auditable billing and interoperable systems.
Recent Industry Developments
- July 2026: Zenobē announced a 148-vehicle electric truck lease deal with Woolworths for commercial freight transport. The agreement points to expanding EV usage in Australian trucking and highlights tangible uptake in the commercial fleet segment.
- July 2026: BYD launched a 2500 cash-back offer for its Sealion 7 premium model valid through 31 July 2026. The price support is intended to lift near-term competitiveness and drive volume in the consumer EV market.
- July 2026: BYD opened expressions of interest for the upgraded Atto 3 Evo, featuring faster charging and a more powerful motor. The upgrade strengthens BYD's market positioning by improving capability and broadening consumer engagement.
Research Methodology Framework and Report Scope
Market Definition and Coverage
This market covers the value generated from electric vehicles sold and registered in Australia, captured across battery electric vehicles and plug-in hybrids, and measured at the vehicle sales level in USD for the study period.
Scope exclusions: it does not count public charging equipment sales, electricity used for charging, or aftermarket parts and service revenue, unless they are bundled as part of the vehicle transaction.
Segmentation Overview
- By Propulsion Type
- Battery Electric Vehicles (BEV)
- Plug-in Hybrid Electric Vehicles (PHEV)
- Hybrid Electric Vehicles (HEV)
- Fuel-Cell Electric Vehicles (FCEV)
- By Vehicle Type
- Passenger Cars
- Light Commercial Vehicles
- Medium-Duty Commercial Vehicles
- Heavy-Duty Commercial Vehicles
- By Range
- Less than 200 km
- 200-400 km
- 400-600 km
- More than 600 km
- By Battery Chemistry
- Nickel Cobalt Manganese (NCM)/ Nickel Cobalt Aluminum (NCA)
- Lithium Iron Phosphate (LFP)
- Lithium Manganese Oxide (LMO)
- Others
- By Price Band
- Less than USD 30 K
- USD 30 K-50 K
- Above USD 50 K
- By Ownership Model
- Private Individuals
- Corporate Fleets
- Government Fleets
- By State / Territory
- New South Wales
- Victoria
- Queensland
- Western Australia
- South Australia
- Australian Capital Territory
- Rest of Australia
Data Sources, Market Sizing, and Validation
Desk Research
Desk research was used to set the fact base for Australia EV demand, supply availability, and policy signals that directly move purchase decisions. We relied on official and open sources such as the Australian Bureau of Statistics for population and macro indicators, the Department of Infrastructure and state transport agencies for vehicle registrations, the Clean Energy Regulator for EV related program context, and the International Energy Agency for comparable EV stock and adoption benchmarks.
To keep the model grounded in what is actually being sold, we checked additional inputs using automaker public filings, investor presentations, and releases from industry bodies, then cross-referenced reputable news coverage on model launches, incentives, and price moves. Where needed, we referenced paid subscriptions for company financials and intelligence, import and export shipment level tracking, and patent databases to sense technology direction, and then sanity checked the outputs with what interviewees reported in the field. The desk sources listed here are illustrative and not exhaustive, since many other public documents were used for data collection, validation, and clarification.
Primary Interviews and Surveys
Primary work focused on validating adoption drivers and translating policy and supply signals into realistic volumes and prices. We spoke with OEM and distributor side experts, fleet and leasing decision makers, charging ecosystem stakeholders (for demand linkage only), and state-level observers to confirm how purchase mix is shifting across BEV and PHEV, and how quickly it is changing.
Because this is a country level market, feedback was balanced across major states and metro corridors, then used to close gaps on incentive pass through, fleet ordering cycles, typical discounting, and model availability assumptions that desk research cannot fully capture.
Distribution of primary research fieldwork respondents
| Company type | Respondent position |
|---|---|
| Top tier: 27% | CXOs: 17% |
| Mid tier: 54% | Functional/Unit leaders: 29% |
| Smaller Players: 19% | Managers: 54% |
Market-Sizing & Forecasting
The market was primarily built using a top-down demand pool, where new vehicle sales and registration signals were reconstructed into EV volumes by propulsion type, and then translated into value using observed and interview-validated average selling prices. To ensure the totals stayed realistic, we ran selective bottom-up checks, such as sample model level price points, distributor channel checks, and limited rollups of known volumes in high adoption states, and then adjusted outliers.
Key inputs used in the model included annual new vehicle registrations, EV share of new sales, BEV versus PHEV mix, average transaction price movement by vehicle class, policy timing (including efficiency standards and tax treatment), and import lead times that affect supply availability. Where a data point was missing for a niche vehicle class, we filled it using close substitutes and applied a conservative adjustment factor, then reviewed it again during validation.
For forecasting, scenario analysis was used with a base case anchored to policy schedules and expected model launch cadence, then stress-tested with faster and slower price normalization and supply assumptions. The year-by-year path was refined using primary feedback on fleet replacement cycles and expected incentive continuity, so the forecast stayed tied to practical buying behavior.
Data Validation & Update Cycle
Estimates were validated through triangulation across independent signals, including registration trends, public price trackers, and import arrival patterns, then checked for year-to-year jumps that did not match policy or supply changes. When variances appeared, assumptions were reopened, and follow-up discussions were triggered with relevant respondents before final sign off.
Each model pass is reviewed in steps, first at the input level and then at the output level, so arithmetic issues and logic gaps are caught early. Reports are refreshed annually, with interim updates when material events occur, such as major incentive shifts or sudden price resets. Before delivery, a final update sweep is completed so clients receive the most current view available.
Mordor Intelligence's Australia Electric Vehicle Market Size Versus Other Published Estimates
It is normal to see different market sizes for Australia EVs because publishers do not always count the same things, and they often use different price logic and base year choices. The biggest differences usually come from what is treated as an electric vehicle transaction, whether value is taken at sticker price or transaction price, and how quickly incentives and price cuts are assumed to flow through.
Some published figures roll charging hardware and energy services into the same number, and a few also report a combined Australia plus New Zealand total, which inflates the addressable pool. In Mordor Intelligence, the sizing is limited to vehicle sales value inside Australia, with BEV and PHEV counted at the vehicle transaction level, and pricing refreshed to reflect model mix changes rather than a flat ASP uplift.
Benchmark comparison
| Source | Market Size | Gaps in Research Methodology |
|---|---|---|
| Mordor Intelligence | USD 3.87 B (2025) | |
| Global Consultancy A | USD 16.20 B (2024) | Uses a broader scope that combines Australia and New Zealand and also folds public charging equipment revenue into the value total, which pushes the market size above vehicle only sizing. |
| Industry Association B | USD 2.95 B (2025) | Uses a narrower valuation approach that applies conservative transaction prices and excludes a portion of plug-in hybrid sales in the counted fleet channels, which reduces total value even if unit sales are similar. |
The table shows that the spread is mainly created by scope and pricing treatment, not by small differences in adoption rates alone. By keeping the value definition tied to vehicle transactions and checking the result against registrations and price movement, the output stays traceable to clear inputs and repeatable steps, which helps decision makers compare years consistently.
Key Questions Answered in the Report
How big is the Australia electric vehicle market today and how fast is it growing?
The market generated USD 4.96 billion in 2026 and is projected to reach USD 20.83 billion by 2031, reflecting a 33.24% CAGR during 2026-2031.
Which price band is growing fastest?
Sub-USD 30,000 models, led by BYD Dolphin and MG4, are expanding at a 38.24% CAGR as Chinese brands flood the entry segment with feature-rich cars.
Why are EV wait-lists still long in Australia?
Limited right-hand-drive production slots favor larger United Kingdom and Japanese markets, creating domestic shortages for high-demand models such as Tesla Model Y and Hyundai Ioniq 5.
What is holding back rural EV adoption?
The absence of affordable electric utes with 400 km towing range, plus sparse fast-charging infrastructure, limits uptake among rural buyers.