
Market Overview
| Study Period | 2020 - 2031 |
|---|---|
| Forecast Data Period | 2026 - 2031 |
| Base Year Market Size (2025) | USD 56.92 Million |
| Market Size (2026) | USD 61.01 Million |
| Market Size (2031) | USD 86.27 Million |
| Growth Rate (2026 - 2031) | 7.18 % |
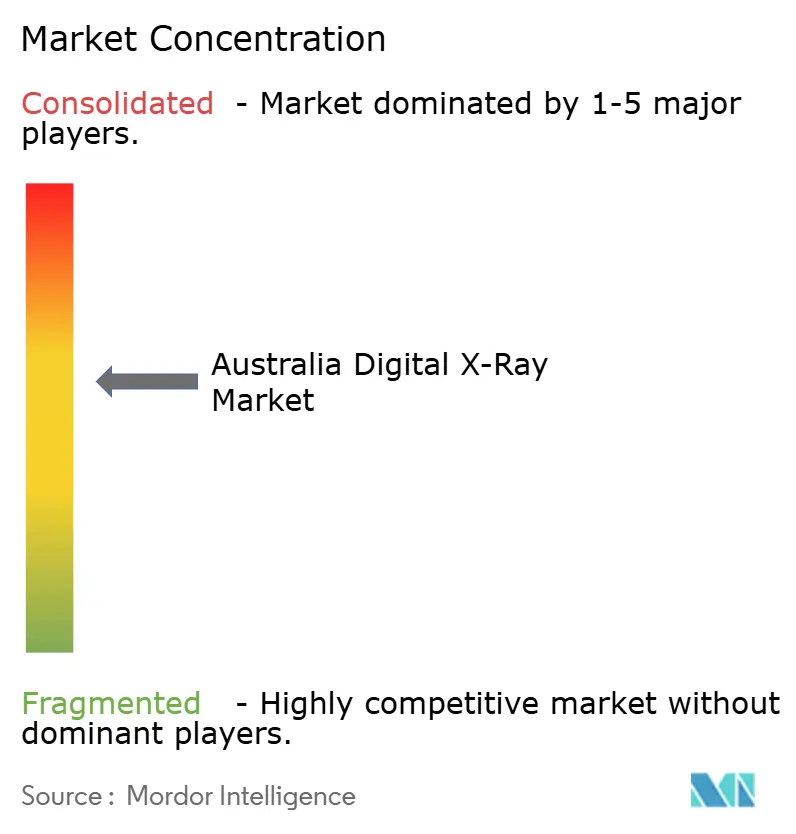
| Market Concentration | Medium |
Major Players *Disclaimer: Major Players sorted in no particular order Image © Mordor Intelligence. Reuse requires attribution under CC BY 4.0. | |
Australia Digital X-Ray Market Analysis by Mordor Intelligence
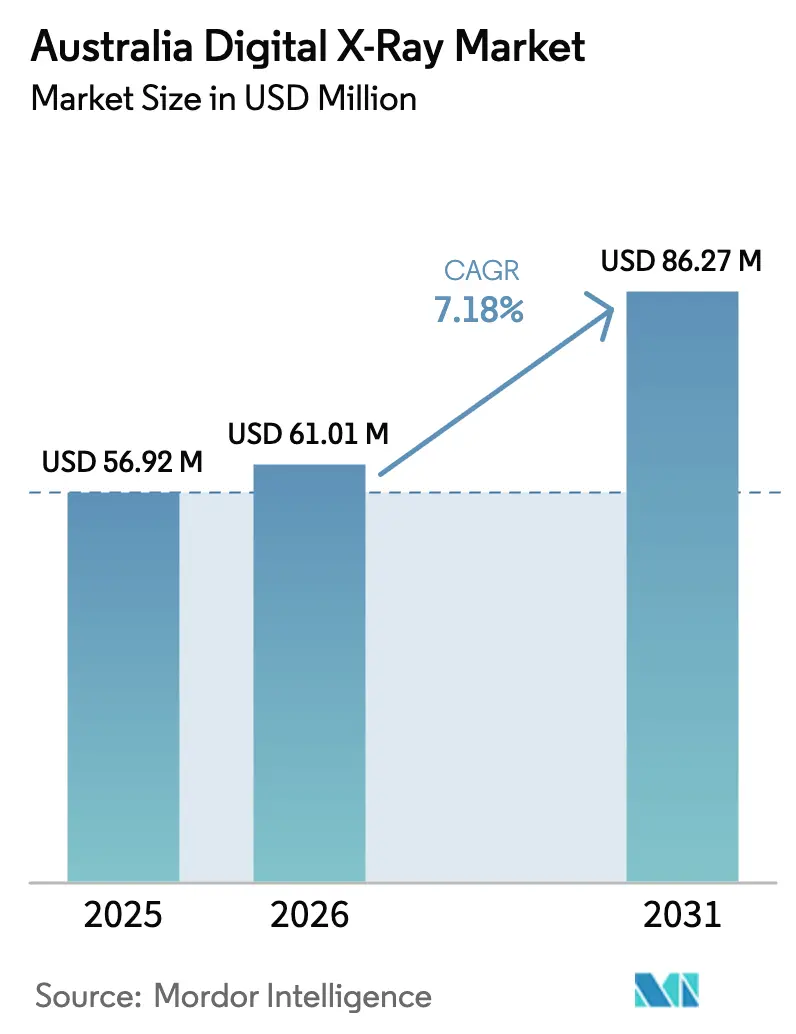
Australia digital X-ray market size in 2026 is estimated at USD 61.01 million, growing from 2025 value of USD 56.92 million with 2031 projections showing USD 86.27 million, growing at 7.18% CAGR over 2026-2031. Rising demand for point-of-care imaging, compulsory data-sharing requirements under My Health Record, and fast detector innovation collectively sustain robust revenue momentum across the Australia digital X-ray market. National cybersecurity rules, while adding procurement complexity, accelerate replacement of legacy systems that cannot meet the Therapeutic Goods Administration’s tighter device safeguards. Workforce shortages spur adoption of AI-ready consoles that streamline image acquisition and preliminary triage, giving vendors that bundle software subscriptions with hardware a strategic advantage. Concurrent consolidation among private diagnostic groups increases purchasing power, prompting OEMs to differentiate through mobile ergonomics, flexible detectors, and integrated cloud archiving.
Key Report Takeaways
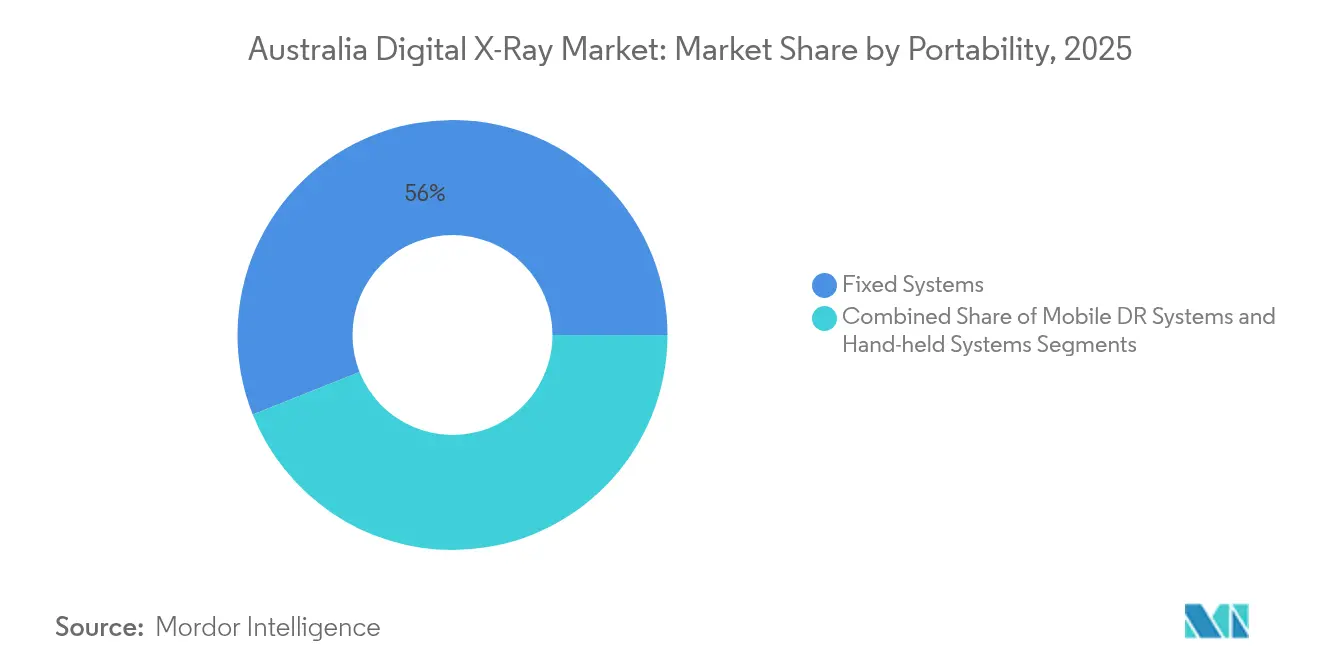
- By portability, fixed systems held 56.02% of the Australia digital X-ray market share in 2025. Mobile DR units are projected to post a 10.05% CAGR through 2031, the fastest of all portability segments.
- By detector panel, amorphous silicon accounted for 45.10% of the Australia digital X-ray market size in 2025. Flexible IGZO panels are forecast to expand at a 10.4% CAGR between 2026 and 2031.
- By application, orthopedic imaging led with 38.25% revenue share in 2025, while dental digital X-ray adoption is advancing at a 9.55% CAGR to 2031.
- By end user, hospitals and multispecialty clinics commanded 46.12% of 2025 revenues; diagnostic imaging centers are growing the quickest at 8.72% CAGR through 2031.
Note: Market size and forecast figures in this report are generated using Mordor Intelligence’s proprietary estimation framework, updated with the latest available data and insights as of 2026.
Australia Digital X-Ray Market Trends and Insights
Drivers Impact Analysis*
| Driver | (~) % Impact on CAGR Forecast | Geographic Relevance | Impact Timeline |
|---|---|---|---|
| Ageing population & rising imaging demand | +2.1% | NSW, VIC, QLD | Long term (≥ 4 years) |
| Increasing prevalence of chronic diseases | +1.8% | National; higher in regional areas | Medium term (2-4 years) |
| Rapid detector & AI-based workflow innovations | +1.5% | Urban centers; spreading to regional | Short term (≤ 2 years) |
| Government push to upload images to My Health Record | +1.3% | Nationwide mandate | Medium term (2-4 years) |
| Growing adoption of telehealth and remote diagnostics | +0.8% | Rural and remote zones | Short term (≤ 2 years) |
| Source: Mordor Intelligence | |||
Ageing Population & Rising Imaging Demand
The share of Australians aged 65 years and above is projected to reach 4.2 million by 2030, a cohort that historically undergoes 40% more radiography procedures per capita than younger groups[1]. Higher prevalence of musculoskeletal disorders within this demographic sustains orthopedic imaging volumes, ensuring stable throughput for fixed hospital suites and stimulating purchases of bedside systems that reduce patient transfers. The effect is pronounced in regional hubs where elderly residents cluster, encouraging health authorities to procure mobile DR vans that circulate among satellite clinics.
Increasing Prevalence of Chronic Diseases
Half of the adult population lives with at least one chronic condition, and repeated imaging to monitor cardiovascular and diabetic complications strengthens the long-term outlook for the Australia digital X-ray market. Digital radiography’s dose-reduction algorithms and rapid image availability align with preventive strategies outlined in the National Preventive Health Strategy, which promotes frequent community screenings[2]. That policy backing, coupled with detector prices that continue to fall, makes large-format mobile units attractive for municipal wellness campaigns.
Rapid Detector & AI-Based Workflow Innovations
Flexible indium gallium zinc oxide (IGZO) panels weigh 30% less than conventional amorphous-silicon plates yet maintain detective quantum efficiency, enhancing the ergonomics of portable rigs favored in emergency departments. Local software leader Pro Medicus secured AUD 40 million in new AI contracts during 2025, showcasing demand for server-side algorithms that auto-prioritize cases and generate structured findings. Simultaneously, Micro-X’s carbon-nanotube cathodes eliminate filament warm-up delays, allowing truly instant-on devices for rural trauma response.
Government Push to Upload Images to My Health Record
All diagnostic imaging providers must transmit reports—and, increasingly, original DICOM images—into My Health Record within defined timeframes. The Australian Digital Health Agency’s FHIR R4 roadmap locks in a 2026 compliance deadline, effectively sidelining analog setups or early digital consoles that lack secure APIs. Vendors able to validate seamless, encrypted image transfer win procurement tenders, particularly among smaller clinics that view interoperability as mandatory rather than optional.
Restraints Impact Analysis*
| Restraint | (~) % Impact on CAGR Forecast | Geographic Relevance | Impact Timeline |
|---|---|---|---|
| High equipment cost & CAPEX constraints | -1.2% | National; acute in rural regions | Medium term (2-4 years) |
| Shortage of radiographers & service engineers | -0.9% | Nationwide; severe outside metros | Long term (≥ 4 years) |
| TGA cybersecurity compliance delays procurement | -0.7% | National; affects smaller providers | Short term (≤ 2 years) |
| Limited funding and reimbursement | -0.8% | National; private sector most exposed | Medium term (2-4 years) |
| Source: Mordor Intelligence | |||
High Equipment Cost & CAPEX Constraints
Acquiring a floor-mounted digital room can cost AUD 500,000 (USD 320,000) even before construction fit-out, straining budgets at regional hospitals where capital grants favor urgent-care upgrades over imaging suites. Medicare reimbursement has not fully aligned with digital radiography’s higher depreciation profile, dampening ROI calculations for private clinics. As a result, refurbished consoles and detector retrofits comprise a growing slice of the Australia digital X-ray market, though resale units rarely include the cybersecurity modules now required by the TGA.
Shortage of Radiographers & Service Engineers
Vacancy rates for radiographers exceed 15% in several rural health districts, limiting scan capacity even where modern equipment is installed. The shortage extends to on-site engineers, lengthening downtime when detectors malfunction. Providers therefore seek AI features that shorten positioning time and auto-rotate images, enabling junior staff or cross-trained nurses to handle basic acquisitions. Vendors that maintain national parts depots and remote diagnostics portals gain favor because rapid field servicing reduces costly interruptions.
*Our forecasts treat driver/restraint impacts as directional, not additive. The impact forecasts reflect baseline growth, mix effects, and variable interactions.
Segment Analysis
By Portability: Mobile Systems Drive Point-of-Care Expansion
Fixed suites retained 56.02% of 2025 revenues, underscoring their entrenched role in tertiary hospitals that require ceiling-suspended tubes for complex trauma workflows. Yet the Australia digital X-ray market size for mobile units is projected to climb from USD 20.9 million in 2026 to USD 33.74 million by 2031, marking a double-digit trajectory. Diagnostic centers embrace mobile carts to boost ICU throughput, while the Royal Flying Doctor Service outfits aircraft with lightweight DR sets that can be deployed on dirt airstrips.
Mobile fleets incorporate hot-swap battery packs and 5G routers, allowing images to auto-route to cloud PACS during transit. Manufacturers such as GE Healthcare now bundle ergonomic training and radiation-shielding accessories to mitigate staff fatigue. Even hand-held devices—once relegated to dental clinics—are entering geriatric wards, reducing risky patient transfers. As reimbursement parity for bedside imaging becomes widely accepted, mobile share of the Australia digital X-ray market is likely to surpass 30% by the decade’s close.

By Detector Panel Type: Flexible Panels Enable Mobile Innovation
Amorphous-silicon held 45.10% of detector shipments in 2025 and remains the cost-efficient workhorse for high-volume rooms. However, flexible IGZO plates, currently a modest niche, are forecast to contribute USD 11.1 million in incremental revenue by 2031 inside the Australia digital X-ray market. Their bend-resistant substrates survive bumps in mobile environments and weigh under 2 kg, easing maneuvering around ventilated patients. Fujifilm’s latest model achieved an IP56 ingress rating, assuring safe outdoor use during disaster triage.
Complementing hardware, AI vendors calibrate reconstruction kernels to each panel type, ensuring consistent grayscale across multi-site networks. CMOS detectors, prized for low-dose pediatric protocols, retain a loyal following in specialist children’s hospitals but lag in mainstream adoption due to higher unit costs. Combined, these technology shifts point toward a diversified detector mix wherein facilities select panel chemistries based on durability, quantum efficiency, and workflow compatibility.
By Application: Dental Digitization Accelerates Private Practice Adoption
Orthopedic imaging anchored the Australia digital X-ray market size at USD 23.37 million in 2026, benefiting from 38.25% procedure share driven by degenerative joint disease assessments. Dental radiography, historically film-based, is racing ahead with a 9.55% CAGR as clinics invest in panoramic and cone-beam systems that integrate with chairside CAD/CAM workflows. CMS reimbursement now recognizes digital panoramic codes, shortening payback cycles for small practices.
Chest and cardiovascular applications maintain steady throughput in metropolitan hospitals, yet growth is capped by modality competition from CT and MR. Conversely, veterinary and industrial inspections emerge as adjacent niches. Mining operators in Western Australia deploy ruggedized DR sets to evaluate weld integrity on site, extending vendor revenue streams beyond clinical care. Across categories, AI overlay tools that flag fractures or pulmonary nodules add subscription revenue layers and differentiate premium consoles.
By End User: Diagnostic Centers Expand Market Reach
Hospitals and multispecialty clinics commanded 46.12% of 2025 system outlays, leveraging broad case mixes and 24/7 service footprints to justify ceiling-mounted rooms. Yet diagnostic imaging chains now post the fastest ramp-up, logging a 8.72% CAGR that outpaces inpatient budgets. Their growth follows mergers such as Integral Diagnostics’ tie-up with Capitol Health, generating a 240-site network able to negotiate bulk detector pricing.
Imaging centers also pioneer teleradiology models: exams shot in regional branches upload to cloud PACS for after-hours reading by urban radiologists, leveraging Australia digital X-ray market connectivity strengths. Mobile screening units, often operated by public-private consortia, bolster government objectives to improve indigenous health access, while aged-care facilities adopt mini-carts that navigate tight corridors. Collectively, these diverse deployments illustrate how end-user segmentation drives tailored product roadmaps and service bundles.

Geography Analysis
New South Wales and Victoria generated the bulk of equipment revenue in 2024, supported by dense hospital networks and a high concentration of private imaging suites in Sydney and Melbourne. Both states completed broad My Health Record roll-outs early, so providers now prioritize hardware that proves interoperable during tender evaluations. Queensland is the fastest-growing sub-regional contributor, benefitting from population inflows, tourist-driven trauma volumes, and a vibrant mining sector demanding occupational chest films.
Western Australia and South Australia showcase differentiated purchasing patterns that favor mobile rigs capable of traversing long distances between dispersed communities. In Western Australia, fly-in-fly-out clinic teams favor ultra-portable DR carts backed by satellite connectivity. South Australia, meanwhile, leverages state grants to subsidize detector retrofits in smaller community hospitals, stretching limited capital budgets.
The Northern Territory and Tasmania, though smaller markets, post above-average system turnover rates as state governments deploy AI-ready vans that deliver on-the-spot imaging in indigenous settlements and island districts. Regulatory oversight by the ACCC ensures that consolidation among imaging chains does not stifle competition; approval of the Integral-Capitol merger came with divestiture mandates in high-density suburbs to maintain fair access. Across all regions, consistent enforcement of TGA cybersecurity standards aligns purchasing toward OEMs that maintain in-country firmware support.
Regulatory Landscape
Digital X-ray systems are regulated as medical devices by Australia’s Therapeutic Goods Administration (TGA) under the Therapeutic Goods (Medical Devices) Regulations 2002, and lawful supply requires inclusion in the Australian Register of Therapeutic Goods (ARTG). In practice, diagnostic X-ray devices commonly fall under Class IIb (medium to high risk), which increases conformity assessment and post-market obligations compared with lower classes, affecting lead times for new detector, console, and software configurations.
A near-term compliance anchor is the TGA’s phased Unique Device Identification (UDI) framework, which introduces new requirements for higher-risk devices from 1 July 2026 (including Class IIb and Class III). This adds traceability, labeling, and data-management expectations across OEMs and importers, and it is starting to show up in hospital and imaging-network procurement checklists, where cybersecurity documentation and device traceability readiness are increasingly treated as tender evaluation inputs.
Competitive Landscape
Multinational conglomerates dominate, but local specialization shapes go-to-market strategy within the Australia digital X-ray market. Siemens Healthineers, Philips Healthcare, and GE Healthcare leverage global R&D pipelines to deliver detector and AI upgrades on synchronized release cycles, servicing hospital procurement frameworks that demand multi-modality consistency. Canon Medical and Fujifilm position on service responsiveness, using distributor networks such as Allrad Imaging to guarantee spare-part arrival within 48 hours in any state capital.
Competitive intensity increasingly centers on software. Pro Medicus’ Visage platform, embedded inside several GE and Siemens consoles, offers native support for lung-nodule CAD and bone-age analysis. OEMs unable to supply equivalent AI toolsets risk commoditization pressure. Local hardware innovator Micro-X entered strategic supply agreements with U.S. defense agencies for portable trauma scanners, validating export potential for technology born in Adelaide.
Private equity inflows accelerate consolidation among imaging providers themselves, indirectly shaping hardware choices. Affinity Equity Partners acquired Lumus Imaging for USD 657 million, granting the chain negotiating clout to demand fleet-wide pricing, cybersecurity audits, and standardized detector footprints that lower training complexity. As interoperability testing and penetration-test certificates become default RFP line items, smaller foreign entrants find barriers to market entry creeping upward.
Australia Digital X-Ray Industry Leaders
-
Carestream Health
-
GE Healthcare
-
Siemens Healthineers AG
-
Fujifilm Holdings Corporation
-
Koninklijke Philips NV
- *Disclaimer: Major Players sorted in no particular order
Market Opportunities and Future Outlook
Funding programs and private capital are widening the innovation pipeline for portable and software-led imaging, which is creating whitespace for digital radiography vendors and workflow platforms that connect into provider networks. In June 2026, Micro-X disclosed a Critical Technologies Challenge Program-backed research partnership with the University of Sydney, with AUD 1.3 million allocated to Micro-X for Nano Electronic X-ray hardware work. That disclosure reinforces local development around miniaturized X-ray approaches that can support lighter point-of-care systems and rural-access deployments.
AI-enabled imaging workflows are also shifting toward network-scale subscriptions, supporting opportunities for OEMs and PACS/RIS vendors to bundle detectors, consoles, and enterprise AI. In June 2026, Enlitic signed a three-year Ensight subscription agreement with Lumus Imaging covering an approximately 150-location footprint, which reflects growing willingness among large imaging groups to standardize AI workflow tooling across fleets. Separately, reimbursement-linked software clearances continue to shape adoption pathways, and 4DMedical’s TGA approval for CT:VQ, alongside the referenced MSAC submission pathway for Medicare reimbursement, illustrates how regulatory progress on imaging software can influence procurement and utilization decisions when supported by established modality infrastructure.
Recent Industry Developments
- June 2026: 4D Medical Limited received TGA approval for CT:VQ technology enabling commercial deployment across Australia. The approval supports non-contrast functional imaging at scale. It drives adoption of AI-enabled CT workflows in Australian hospitals and private networks.
- June 2026: Enlitic, Inc signed a three-year Ensight subscription with Lumus Imaging (150 locations). The agreement covers AI-enabled radiology workflow across a network of imaging sites. It strengthens Lumus Imaging’s network capabilities and AI tools in Australia, influencing device-software bundle strategies.
- April 2026: Shimadzu Medical Systems Released the RADspeed Pro XF floor-mount digital radiography DR system. New DR platform addition for hospital/clinic imaging. Expands mobile/ergonomic DR options aligned with staff shortages and throughput needs.
Research Methodology Framework and Report Scope
Market Definition and Coverage
For this study, the Australia digital X-ray market is defined as revenue generated from digital radiography systems and related detector technologies used to acquire X-ray images in clinical settings across Australia, captured at the point of sale for equipment and associated system-level components.
Scope exclusions: This sizing excludes non-X-ray imaging modalities, general IT infrastructure, and purely research-grade imaging setups that are not used for routine patient diagnosis.
Segmentation Overview
- By Portability
- Fixed Systems
- Mobile DR Systems
- Hand-held Systems
- By Detector Panel Type
- Amorphous Silicon
- CMOS
- IGZO / Flexible Panels
- By Application
- Orthopedic
- Chest Imaging
- Cardiovascular
- Dental
- Other Applications
- By End User
- Hospitals & Multispecialty Clinics
- Diagnostic Imaging Centers
- Mobile Screening Units
- Other End Users
Data Sources, Market Sizing, and Validation
Desk Research
Desk research starts by building a clear picture of imaging demand and funding signals in Australia, then mapping the equipment landscape and typical replacement behavior. We typically refer to public sources such as the Australian Institute of Health and Welfare for hospital activity context, the Australian Government Department of Health and Aged Care for Medicare and policy changes tied to diagnostic imaging, and the Therapeutic Goods Administration for device and regulatory context.
To keep the model practical, additional inputs are gathered from sources such as the Australian Bureau of Statistics for macro health spend and population trends, peer reviewed radiology and medical physics publications for dose and workflow shifts, and professional bodies such as the Royal Australian and New Zealand College of Radiologists for practice setting context. We also review company filings, investor presentations, reputable press, tender announcements, and selected paid subscriptions that support company financials, patent tracking, and shipment level trade signals where available. This list is illustrative only, and many other references are used to collect data, validate assumptions, and clarify open questions.
Primary Interviews and Surveys
Primary work is used to confirm what is actually being bought and replaced in Australia, and then to test pricing and utilization assumptions that desk sources do not spell out. We speak with a mix of hospital procurement staff, radiology managers, biomedical engineers, distributors, and service partners across major states, and we also cover private imaging centers to reflect their purchasing cycles.
These discussions help us validate the split between fixed, mobile, and hand-held units, typical detector refresh timing, and how purchase decisions shift when reimbursement rules or capital budgets change.
Distribution of primary research fieldwork respondents
| Company type | Respondent position |
|---|---|
| Top tier: 32% | CXOs: 18% |
| Mid tier: 48% | Functional/Unit leaders: 25% |
| Smaller Players: 20% | Managers: 57% |
Market-Sizing & Forecasting
Sizing is built using a combined top-down and bottom-up approach, where imaging activity and installed base signals are first converted into a realistic equipment demand pool, then checked against supplier and channel feedback. In practice, top-down logic is anchored on replacement cycles and adoption of digital radiography across care sites, followed by splitting demand across fixed rooms, mobile DR systems, and hand-held systems to reflect how purchases are planned.
To keep the model grounded, a small set of measurable inputs are emphasized, such as estimated installed base by site type, typical useful life of DR rooms and mobile units, detector panel mix shifts (for example amorphous silicon versus CMOS and flexible panels), average selling price ranges by portability class, and the share of purchases linked to new site openings versus replacements. Where data points are missing, the gap is handled through conservative ranges, which are then narrowed using interview feedback and recent tender patterns.
Forecasting uses scenario analysis supported by short time-series smoothing for key drivers, since spending cycles can move with policy changes and capital budget timing. Final totals are cross-checked with selective bottom-up approximations, including sampled ASP times implied unit demand and distributor level channel checks, and adjustments are made where the two views show a consistent spread.
Data Validation & Update Cycle
Validation is done in several passes so the final numbers do not rely on any single input. We compare outputs with independent signals such as public procurement activity, regulatory and reimbursement changes that affect imaging volumes, and expected equipment replacement timing, then investigate any jumps that do not match what practitioners report.
Before sign-off, the model and assumptions are reviewed by another analyst, and follow-up calls are triggered when key parameters like pricing bands or replacement cycles show wide variance by respondent group. Reports are refreshed annually, and interim updates are made when material events occur, such as major policy announcements or sharp pricing shifts. Right before delivery, a final check is performed so clients receive the latest updated view.
Mordor Intelligence's Australia Digital X Ray Market Estimate Compared With Other Published Estimates
Published figures for Australia digital X-ray can look far apart because different studies count different products, use different price points, and sometimes mix equipment sales with broader imaging spending. Another common reason is timing, since procurement waves can cause one year to look unusually high or low if the refresh window is not handled carefully.
The main gap comes from whether computed radiography, detector replacements, and portable variants are counted as part of the same revenue pool, where Mordor Intelligence treats the market as digital X-ray equipment value with explicit portability and detector type splits, and then applies Australia-specific replacement and ASP checks rather than a single blended regional average.
Benchmark comparison
| Source | Market Size | Gaps in Research Methodology |
|---|---|---|
| Mordor Intelligence | USD 56.92 M (2025) | |
| Industry Association A | USD 49.80 M (2025) | Often narrower equipment scope, with detector panel replacements and some mobile deployments treated as service or maintenance spend, which reduces the captured hardware value. |
| Global Consultancy B | USD 68.40 M (2025) | Commonly applies higher blended ASP assumptions and a faster digital conversion curve, and it may include adjacent purchases like software bundles that are not consistently tied to X-ray system revenue. |
The table shows that most of the spread can be explained by scope and price treatment, rather than by a different view of underlying demand. When the same year is compared, estimates move mainly with what is counted as digital X-ray revenue and how quickly ASPs are assumed to change. By keeping inputs tied to installed base, replacement timing, and observed purchasing patterns, the final market size stays transparent and repeatable for decision-making.
Key Questions Answered in the Report
How large is the Australia digital X-ray market in 2026?
It stands at USD 61.01 million, with a projected 7.18% CAGR to 2031.
Which segment is growing fastest within Australian radiography?
Mobile digital X-ray systems, advancing at a 10.05% CAGR on rising point-of-care demand.
Why are flexible detector panels gaining traction?
Their lighter weight and higher durability suit mobile units, pushing a 10.4% CAGR to 2031.
How does My Health Record influence equipment purchases?
Mandatory image uploads compel providers to replace analog gear with compliant digital consoles.
What impact do radiographer shortages have?
Staffing gaps encourage AI-enabled consoles that automate routine tasks and reduce scan times.
Who are the leading suppliers in Australia?
Siemens Healthineers, Philips Healthcare, GE Healthcare, Carestream Health, and Fujifilm together supply over 60% of shipped systems.