
Australia Diagnostic Imaging Equipment Market Size and Share
Market Overview
| Study Period | 2020 - 2031 |
|---|---|
| Forecast Data Period | 2026 - 2031 |
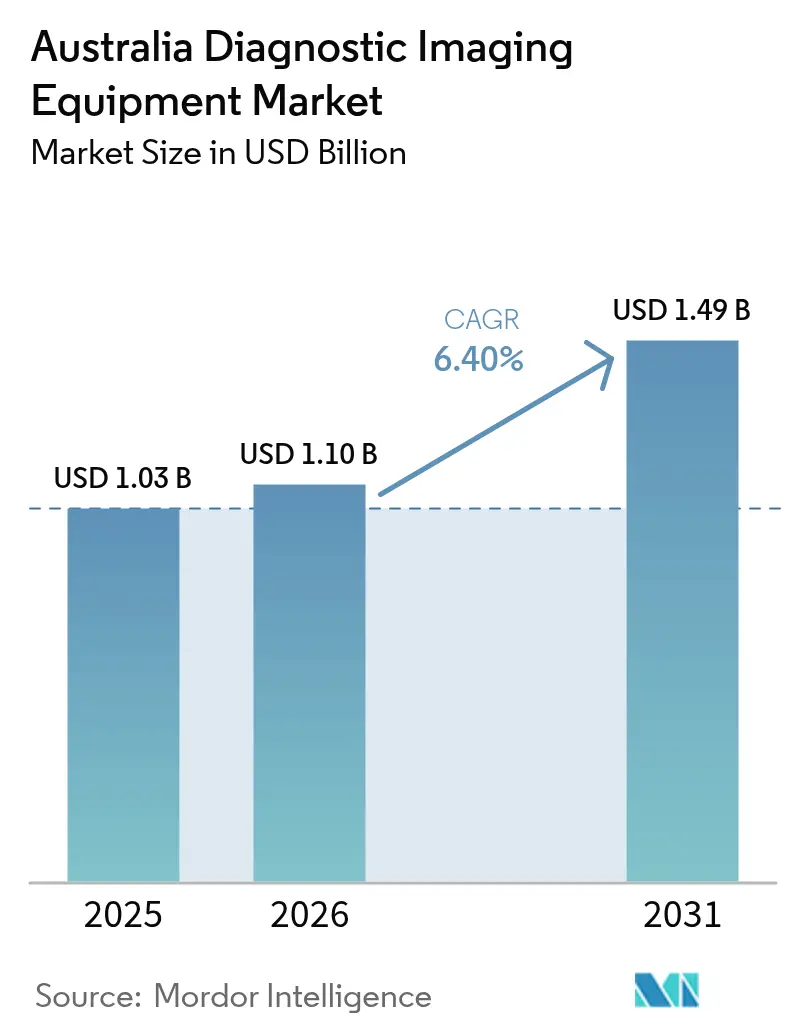
| Base Year Market Size (2025) | USD 1.03 Billion |
| Market Size (2026) | USD 1.1 Billion |
| Market Size (2031) | USD 1.49 Billion |
| Growth Rate (2026 - 2031) | 6.40 % |
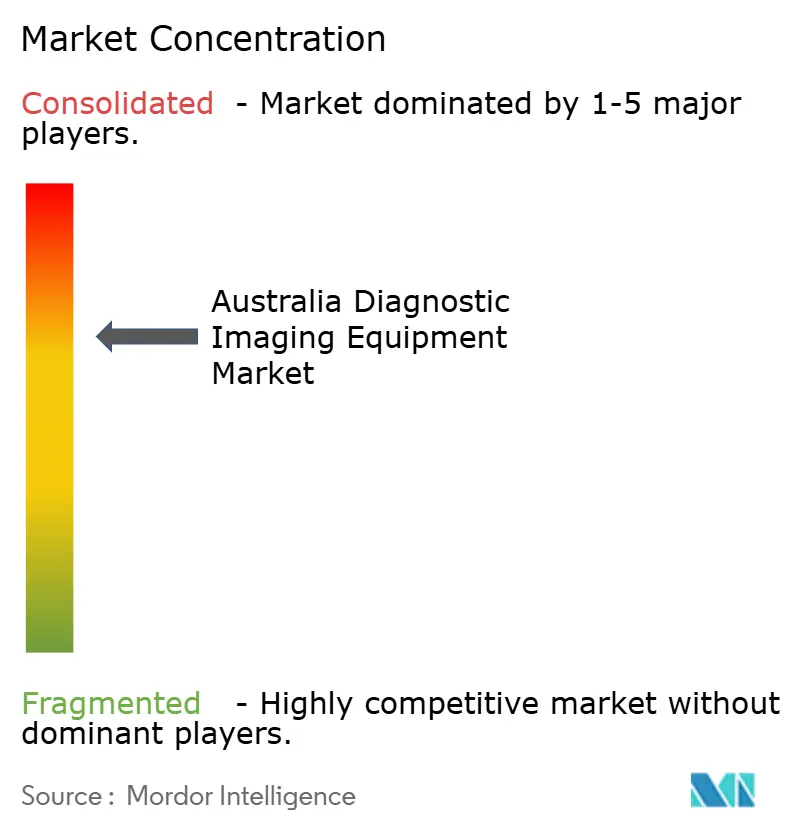
| Market Concentration | Medium |
Major Players *Disclaimer: Major Players sorted in no particular order Image © Mordor Intelligence. Reuse requires attribution under CC BY 4.0. | |
Australia Diagnostic Imaging Equipment Market Analysis by Mordor Intelligence
The Australian diagnostic imaging equipment market size is expected to grow from USD 1.03 billion in 2025 to USD 1.1 billion in 2026 and is forecast to reach USD 1.49 billion by 2031 at 6.40% CAGR over 2026-2031. Demand scales with the prevalence of chronic diseases, rapid AI deployment across modalities, and record public spending on hospital infrastructure in both countries.[1] Additional momentum comes from private-equity consolidation of imaging chains, helium-free MRI innovations that curb running costs, and teleradiology networks that extend specialist reach into sparsely populated regions. Capital-cost headwinds, sonographer shortages, and radio-isotope logistics temper growth yet are being offset by flexible finance models, national training grants, and modality-agnostic rebate reform. Overall, the Australia diagnostic imaging equipment market continues to benefit from synchronized policy, technology, and investment cycles that favor sustained equipment renewal and fleet expansion.
Key Report Takeaways
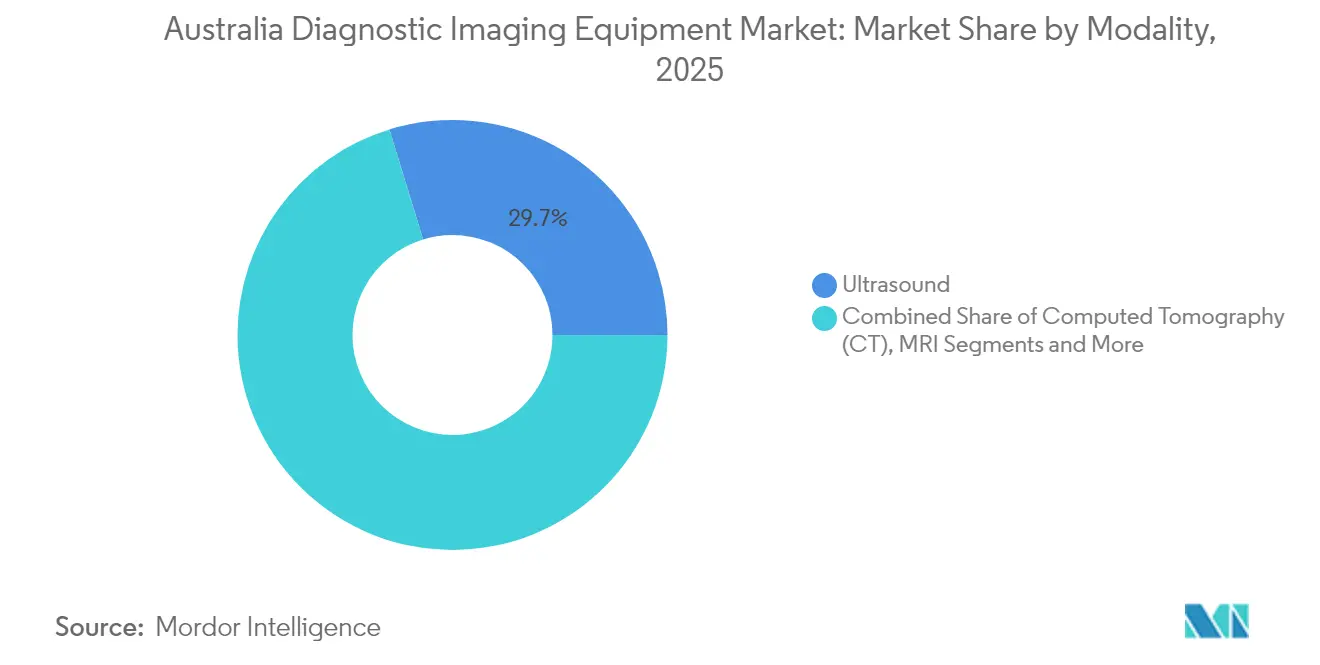
- By modality, ultrasound held 29.74% of the Australian diagnostic imaging equipment market share in 2025, while computed tomography is expected to log the fastest growth rate of 7.65% through 2031.
- By portability, fixed systems captured 81.44% share of the Australian diagnostic imaging equipment market size in 2025, and mobile or handheld platforms are forecast to expand at a 6.88% CAGR to 2031.
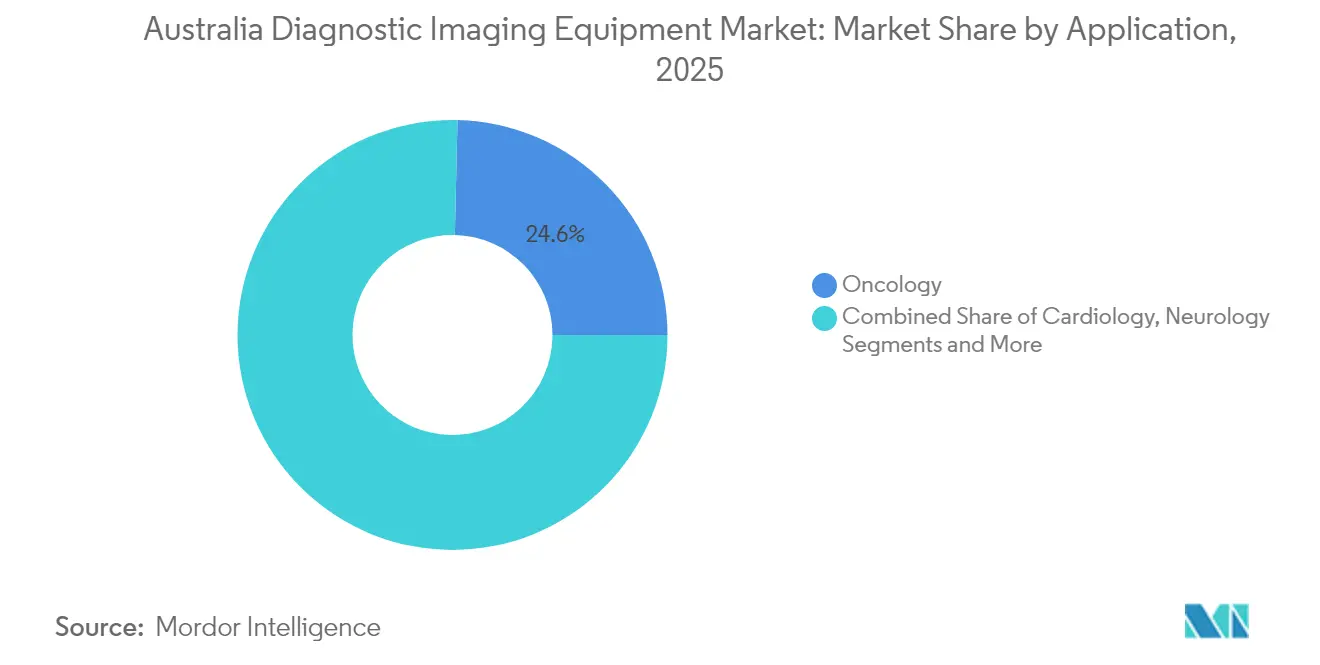
- By application, oncology accounted for a 24.63% share of the Australian diagnostic imaging equipment market size in 2025, whereas cardiology is advancing at a 7.46% CAGR over 2026-2031.
- By end-user, hospitals commanded 69.20% of the Australian diagnostic imaging equipment market share in 2025; diagnostic imaging centers registered the highest 7.31% CAGR through 2031.
Note: Market size and forecast figures in this report are generated using Mordor Intelligence’s proprietary estimation framework, updated with the latest available data and insights as of 2026.
Australia Diagnostic Imaging Equipment Market Trends and Insights
Drivers Impact Analysis*
| Driver | (~) % Impact on CAGR Forecast | Geographic Relevance | Impact Timeline |
|---|---|---|---|
| Rise in Prevalence of Chronic Diseases | +1.8% | Global, with higher burden in Australia | Long term (≥ 4 years) |
| Growing Geriatric Population | +1.5% | Australia core | Long term (≥ 4 years) |
| Increased Adoption of Advanced Imaging Technologies | +1.2% | Global, led by urban centers | Medium term (2-4 years) |
| Private-Sector Centre Consolidation | +0.9% | Australia | Short term (≤ 2 years) |
| Growth of Teleradiology in Remote Areas | +0.7% | Rural Australia focus | Medium term (2-4 years) |
| Government Initiatives with Respect to Diagnostics | +0.4% | National, with early gains in major cities | Short term (≤ 2 years) |
| Source: Mordor Intelligence | |||
Rise in Prevalence of Chronic Diseases
Cardiovascular disease and cancer remain leading death drivers, keeping demand for routine multimodal scans high. Indigenous Australians lose nearly 240,000 healthy life-years annually from illness, prompting targeted imaging subsidies in underserved regions.[2] Vendors now bundle AI triage engines such as GE HealthCare’s CareIntellect to accelerate report delivery for complex oncology pathways. National health data agencies standardize coding to track chronic-disease imaging volumes, supporting predictable equipment upgrades.
Growing Geriatric Population
Australia’s over-65 cohort expands by roughly 3.3% annually, raising incidences of osteoporotic fractures and neurodegenerative disorders that demand age-adapted imaging. Policy frameworks under the National Medical Workforce Strategy address geographic maldistribution that leaves rural elderly communities short of radiology services. Helium-free MRI, such as Siemens MAGNETOM Flow, reduces cryogen dependency while incorporating mood-lighting and noise dampening, addressing comfort concerns for elderly scans. Virtual-care megatrends project remote check-ins with integrated image sharing, shrinking repeat hospital visits for seniors.
Increased Adoption of Advanced Imaging Technologies
Annalise.ai’s CT Brain model, live in 120 Sonic Healthcare sites, improves stroke-lesion detection by 45% and showcases local AI commercialization aptitude. Canon’s Aquilion ONE INSIGHT Edition integrates machine learning for organ-adaptive dose optimization and recently won the 2024 Minnies Award. Handheld ultrasound accelerates point-of-care adoption, with GE’s Vscan Air rated best for workflow and image quality by domain experts. Regulators have introduced fast-track files for software-as-a-medical-device so hospitals can pilot AI within shorter procurement cycles.
Private-Sector Centre Consolidation
Private equity deployed USD 4.5 billion across Australian healthcare in 2022, with diagnostic imaging the headline target. Affinity Equity’s USD 965 million move for Lumus Imaging creates a 150-site network that can standardize AI platforms and negotiate national service contracts. Integral Diagnostics’ merger with Capitol Health positions the enlarged group to deploy Aidoc triage software across both countries, improving workflow automation. Larger chains gain leverage to secure bulk-billing volumes under Medicare reforms that aim for 90% GP billing rates by 2030.
Restraints Impact Analysis*
| Restraint | (~) % Impact on CAGR Forecast | Geographic Relevance | Impact Timeline |
|---|---|---|---|
| Capital Cost of Advanced Modalities | -1.4% | Australia | Medium term (2-4 years) |
| Workforce Shortage of Sonographers | -1.1% | Australia core | Long term (≥ 4 years) |
| Helium Supply Volatility for MRI | -0.8% | Global, with Australia production ending | Short term (≤ 2 years) |
| Radio-Isotope Waste-disposal Rules | -0.5% | National, with ANSTO facility impacts | Medium term (2-4 years) |
| Source: Mordor Intelligence | |||
Capital Cost of Advanced Modalities
High capital expenditure requirements for next-generation imaging systems create procurement barriers, particularly for smaller healthcare facilities. High-end 3 T MRI or spectral CT can exceed USD 3 million per unit, a threshold that strains district hospitals. Vendor finance packages and leasing are expanding, yet smaller sites still delay upgrades until depreciation schedules end. Australia’s equipment-lifespan rules grant exemptions for early replacement if efficiency gains are proven, encouraging helium-free swaps. Regulatory compliance costs add complexity, with TGA application audit updates focusing on high-risk devices requiring comprehensive documentation for conformity assessments.
Workforce Shortage of Sonographers
Australia lacks approximately 3,000 qualified sonographers and faces similar challenges, with only one university currently training general sonographers, resulting in a shortage that exceeds 120 full-time equivalent positions. Private practices conduct 70% of ultrasounds but offer limited placements for trainees, creating a bottleneck that affects appointment wait times.[3] The ASA requests USD 3.466 million over three years to support clinical training placements and regulatory inclusion, aiming to address the 15-year workforce shortage.
*Our forecasts treat driver/restraint impacts as directional, not additive. The impact forecasts reflect baseline growth, mix effects, and variable interactions.
Segment Analysis
By Modality: AI Integration Drives CT Expansion
Computed tomography posted the quickest 7.65% CAGR, helping the Australian diagnostic imaging equipment market diversify beyond ultrasound leadership. The CT upswing aligns with bedside units, such as Siemens SOMATOM On-site, that bring neuroimaging directly to intensive care beds. Ultrasound remains indispensable across obstetrics, emergency, and primary care pathways due to its portability and cost advantages. MRI growth benefits from helium-free magnet launches that trim life-cycle costs by up to 30%. X-ray systems have shifted toward flat-panel detectors and streamlined workflow guidance, while fluoroscopy platforms incorporate AI-driven dose optimization. Nuclear imaging’s progress hinges on isotope supply; yet, PET-CT retains its niche strength in oncology staging, backed by rebate increases. Mammography manufacturers are incorporating short scan times and AI lesion triage to meet breast-screening mandates. Together, these upgrades sustain a healthy replacement cycle that underpins modality-level revenue growth within the Australian diagnostic imaging equipment market.
The segment’s technology race fosters multi-vendor AI ecosystems, where algorithms from local firms like Harrison.ai can be deployed across hardware from Canon, GE, or Philips. Vendor neutrality helps private imaging chains standardize analytics fleetwide. As reimbursement now rewards quality metrics over raw throughput, software that reduces repeat scans or accelerates diagnosis holds commercial upside. This environment keeps CT and MRI demand resilient, even when capital budgets are tightened. The Australian diagnostic imaging equipment industry, therefore, witnesses continuous innovation in modalities that align clinical outcomes with cost-containment goals.

By Portability: Mobile Systems Gain Momentum
Fixed rooms still account for 81.44% of revenue, thanks to their comprehensive capabilities; however, mobile and handheld devices are starting to reshape workflows within the Australian diagnostic imaging equipment market. Handheld ultrasound alone recorded more than 2,600 emergency department scans across regional hospitals, achieving a 94% diagnostic utility. Mobile CT and MRI reduce patient transfers, thereby lowering the risk of in-hospital complications. Rural outreach programs leverage truck-mounted magnet units, creating new capital-leasing opportunities for vendors.
The rising adoption of point-of-care services also reflects clinician demand for real-time triage in primary care settings. Artificial intelligence embedded in devices like Philips Lumify automates measurement tasks, which broadens user segments beyond specialist radiologists. Regulatory authorities now provide accelerated routes for low-risk portable devices, shortening the time to market. Collectively, these forces push portability CAGR to 6.88%, reinforcing the decentralization trend that drives incremental equipment sales across the Australian diagnostic imaging equipment market.
By Application: Cardiology Accelerates Growth
Oncology accounted for a 24.63% share in 2025, as scan volumes rose in tandem with higher cancer incidence. Cardiology, however, displays the strongest forecast CAGR of 7.46% due to growing cardiovascular morbidity, new CT-FFR workflows, and AI-based echo automation. GE HealthCare’s Revolution Vibe CT offers unlimited one-beat cardiac imaging, which cuts motion artifacts and reduces beta-blocker pre-medication needs.
Neurology rides on stroke program investments, with AI triage halving door-to-needle time for thrombolysis. Orthopedics benefits from upright CT scans that examine weight-bearing joints, enhancing surgical planning. Gastroenterology utilizes endoscopic ultrasound hybrids for lesion assessment, while women’s health ultrasound incorporates advanced placenta accretion markers. Cross-fertilization between applications ensures steady scanner utilization and secures annuity service contracts, which expand the Australian diagnostic imaging equipment market size.
By End User: Imaging Centers Expand Rapidly
Hospitals held a 69.20% share in 2025, thanks to their dominance in acute care; however, dedicated imaging centers are racing ahead with a 7.31% CAGR as consolidation unlocks scale. Affinity Equity’s Lumus Imaging rollout advances center count, leading to bulk purchasing that lowers per-scan costs. Sonic Healthcare’s network deploys AI across 120 sites, demonstrating how centralized IT can rapidly enhance diagnostic quality.
Primary-care clinics enhance triage capabilities through handheld ultrasound, thereby shortening referral loops and alleviating hospital bottlenecks. Mixed-model chains that pair imaging with pathology services also emerge, capturing synergies through cross-selling. The Australian diagnostic imaging equipment market, therefore, sees end-user segmentation widen, providing vendors multiple purchase channels.
Geography Analysis
Australia accounted for 84.30% of revenue in 2025, driven by a USD 69.8 million MRI licensing expansion and a USD 266.9 million nuclear medicine rebate pool, which together lifted scan volumes across urban and regional sites. Workforce gaps remain acute, with a deficit of 3,000 sonographers, resulting in scan wait times exceeding 30 days in some states. Supply-chain vulnerabilities include technetium-99m outages and the reliance on imported helium for legacy magnets; however, the fast adoption of helium-light platforms mitigates this risk.
The policy emphasis on timely imaging aligns with the Needs-Based Funding frameworks, which channel blended payments to providers who achieve service-level benchmarks. This integrated approach supports sustainable capital allocation and underpins a resilient long-term outlook for the Australian diagnostic imaging equipment market.
Regulatory Landscape
Diagnostic imaging equipment in Australia is regulated by the Therapeutic Goods Administration (TGA) as medical devices under the Therapeutic Goods Act 1989 and the Therapeutic Goods (Medical Devices) Regulations 2002. Suppliers generally need inclusion in the Australian Register of Therapeutic Goods (ARTG) before supply, backed by technical and clinical evidence demonstrating conformity with the Essential Principles for safety and performance (Schedule 1), with additional classification and clinical evaluation considerations for active diagnostic devices.
Commercialization for imported systems typically requires an Australian sponsor, such as a local subsidiary or distributor, to carry ARTG and post-market responsibilities, while importers must also meet compliance obligations across supply and distribution. Alongside TGA requirements for device and software-based medical devices, including AI-enabled functions assessed by intended purpose, procurement economics are influenced by Medicare settings tied to modality lifespans and practice licensing, which can accelerate replacement when equipment reaches defined age thresholds and compliance needs.
Value Chain Analysis
Australia relies heavily on multinational OEMs for CT, MRI, ultrasound, X-ray, nuclear imaging, fluoroscopy, and mammography systems, with in-country sponsors and specialist distributors supporting market access, installation, and lifecycle service. Firms such as ParagonCare, INLINE Systems, and InMed Healthcare commonly sit between manufacturers and end users, including hospitals, consolidated imaging chains, and independent practices, where they bundle procurement support with applications training, accessories, parts logistics, and multi-year service agreements designed to maintain uptime across widely dispersed sites.
In parallel, third-party logistics and service partners support warehousing, calibration, and field service dispatch, which can be particularly important for regional and remote operations and for managing movements of high-value, fragile capital equipment. Software is increasingly a distinct value-chain layer, since AI-enabled imaging tools and workflow platforms still need to fit within TGA medical-device requirements and ARTG inclusion pathways, pushing providers toward integrated IT deployment models covering scanners, PACS/RIS connectivity, cybersecurity, and ongoing software updates across vendor-neutral or multi-vendor environments.
Competitive Landscape
Market power is shared by multinational OEMs, including Siemens Healthineers, GE HealthCare, Philips, Canon, and Fujifilm, alongside fast-growing AI specialists such as Annalise.ai and Harrison.ai. The top five equipment suppliers collectively control a significant share of installed systems, while service chains such as Sonic Healthcare, Integral Diagnostics, Lumus Imaging, and I-Med network broaden their purchasing influence. Harrison.ai secured USD 112 million in 2025 to refine multi-modality algorithms now used by half of Australian radiologists, covering 6 million patients annually.
Strategic alliances move the needle. GE HealthCare collaborates with NVIDIA to co-develop autonomous X-ray positioning and ultrasound scanning solutions, addressing staff shortages and enhancing throughput. Siemens introduces Ciartic Move, a self-driving C-arm that cuts intra-operative imaging time by up to 50%. Philips’ BlueSeal helium-light MRI reduces energy use by 40 MWh annually per system, securing eco-credibility and appealing to hospital-sustainability charters.
Disruptive entrants include Micro-X, which won a USD 16.4 million ARPA-H grant to create a full-body mobile CT that may challenge incumbent scanner architecture. AI interoperability remains the pivot on which providers choose vendors, pushing legacy suppliers to open software interfaces. These dynamics sustain competitive intensity even as the Australia diagnostic imaging equipment market gradually concentrates through mergers and platform standardization.
Australia Diagnostic Imaging Equipment Industry Leaders
-
Siemens Healthineers AG
-
Koninklijke Philips N.V.
-
GE HealthCare
-
Canon Medical Systems Corp
-
Fujifilm Holdings Corp
- *Disclaimer: Major Players sorted in no particular order
Market Opportunities and Future Outlook
Public-sector capacity expansion and major hospital redevelopments are building active procurement pipelines for high-end CT and MRI, particularly beyond the largest metro cores. In May 2026, Queensland announced a Statewide MRI and CT Expansion Program allocating AUD 276 million for 11 new MRI and CT installations across regional Queensland. New South Wales also continued equipment refresh tied to major redevelopments, including advanced imaging technology delivered to Nepean Hospital as part of its Stage 2 redevelopment and a completed medical imaging upgrade at Wollongong Hospital (April 2026). These programs support opportunities for OEMs and integrators able to deliver turnkey rooms, align installation scheduling to construction timelines, and provide regional maintenance coverage.
Medicare mechanisms further support a structured replacement cycle for installed fleets through modality lifespans and related compliance settings, creating demand for upgrades that improve dose management, throughput, and energy use. At the same time, gaps in workforce capacity and rural access point to solutions such as AI-enabled workflow software and portable imaging configurations that reduce reliance on scarce specialist staff. Vendor financing and managed service models also help smaller facilities manage high upfront costs for advanced modalities.
Recent Industry Developments
- May 2026: Queensland Health announced the Statewide MRI and CT Expansion Program, allocating AUD 276 million for 11 new MRI and CT scanner installations across regional Queensland. The program expands capacity outside major metro corridors and creates a multi-site procurement runway spanning equipment supply, room build, and long-term service coverage.
- November 2025: Philips partnered with Lumus Imaging to deploy six CT 5300 scanners across multiple Brisbane-area locations, including Browns Plains, Sandgate, Peninsula Private Hospital, North Lakes, Ipswich, and Meadowbrook. The rollout reflects how consolidated imaging providers are standardizing fleets to simplify maintenance, protocol consistency, and software upgrades across networks.
- February 2024: Australian X-ray innovator Micro-X secured up to USD 16.4 million from ARPA-H to develop a full-body mobile CT scanner. The funding supports a potentially disruptive mobile CT architecture and adds competitive pressure on conventional fixed-room CT deployments in use cases where portability and rapid triage drive value.
Research Methodology Framework and Report Scope
Market Definition and Coverage
This market tracks the revenue generated from diagnostic imaging equipment sold and installed in Australia, covering the major imaging modalities used to produce medical images in clinical settings.
Scope exclusions: Imaging services, radiology IT software, and ongoing service contracts are excluded from the market totals.
Segmentation Overview
- By Modality
- MRI
- Computed Tomography (CT)
- Ultrasound
- X-ray
- Nuclear Imaging (SPECT / PET)
- Fluoroscopy
- Mammography
- By Portability
- Fixed Systems
- Mobile and Hand-held Systems
- By Application
- Cardiology
- Oncology
- Neurology
- Orthopedics
- Gastroenterology
- Gynecology
- Other Applications
- By End User
- Hospitals
- Diagnostic Imaging Centres
- Other End-users
Data Sources, Market Sizing, and Validation
Desk Research
We start by aligning the scope and terminology using publicly available healthcare and device references, then build a fact base around equipment demand, funding, and replacement activity in Australia. Core inputs come from the Australian Institute of Health and Welfare, the Australian Bureau of Statistics, the Department of Health and Aged Care (including MBS-related public information), and the Therapeutic Goods Administration, which provides device registration and regulatory context.
To turn these references into a workable model, we also review import and trade statistics, peer-reviewed clinical and health economics literature, and releases from professional bodies tied to radiology and medical imaging. Company annual reports, investor decks, and reputed press sources help validate product launches and approximate order timing. Where needed, we use a paid subscription for company financials and another for patent activity to support cross-checks. These desk sources are illustrative only, and many other references were also used for collection, validation, and clarification.
Primary Interviews and Surveys
Next, we validate the sizing logic through expert interviews and structured surveys with stakeholders across the equipment ecosystem, including distributors, hospital imaging and biomedical teams, diagnostic imaging centers, and service partners. Since this is an Australia-only market, fieldwork focused on demand patterns across major states and metro clusters, and then extended to regional coverage to test replacement cycles, tender timing, and modality mix assumptions.
Distribution of primary research fieldwork respondents
| Company type | Respondent position |
|---|---|
| Top tier: 28% | CXOs: 13% |
| Mid tier: 52% | Functional/Unit leaders: 31% |
| Smaller Players: 20% | Managers: 56% |
Market-Sizing & Forecasting
Sizing is built using a top-down approach where equipment demand is reconstructed from the active imaging base and expected replacement and expansion, then translated into annual purchases by modality. To keep the totals realistic, we corroborate results with selective bottom-up checks, such as sampling unit volumes for key modalities and applying observed average selling price ranges, followed by channel feedback on share splits.
Key inputs that move the model include the estimated installed base by modality, typical useful life and refresh cycles for scanners, public and private capital spending patterns, utilization pressures that trigger capacity adds, and import trends for high value systems that are largely sourced from abroad. Forecasts use scenario analysis, where replacement timing, budget tightening or loosening, and modality mix shifts are adjusted based on what interviewees expect for the next procurement cycle. If bottom-up inputs are incomplete, we fill gaps using conservative unit assumptions anchored to installed base logic, then re-test them through interview follow-ups before locking totals.
Data Validation & Update Cycle
We run multi-step checks before finalizing the market numbers, starting with internal reviews of assumptions, unit logic, and pricing ranges by modality. Outputs are compared against independent signals such as trade flows, public procurement cues, and major installation announcements, and then any outliers are re-worked until the drivers are explainable.
If a variance is large, or a new policy or tender cycle changes timing, respondents are re-contacted so the model reflects the latest reality rather than stale assumptions. Reports are refreshed annually, with interim updates when material events occur. Before delivery, a final analyst pass ensures the latest available inputs are reflected.
Mordor Intelligence's Australia Diagnostic Imaging Equipment Market Size Versus Other Published Estimates
Published market sizes for diagnostic imaging in Australia often differ, even when they claim to cover the same topic, because the counted revenue streams and base years are not aligned. In practice, differences show up when one estimate measures equipment-only spending, and another blends software, service contracts, or broader imaging related revenue.
Imaging services revenue sits outside Mordor Intelligence's scope here, which is one reason the 2025 number looks higher than some medical imaging figures that use an earlier base year and a different definition of revenue capture. Other gaps can come from how average selling prices are stepped up over time, whether refurbished systems are counted, and how quickly assumptions are refreshed when tenders shift or currency moves.
Benchmark comparison
| Source | Market Size | Gaps in Research Methodology |
|---|---|---|
| Mordor Intelligence | USD 1.03 B (2025) | |
| Global Consultancy A | USD 0.74 B (2024) | Uses an earlier base year and a broader medical imaging revenue view that can mix technology categories and may not isolate equipment purchases from adjacent revenue streams, which pulls totals down versus an equipment-focused count. |
| Industry Publisher B | USD 0.73 B (2024) | Often reported as a diagnostic imaging market number with limited visibility on modality-level unit logic and replacement timing, and can rely on fixed growth rates rather than procurement-cycle resets, which changes the level in the base year. |
The spread across the table mainly reflects definition and timing, not just forecasting optimism. When the market is rebuilt from installed base, replacement rhythm, and modality mix, the resulting number is easier to trace back to observable purchase drivers and to reproduce during future refreshes.
Key Questions Answered in the Report
What is the 2025 value of the Australia diagnostic imaging equipment sector?
The market was valued at USD 1.03 billion in 2025.
How fast is computed tomography expanding in the region?
CT is projected to grow at a 7.65% CAGR between 2026 and 2031.
Which segment commands the largest application share?
Oncology leads with 24.63% of total 2025 revenue.
Why are helium-free MRI systems gaining traction?
They cut operational costs, lessen supply-chain risk, and improve sustainability goals.
What government action will widen MRI access from 2025?
Australia's Medicare moves to practice-based licensing, moving the number of eligible MRI scanners from 227 to 620.