
Market Overview
| Study Period | 2020 - 2031 |
|---|---|
| Forecast Data Period | 2026 - 2031 |
| Base Year Market Size (2025) | USD 840 Billion |
| Market Size (2026) | USD 0.87 Billion |
| Market Size (2031) | USD 1.03 Billion |
| Growth Rate (2026 - 2031) | 3.38 % |
| Market Concentration | Medium |
Major Players *Disclaimer: Major Players sorted in no particular order Image © Mordor Intelligence. Reuse requires attribution under CC BY 4.0. | |
Australia Diabetes Drugs Market Analysis by Mordor Intelligence
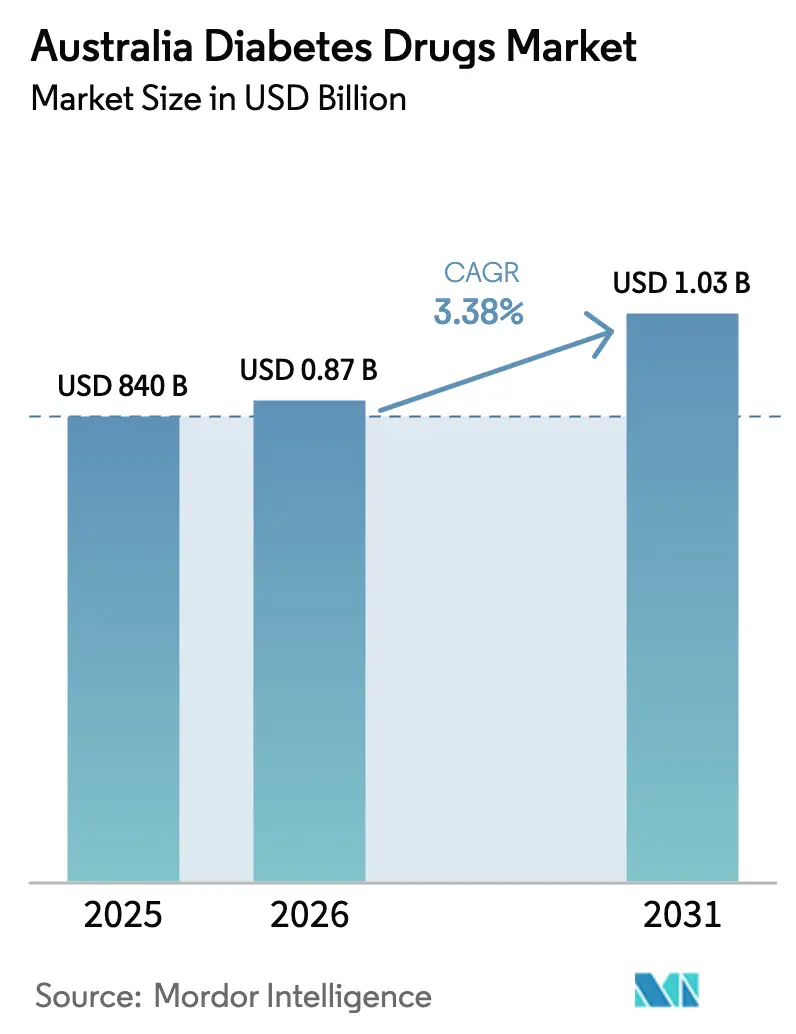
The Australia Diabetes Drugs Market size is expected to grow from USD 840 million in 2025 to USD 870 million in 2026 and is forecast to reach USD 1.03 billion by 2031 at 3.38% CAGR over 2026-2031.
The COVID-19 epidemic boosted the expansion of the Australia Diabetes Drugs Market. Diabetes patients infected with COVID-19 may have high blood glucose levels, irregular glucose variability, and diabetic complications. According to the Australian Government Department of Health and Aged Care, there have been 92,35,681 confirmed cases of COVID-19 in Australia since the pandemic's commencement in July 2022. Diabetes prevalence in adults with COVID-19 produced a substantial increase in COVID-19 severity and mortality in people with type 1 (T1DM) or type 2 diabetes mellitus (T2DM), particularly in connection with poor glycemic control. While new-onset hyperglycemia and diabetes (both T1DM and T2DM) have become more recognized in the setting of COVID-19 and have been linked to worse outcomes. To minimize aggravation, a patient's blood glucose should be checked and maintained on a regular basis, emphasizing the significance of diabetes care medicines.
Obesity, a poor diet, and physical inactivity are all contributing to a rise in the number of newly diagnosed Type 1 and Type 2 diabetes cases. The fast-rising incidence and prevalence of diabetes patients, as well as healthcare spending in industrialized nations, are indicators of increased use of diabetic care products. Furthermore, rising diabetes incidence and increased usage of insulin delivery devices are boosting market expansion. Leading manufacturers are focused on technical advancements and the creation of improved goods to achieve a significant market share.
Note: Market size and forecast figures in this report are generated using Mordor Intelligence’s proprietary estimation framework, updated with the latest available data and insights as of 2026.
Australia Diabetes Drugs Market Trends and Insights
Oral-Anti Diabetes Drugs is Having the Highest Market Share in the Current Year.
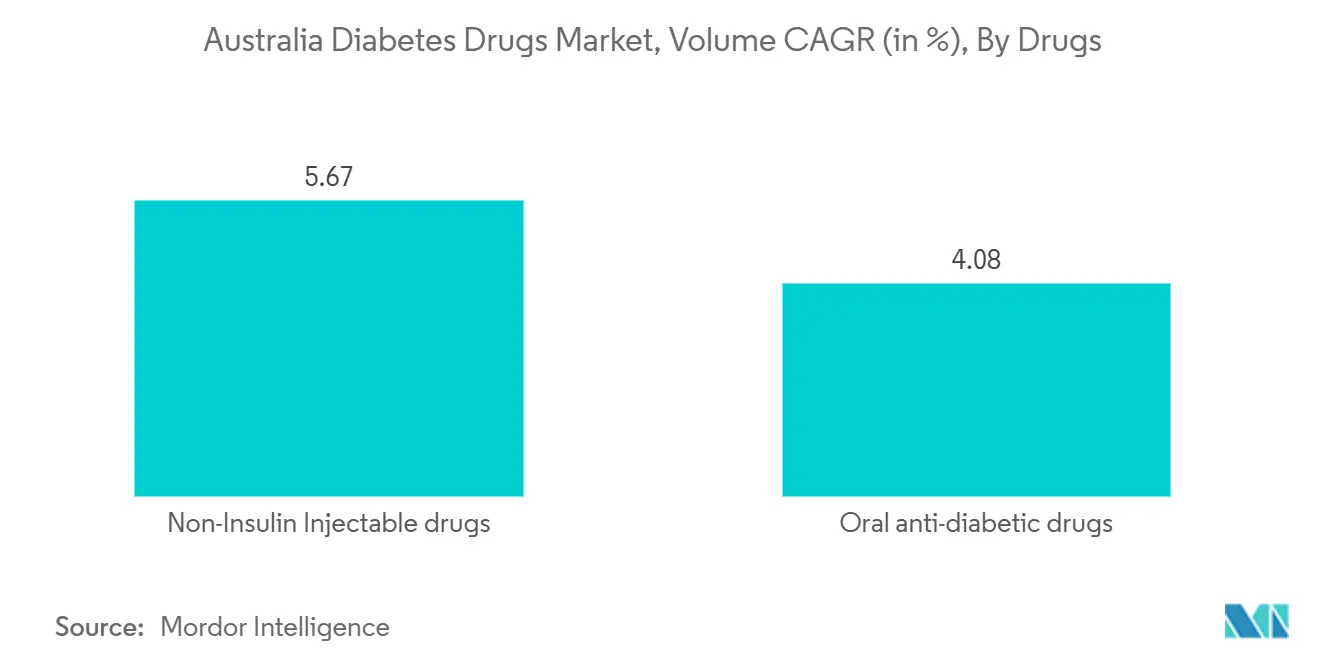
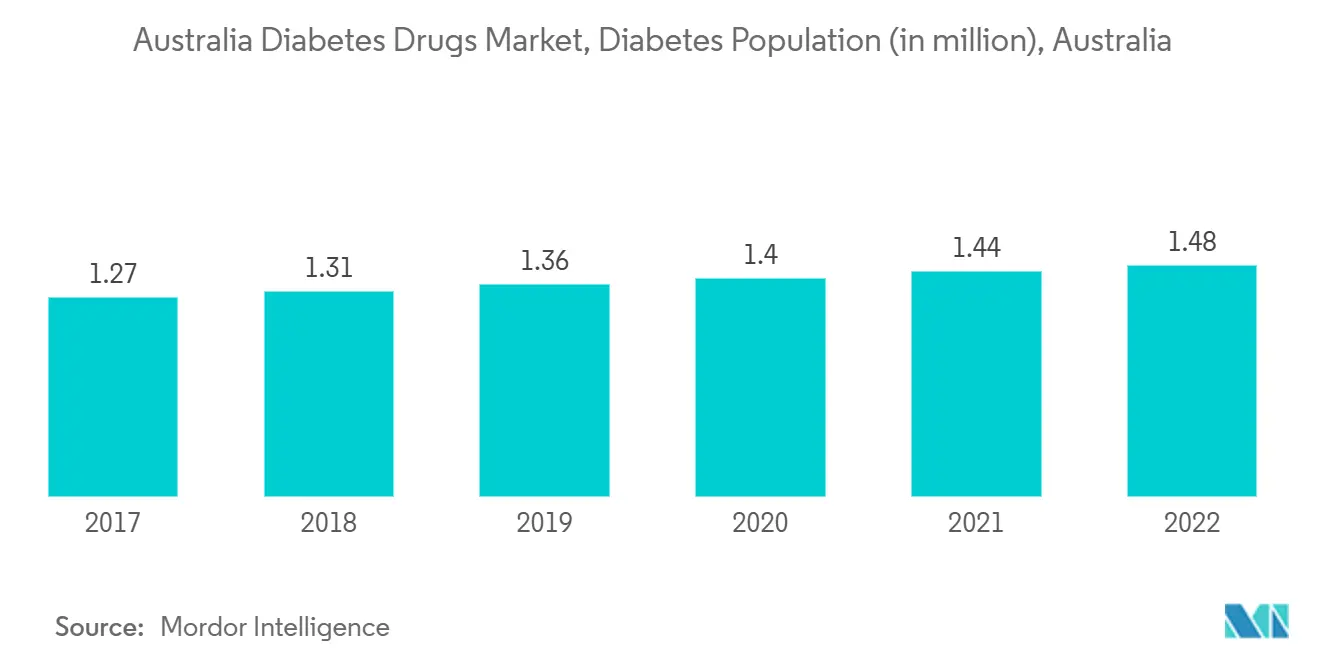
The Oral-Anti Diabetes Drugs segment is expected to increase with a CAGR of over 5% during the forecast period, mainly due to the demand from the diabetes population, which was more than 1.4 million by the end of the current year.
According to the Australian National Health Survey 2020-2021, one out of every 20 persons (5.3%) suffers from diabetes. Type 2 diabetes was the most frequent (85.5%), followed by Type 1 diabetes (11.0%) and diabetes not known by the individual reporting (4.1%). Diabetes patients are diagnosed with blood glucose imbalances that do not follow conventional blood glucose values. The common lab diagnostic tests can only assist physicians in diagnosing the condition. Patients whose glucose levels fluctuate more often should monitor it every day. Patients who use insulin must monitor their blood glucose levels often and alter insulin dosages or change medications as needed. People with type 2 diabetes who do not use insulin need oral drugs frequently. The Australian National Diabetes Strategy was developed in response to diabetes and outlined how existing limited healthcare resources across all levels of government might be effectively integrated and targeted. This strategy identifies the most effective and suitable strategies to decrease the community burden of diabetes and sets the standard for diabetes prevention, care, and research on a global scale.
Diabetes pills are not insulin taken orally. People with type 2 diabetes are frequently prescribed drugs, including insulin, to help them control their blood glucose levels. Most of these drugs are taken as pills; others are administered through injection. Tablets and injections are meant to supplement, not replace, a balanced diet and frequent physical exercise.
Through the Australian government's encouragement, the usage of drugs increased over the forecast period.
The rising prevalence of diabetes in Australia is boosting the country's diabetes drug market.
Diabetes prevalence occurred in Australia more than quadrupled between 1991 and 2021. In current, Australia includes around more than 2 million diabetes patients. According to Mordor Intelligence statistics, Type-2 diabetes patients accounted for most of the overall diabetic population in Australia in the current year. Nevertheless, diabetes is far more prevalent in Australia than in many other nations. One of the primary goals of diabetes therapy is to keep blood glucose levels within a certain target range. It can be accomplished by balancing food, activity, lifestyle, and diabetes medications. Blood glucose monitoring results give the information needed to establish the appropriate diabetes care approach. Maintaining target blood glucose levels can help minimize a person's chance of acquiring various diabetes-related problems such as diabetic retinopathy, heart disease, renal disease, etc. The frequency with which patients with diabetes who take insulin check their blood glucose levels varies depending on various factors.
Because of the early age and longer diabetes duration, youth are more likely to get diabetes at a younger age, lowering their quality of life, shortening their life expectancy, and increasing societal healthcare expenditures. As a result, the demand for diabetes care drugs is growing, and their acceptance rate is increasing, driving the market. In addition, with increased awareness among Type 2 diabetes patients, the need for Diabetes drugs is developing rapidly.
Thus, the above factors are expected to drive the market growth over the forecast period.
Competitive Landscape
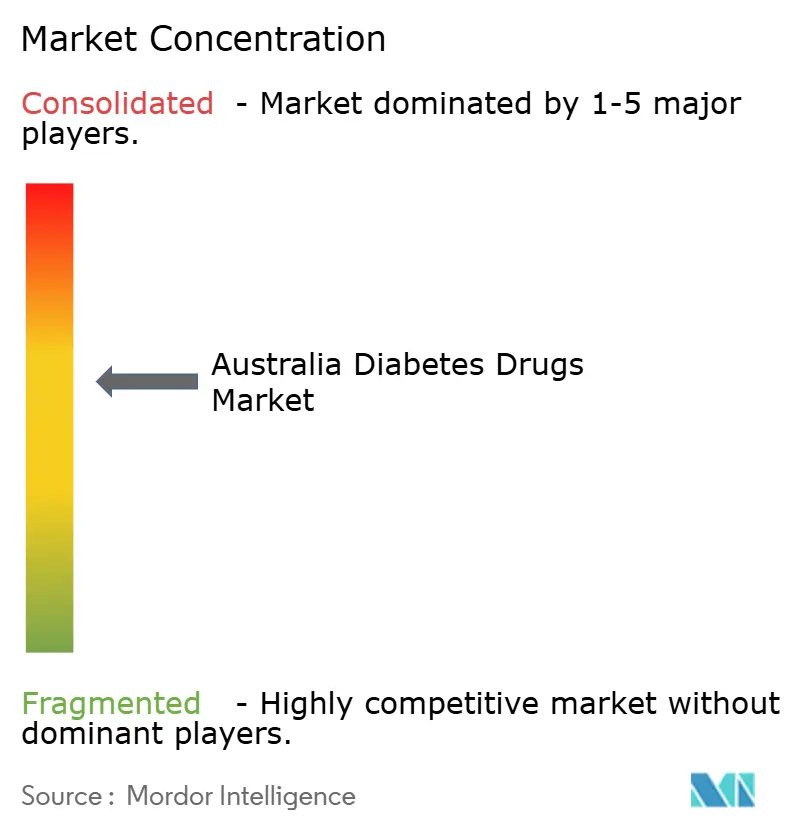
The diabetes drugs market is moderately fragmented, with few significant generic players. A few major players, like Novo-Nordisk, Sanofi, AstraZeneca, and Bristol Myers Squibb, dominate the insulin drugs and Sglt-2 drugs market. The market for oral drugs, like Sulfonylureas and Meglitinides, comprises more generic players. The intensity of competition among the players is high, as each player is striving to develop new drugs and offer them at competitive pricing. Furthermore, players are tapping into new markets to increase their market shares. It is especially applicable in emerging economies where the demand is very high compared to the supply.
Australia Diabetes Drugs Industry Leaders
-
Eli Lilly
-
Boehringer Ingelheim
-
Astrazeneca
-
Sanofi
-
NovoNordisk
- *Disclaimer: Major Players sorted in no particular order
Market Opportunities and Future Outlook
The diabetes drug market is valued at USD 0.87 billion in 2026, and the near-term opportunity remains most visible in reimbursement and access pathways that convert guideline intent into prescribing volume. The PBS is reviewing restriction changes for type 2 diabetes medicines, with the stated aim of simplifying restrictions and aligning with clinical guidelines, including considerations for expanded access for high-risk patients and people identifying as Aboriginal or Torres Strait Islander. As these listing and restriction updates progress, they create a clearer channel for wider use across oral agents and non-insulin injectables.
Commercial scale in Australia continues to be shaped by the interplay between TGA registration and PBS outcomes. Tresiba (insulin degludec) Penfill being added to the PBS from July 2026 for type 1 diabetes supports switching toward modern insulin presentations, while Eli Lilly's April 2026 decision not to proceed with a PBS listing for Mounjaro (tirzepatide) despite a PBAC recommendation highlights how pricing and funding conditions affect uptake. In parallel, the TGA introduced the Therapeutic Goods (Restricted Representations - Diabetes Devices) Permission 2026, enabling specified advertising for diabetes devices, including glucose monitoring and insulin pump technologies, which can support demand for drug-device integrated diabetes management solutions.
Recent Industry Developments
- July 2026: Novo Nordisk Australia: Tresiba (insulin degludec) Penfill listed on the Pharmaceutical Benefits Scheme (PBS) for subsidised access (age 1+). The PBS listing expands patient affordability and adherence for long-acting insulin therapy. It also reinforces Novo Nordisk Australia's position in the long-acting insulin market and may shift prescribing toward modern pen formats.
- May 2026: Sanofi: TGA registered TZIELD (teplizumab) to delay onset of Stage 3 type 1 diabetes in adults and children aged 8+ with Stage 2 disease. This regulatory milestone adds a disease modifying option in autoimmune diabetes management. It expands Sanofi's portfolio and could influence future pricing and coverage considerations.
- April 2026: Eli Lilly Australia: Mounjaro (tirzepatide) PBS listing proposal declined by Lilly due to pricing and funding conditions despite PBAC recommendation. The decision points to pricing pressures and access hurdles for new weight and cardiometabolic therapies. It also highlights challenges for market entry strategies in Australia.
Research Methodology Framework and Report Scope
Market Definition and Coverage
This market covers prescription medicines used to treat diabetes in Australia, counted as sales value across therapies used to control blood glucose in clinical practice and retail dispensing channels.
Scope exclusions: Devices, testing supplies, and diabetes management services are excluded from this drugs-only market value.
Segmentation Overview
- Oral Anti-diabetic drugs
- Biguanides
- Metformin
- Alpha-Glucosidase Inhibitors
- Alpha-Glucosidase Inhibitors
- Dopamine D2 receptor agonist
- Bromocriptin
- SGLT-2 inhibitors
- Invokana (Canagliflozin)
- Jardiance (Empagliflozin)
- Farxiga/Forxiga (Dapagliflozin)
- Suglat (Ipragliflozin)
- DPP-4 inhibitors
- Onglyza (Saxagliptin)
- Tradjenta (Linagliptin)
- Vipidia/Nesina(Alogliptin)
- Galvus (Vildagliptin)
- Sulfonylureas
- Sulfonylureas
- Meglitinides
- Meglitinides
- Biguanides
- Insulins
- Basal or Long Acting Insulins
- Lantus (Insulin Glargine)
- Levemir (Insulin Detemir)
- Toujeo (Insulin Glargine)
- Tresiba (Insulin Degludec)
- Basaglar (Insulin Glargine)
- Bolus or Fast Acting Insulins
- NovoRapid/Novolog (Insulin Aspart)
- Humalog (Insulin Lispro)
- Apidra (Insulin Glulisine)
- Traditional Human Insulins
- Novolin/Actrapid/Insulatard
- Humulin
- Insuman
- Biosimilar Insulins
- Insulin Glargine Biosimilars
- Human Insulin Biosimilars
- Basal or Long Acting Insulins
- Non-Insulin Injectable drugs
- GLP-1 receptor agonists
- Victoza (Liraglutide)
- Byetta (Exenatide)
- Bydureon (Exenatide)
- Trulicity (Dulaglutide)
- Lyxumia (Lixisenatide)
- Amylin Analogue
- Symlin (Pramlintide)
- GLP-1 receptor agonists
- Combination drugs
- Insulin combinations
- NovoMix (Biphasic Insulin Aspart)
- Ryzodeg (Insulin Degludec and Insulin Aspart)
- Xultophy (Insulin Degludec and Liraglutide)
- Oral Combinations
- Janumet (Sitagliptin and Metformin)
- Insulin combinations
Data Sources, Market Sizing, and Validation
Desk Research
Desk work starts by grounding the demand pool, treatment context, and reimbursement setting for diabetes medicines in Australia, then mapping that to what can realistically be captured as revenue. Public sources help quantify how many people live with diabetes, how treatment is typically stepped, and how policy settings can shift the drug mix over time.
We referenced non-paywalled sources such as the Australian Institute of Health and Welfare, the Australian Bureau of Statistics, the Department of Health and Aged Care (PBS information), and the Therapeutic Goods Administration for product and regulatory context. We also reviewed clinical guidance and peer-reviewed literature to interpret therapy-line movement (for example, when oral therapies are escalated to injectables), and we used company filings and investor materials to sanity-check category direction and timing. Where needed, paid subscriptions for company financials and patent databases were used to fill specific gaps and to validate product activity signals. These examples are illustrative rather than exhaustive, and many other public documents and datasets were also used for data collection, cross-checks, and clarification.
Primary Interviews and Surveys
Primary work was used to validate what is actually driving value in Australia, including therapy switching, persistence patterns, and how pricing and reimbursement behave in real purchasing conditions. We spoke with a mix of manufacturers, distributors, clinicians, pharmacists, and payer or reimbursement-facing experts across major states, so the assumptions from desk research could be tested and adjusted where needed.
Distribution of primary research fieldwork respondents
| Company type | Respondent position |
|---|---|
| Top tier: 28% | CXOs: 12% |
| Mid tier: 58% | Functional/Unit leaders: 36% |
| Smaller Players: 14% | Managers: 52% |
Market-Sizing & Forecasting
Sizing is built from a top-down, treatment based reconstruction, where the diabetes patient pool is translated into treated patients by therapy class, then converted into market value using typical annualized use and observed price levels. To keep the model practical, inputs were tied to measurable indicators such as diabetes prevalence and diagnosed population trends, share of patients treated with insulin versus non-insulin therapies, switching and add-on rates between oral drugs and injectables, PBS listing and reimbursement settings, and category level price movement driven by mix and product life cycle.
Selective bottom-up checks were then used to test whether totals are sensible, including supplier revenue cues from public disclosures, channel feedback on category momentum, and sampled volume times average selling price logic at the therapy-class level. When direct volume proxies were thin for a niche class, we filled gaps using adjacent-class adoption ratios and clinician feedback on how often that class is used, then rechecked the implied spend per treated patient.
Forecasts were developed using scenario analysis supported by trend smoothing on key variables, then adjusted through expert consensus on near-term therapy mix changes, reimbursement inflection points, and expected persistence behavior. The final forecast remains traceable to a small set of drivers, so it can be updated quickly when new policy or utilization signals show up.
Data Validation & Update Cycle
Validation is done through stepwise checks that compare outputs against independent signals, such as implied spend per treated patient, class mix plausibility, and year to year changes versus known policy or prescribing shifts. If the model shows a sudden jump in a class where there was no clear clinical or reimbursement trigger, assumptions are revisited and respondents may be re-contacted for clarification.
Before sign-off, the dataset and calculations go through more than one analyst review so unit logic, currency handling, and growth math remain consistent across all years. Reports are refreshed annually, and interim updates are done when material events occur that can move access, pricing, or therapy mix. Right before delivery, a final pass is completed so clients receive the most current view based on the latest available inputs.
Mordor Intelligence's Australia Diabetes Drugs Market Sizing Compared With Other Published Estimates
Published market sizes can vary even when people talk about the same topic, because the inclusion list, year basis, and pricing treatment are not always aligned. Differences also show up when one estimate is built around patient treatment usage and another is built around broader healthcare spending buckets.
Diabetes devices and monitoring supplies sit outside Mordor Intelligence's scope here, which is a common reason why some public figures look larger when they bundle pumps, CGM sensors, or test strips with drug revenue. Other gaps usually come from how combination therapies are counted, whether values reflect reimbursed pricing versus list pricing, and how fast price and mix are allowed to change in the forecast period, especially when newer injectables gain share.
Benchmark comparison
| Source | Market Size | Gaps in Research Methodology |
|---|---|---|
| Mordor Intelligence | USD 0.84 B (2025) | |
| Industry Association A | USD 1.12 B (2025) | Often reported as a broader diabetes care total that can bundle drugs with monitoring supplies and delivery aids, which inflates value versus a medicines-only scope. |
| Trade Journal B | USD 0.76 B (2024) | Uses an earlier base year and can apply conservative uptake for newer injectables, and it may rely on list-price style pricing without fully reflecting reimbursement and mix shifts. |
Reading across the table, much of the spread can be explained by what is counted as part of diabetes care, plus timing and price basis. By keeping the scope limited to drug categories and tying value to a treated-patient and therapy mix build, our estimate stays easier to reconcile to real utilization signals and to update when access or prescribing patterns change.
Key Questions Answered in the Report
How big is the Australia Diabetes Care Drugs Market?
The Australia Diabetes Drugs Market size is expected to reach USD 870 million in 2026 and grow at a CAGR of 3.38% to reach USD 1.03 billion by 2031.
What is the current Australia Diabetes Drugs Market size?
In 2026, the Australia Diabetes Drugs Market size is expected to reach USD 870 million.
Who are the key players in Australia Diabetes Drugs Market?
Eli Lilly, Boehringer Ingelheim, Astrazeneca, Sanofi and NovoNordisk are the major companies operating in the Australia Diabetes Drugs Market.
What years does this Australia Diabetes Drugs Market cover, and what was the market size in 2025?
In 2025, the Australia Diabetes Drugs Market size was estimated at USD 840 million. The report covers the Australia Diabetes Drugs Market historical market size for years: 2020, 2021, 2022, 2023, 2024 and 2025. The report also forecasts the Australia Diabetes Drugs Market size for years: 2026, 2027, 2028, 2029, 2030 and 2031.