
| Study Period | 2018 - 2030 |
| Base Year For Estimation | 2024 |
| Forecast Data Period | 2025 - 2030 |
| Market Volume (2025) | 2.18 Thousand MW |
| Market Volume (2030) | 4.07 Thousand MW |
| CAGR | 13.35 % |
| Market Concentration | Low |
Major Players*Disclaimer: Major Players sorted in no particular order |


Australia Data Center Market Analysis
The Australia Data Center Market size is estimated at 2.18 thousand MW in 2025, and is expected to reach 4.07 thousand MW by 2030, growing at a CAGR of 13.35%. Further, the market is expected to generate colocation revenue of USD 2,501.8 Million in 2025 and is projected to reach USD 5,318.5 Million by 2030, growing at a CAGR of 16.28% during the forecast period (2025-2030).
The data center industry in Australia is experiencing significant transformation driven by increasing cloud adoption and digital infrastructure demands. As of 2022, approximately 42% of businesses in Australia reported using cloud computing services, highlighting the growing enterprise shift toward digital solutions. The government sector is playing a pivotal role in shaping the data center market landscape, with the Digital Transformation Agency (DTA) implementing a new whole-of-government data panel in July 2023 that requires government agencies to use accredited data center providers for hosting sensitive data systems. This regulatory framework has created a structured approach to data center services while ensuring high security standards and operational excellence.
The market is witnessing substantial infrastructure investments and facility expansions from major industry players. NextDC's development of an AUD 1.5 billion Melbourne facility represents one of the largest investments in the sector, demonstrating the scale of infrastructure development underway. STACK Australia's ongoing construction of a 72 MW campus in Melbourne's western suburbs, scheduled for completion in 2024, further exemplifies the market's robust data center growth trajectory. These developments are characterized by an increasing focus on sustainability, advanced cooling technologies, and higher power densities to meet evolving customer demands.
The industry is experiencing a notable shift toward higher-tier facilities, with Tier 3 data centers offering 99.98% uptime and N+1 redundancies becoming the minimum standard for enterprise-grade operations. This evolution is accompanied by a growing emphasis on sustainability and energy efficiency, with providers increasingly adopting renewable energy sources and implementing advanced cooling technologies. The market is also seeing rapid advancement in facility certifications and security standards, with providers pursuing various international certifications to meet the demanding requirements of enterprise and government clients.
Social media and digital content consumption are driving significant data center market trends, with 82.7% of the Australian population being active social media users as of February 2022. This high digital engagement is prompting data center operators to enhance their infrastructure capabilities and expand their service offerings. The industry is witnessing increased adoption of edge computing solutions and distributed architecture to support low-latency applications and improve user experience. Data center providers are also focusing on developing specialized solutions for specific industry verticals, particularly in financial services, healthcare, and digital media sectors, leading to more customized and efficient service delivery models.
Australia Data Center Market Trends
The growth of smartphone penetration rate above 130% in the country is driving the data center market
- The total number of smartphone users in the country was 22.43 million in 2022, and it is expected to witness a CAGR of 1.55% during the forecast period and reach 24.98 million by 2029.
- With 79.60% of the Australian population using smartphones, it is clear that Australians rely significantly on them. Furthermore, 64% of the adult population in Australia utilizes smartphones before going to sleep, further highlighting the country's significant reliance on smartphones. Australia's average mobile phone data usage puts the country in second place in terms of mobile phone usage, following the United States. In 2019, 6.2 million Australians aged 14 and above (32%) owned a prepaid mobile phone, which they recharged every seven weeks on average, and 71% of the teenagers spent more than 5 hrs. on social media a day.
- Australia has a mobile penetration rate of 130%. On average, there are 104 apps installed on each smartphone device. In 2019, the total value of the Australian mobile commerce market was USD 12.1 billion. This market is expected to increase exponentially in size to over USD 20 billion by 2023. The Australian market's preference for smartphones necessitates the expansion of data centers' capabilities in order to handle the increase in data. Smartphones generate a lot of data, which necessitates real-time processing and analysis. The data centers must manage the sheer amount of data. Thus, the requirement for extra racks in Australian data centers may increase as the number of smartphone users rises.

Understand The Key Trends Shaping This Market
Download PDF
Increased adoption of streamed gaming and virtual reality may drive the demand for data centers in Australia
- The NBN is Australia's national broadband network, and it is replacing copper wires and cable broadband with optical fibers and other technologies to deliver more reliable, high-capacity internet.
- The bandwidth and data demand increase is expected to be driven by video streaming in higher resolution formats, such as 4K and 8K television. However, increased adoption of streamed gaming and virtual reality may add to this demand, while compression technology, which reduces data requirements, is expected to partially offset the growth in bandwidth demand.
- Fiber lines are expected to remain the dominant fixed broadband technology through 2025, supported by the rising demand for high-speed Internet services and the government's focus on aggressive fiber to the x (FTTx) network expansions nationwide under the National Broadband Network (NBN) project. Telstra was the dominant NBN retail service provider in 2021, with over 3.7 million subscriptions or approximately 45% of total subscribers.
- In terms of investment, in August 2022, Australian operator Telstra selected new rollout partners for transport network infrastructure machinery capable of laying dual fiber cables simultaneously. The operator is accelerating its efforts to build out high-capacity data transport networks across Australia, which is renowned for its distinctive environmental challenges.

OTHER KEY INDUSTRY TRENDS COVERED IN THE REPORT
- Increased use of YouTube and Facebook and increased purchasing from e-commerce platforms in the country may boost the demand for data centers
- Growth in fiber-to-the-home/building (FTTH/B) service in Australia drives the data centers market
- Telstra, Optus, and Vodafone are major network providers in the country; further expanding their services would drive the growth of data centers
Segment Analysis: By Data Center Size
Mega Segment in Australian Data Center Market
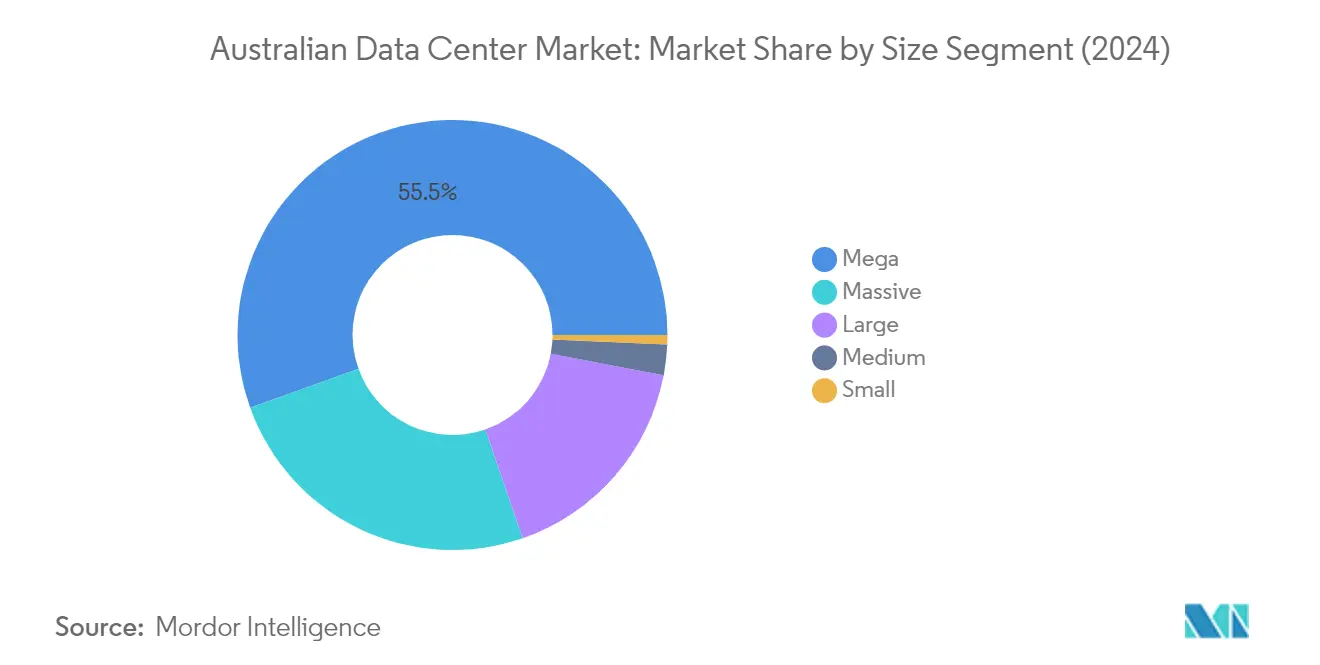
The mega data center segment dominates the Australian data center market, accounting for approximately 56% of the total IT load capacity in 2024, with a capacity of 1,480 MW. This significant market share is driven by the increasing demand for hyperscale facilities and the growing presence of major cloud service providers in the region. The segment's prominence is further reinforced by ongoing major construction projects, particularly in Sydney and Melbourne, where providers are expanding their facilities to meet the rising demand for large-scale data processing capabilities. NEXTDC's recent opening of its AUD 1.5 billion Melbourne facility, offering 150 MW of power capacity, exemplifies the scale of investments being made in mega data centers. Additionally, the segment is experiencing robust growth, projected to maintain a strong expansion trajectory through 2029, driven by factors such as increased cloud adoption, digital transformation initiatives, and the rising demand for high-capacity data processing facilities.
Small Segment in Australian Data Center Market
The small data center segment, while representing a smaller portion of the market, is demonstrating notable growth potential in the Australian data center landscape. The segment is projected to expand at approximately 6% CAGR from 2024 to 2029, making it one of the more dynamic segments in terms of growth rate. This growth is primarily driven by the increasing demand from edge computing applications and the need for localized data processing capabilities in regional areas. Small data centers are becoming increasingly important for supporting specific industry verticals and providing specialized services that require proximity to end-users. The segment's growth is also supported by technological advancements in modular and prefabricated solutions, making small data center deployments more efficient and cost-effective.
Remaining Segments in Data Center Size Market
The massive, large, and medium segments play crucial complementary roles in the Australian data center market. The massive segment serves as a bridge between mega and large facilities, catering to enterprises requiring substantial but not hyperscale capacity. Large data centers continue to serve established enterprises and organizations with significant but moderate data processing needs, while medium-sized facilities cater to regional markets and specific industry verticals. These segments collectively provide a diverse range of options for different user requirements, from traditional enterprise hosting to specialized industry applications. The varying size categories ensure that the market can accommodate different business models and operational requirements, contributing to the overall robustness of Australia's data center infrastructure.
Segment Analysis: By Tier Type
Tier 3 Segment in Australian Data Center Market
Tier 3 data center in Australia dominates the Australian data center market, accounting for approximately 80% of the total IT load capacity in 2024. The segment's prominence is driven by its optimal balance of reliability and cost-effectiveness, offering 99.98% uptime with N+1 redundancies. Sydney hosts the maximum number of Tier 3 data centers in the country with around 31% market share, followed by Melbourne with 21% and Perth with 12%. Major players like STACK Infrastructure, Canberra Data Centers, and DCI Data Centers are actively expanding their Tier 3 certified facilities across these regions. The segment's strong market position is further reinforced by its appeal to a wide range of businesses that require high availability without the premium costs associated with Tier 4 facilities.
Tier 4 Segment in Australian Data Center Market
The Tier 4 data center in Australia segment is experiencing rapid growth in the Australian data center market, with providers increasingly pursuing this highest level of certification for their new facilities. The segment is projected to grow at approximately 13% during 2024-2029, driven by increasing demand for maximum reliability and uptime guarantees. NEXTDC leads this transformation with 50% of Tier 4 certified data centers in the country, strategically spread across Sydney, Perth, Melbourne, and Brisbane. The growth is further accelerated by four ongoing data center projects with Tier 4 certifications in Sydney, Adelaide, and Melbourne, which upon completion will add a combined IT load capacity of 520 MW to the market. This expansion reflects the growing preference for facilities that offer the highest levels of redundancy and fault tolerance.
Remaining Segments in Tier Type Segmentation
The Tier 1 & 2 segment represents a minimal portion of the Australian data center market, with facilities primarily concentrated in Adelaide and Tasmania. These lower-tier data centers are experiencing stagnant growth due to the market's strong preference for higher reliability and uptime guarantees offered by Tier 3 and Tier 4 facilities. The limited presence of Tier 1 & 2 data centers reflects the market's maturity and the increasing sophistication of Australia's digital infrastructure requirements, where businesses prioritize advanced redundancy and reliability features for their mission-critical operations.
Segment Analysis: By Absorption
Utilized Segment in Australian Data Center Market
The utilized segment dominates the Australian data center market, accounting for approximately 84% of the total IT load capacity in 2024. This segment has emerged as the market leader due to increasing demand for public cloud services, with around 42% of businesses in Australia reporting the use of cloud computing. The utilization rate demonstrates the efficient use of data center resources, supported by the growing adoption of cloud services and digital transformation initiatives across various industries. The segment is experiencing robust growth and is projected to grow at nearly 9% during 2024-2029, driven by the continuous expansion of hyperscale facilities and increasing demand from sectors such as banking, government, and manufacturing. The growth is further supported by the country's data center floor space witnessing an annual expansion of around 8-10%, according to Jones Lang LaSalle IP Inc. Major data center operators are actively expanding their facilities and improving occupancy rates to meet the rising demand for colocation services.
Non-Utilized Segment in Australian Data Center Market
The non-utilized segment represents the available capacity in data centers that remains unused or reserved for future expansion. This segment plays a crucial role in the market by providing the necessary headroom for rapid scaling and maintaining operational flexibility. Data center operators strategically maintain certain levels of non-utilized capacity to accommodate sudden spikes in demand and ensure seamless service delivery. The segment also serves as a buffer for new customer onboarding and helps maintain optimal performance during peak usage periods. Market players are implementing various strategies to optimize their non-utilized capacity, including modular design approaches and phased expansion plans, which allow them to better align capacity with actual demand. This approach helps maintain a balance between meeting current requirements and having sufficient room for future growth while managing operational costs effectively.
Australia Data Center Industry Overview
Top Companies in Australia Data Center Market
The Australian data center market features a mix of global and regional players competing through various strategic initiatives. Data center companies in Australia are heavily investing in expanding their facilities and adopting innovative technologies to enhance operational efficiency and service delivery. There is a strong focus on developing hyperscale facilities with modular components, allowing for faster installation and flexible deployment of power and cooling infrastructure. Providers are increasingly emphasizing sustainability through renewable energy adoption and implementing advanced cooling solutions to reduce their environmental footprint. Strategic partnerships with cloud service providers and telecommunications companies are becoming more common to strengthen market positions. Operators are also investing in edge computing capabilities and enhancing their interconnection services to meet evolving customer demands. The market is witnessing significant investments in upgrading existing facilities and constructing new ones to accommodate the growing demand for colocation services.
Market Dominated by Strategic Regional Players
The Australian data center market exhibits a moderate level of consolidation with a balanced mix of global and regional operators. Australian data center companies maintain a strong presence due to their deep understanding of regional requirements and established relationships with government and enterprise customers. The market structure is characterized by the presence of specialized data center operators alongside diversified telecommunications companies and real estate investment trusts. Companies are actively pursuing strategic partnerships and joint ventures to strengthen their market position and expand their service offerings.
The market is experiencing ongoing consolidation through mergers and acquisitions, particularly as global players seek to establish or expand their presence in the Australian market. Regional operators are increasingly becoming attractive acquisition targets for international companies looking to gain quick market entry and established customer relationships. The competitive landscape is evolving with new entrants focusing on niche segments such as edge computing and specialized hosting services, while established players continue to expand their core colocation offerings through both organic growth and strategic acquisitions.
Innovation and Sustainability Drive Future Success
Success in the Australian data center market increasingly depends on operators' ability to differentiate through technological innovation and sustainable operations. Companies need to focus on developing energy-efficient facilities, implementing advanced cooling technologies, and adopting renewable energy sources to meet growing environmental concerns. Establishing strong relationships with cloud service providers and offering comprehensive interconnection services are becoming crucial for maintaining competitive advantage. Operators must also invest in security certifications and compliance measures to address growing regulatory requirements and customer security concerns.
For new entrants and smaller players, success lies in identifying and serving underserved market segments or geographic locations. Companies can gain market share by offering specialized services tailored to specific industry verticals or by focusing on edge computing solutions for regional markets. Building strong partnerships with technology providers and maintaining flexibility in service offerings will be crucial for long-term success. The ability to quickly adapt to changing customer requirements and technological advances while maintaining operational efficiency will determine market leaders in the coming years. Regulatory compliance, particularly regarding data sovereignty and security, will continue to play a crucial role in shaping competitive strategies.
Australia Data Center Market Leaders
-
Digital Realty Trust Inc.
-
Equinix Inc.
-
Fujitsu Group
-
Keppel DC REIT Management Pte. Ltd
-
Telstra Corporation Limited
- *Disclaimer: Major Players sorted in no particular order

Need More Details on Market Players and Competiters?
Download PDF
Australia Data Center Market News
- August 2022: Equinix announced that it had completed the USD 15.7 million expansion of its second Melbourne data center. First opened in February 2020, the ME2 site in Port Melbourne acquired 500 new cabinets, increasing the facility's total to 1,500 cabinets and colocation space covering 4,070 square meters (43,800 sq. ft). The data center is planned to eventually span over 8,200 square meters (88,150 sq. ft) and house 3,000 cabinets.
- August 2022: Leaseweb Global announced that it would be expanding its Asia-Pacific presence with the opening of three new data centers in Tokyo, Singapore, and Sydney before the end of the year. Once the new locations have been launched, the company will operate a total of nine data centers across the region.
- August 2022: Canberra Data Centres announced that it had signed a new 10-year deal with the Australian Defence Ministry in the previous month. The USD 91.5 million contract is double the value of the company’s previous most lucrative contract with the big spending department and was revealed through public tender documents.
Free With This Report
We provide a complimentary and exhaustive set of data points on the country and regional level metrics that present the fundamental structure of the industry. Presented in the form of 50+ free charts, the sections cover difficult to find data on various countries on smartphone users, data traffic per smartphone, mobile and broadband data speed, fiber connectivity network, and submarine cables.


Australia Data Center Market Report - Table of Contents
1. EXECUTIVE SUMMARY & KEY FINDINGS
2. REPORT OFFERS
3. INTRODUCTION
- 3.1 Study Assumptions & Market Definition
- 3.2 Scope of the Study
- 3.3 Research Methodology
4. MARKET OUTLOOK
- 4.1 It Load Capacity
- 4.2 Raised Floor Space
- 4.3 Colocation Revenue
- 4.4 Installed Racks
- 4.5 Rack Space Utilization
- 4.6 Submarine Cable
5. Key Industry Trends
- 5.1 Smartphone Users
- 5.2 Data Traffic Per Smartphone
- 5.3 Mobile Data Speed
- 5.4 Broadband Data Speed
- 5.5 Fiber Connectivity Network
-
5.6 Regulatory Framework
- 5.6.1 Australia
- 5.7 Value Chain & Distribution Channel Analysis
6. MARKET SEGMENTATION (INCLUDES MARKET SIZE IN VOLUME, FORECASTS UP TO 2030 AND ANALYSIS OF GROWTH PROSPECTS)
-
6.1 Hotspot
- 6.1.1 Melbourne
- 6.1.2 Perth
- 6.1.3 Sydney
- 6.1.4 Rest of Australia
-
6.2 Data Center Size
- 6.2.1 Large
- 6.2.2 Massive
- 6.2.3 Medium
- 6.2.4 Mega
- 6.2.5 Small
-
6.3 Tier Type
- 6.3.1 Tier 1 and 2
- 6.3.2 Tier 3
- 6.3.3 Tier 4
-
6.4 Absorption
- 6.4.1 Non-Utilized
- 6.4.2 Utilized
- 6.4.2.1 By Colocation Type
- 6.4.2.1.1 Hyperscale
- 6.4.2.1.2 Retail
- 6.4.2.1.3 Wholesale
- 6.4.2.2 By End User
- 6.4.2.2.1 BFSI
- 6.4.2.2.2 Cloud
- 6.4.2.2.3 E-Commerce
- 6.4.2.2.4 Government
- 6.4.2.2.5 Manufacturing
- 6.4.2.2.6 Media & Entertainment
- 6.4.2.2.7 Telecom
- 6.4.2.2.8 Other End User
7. COMPETITIVE LANDSCAPE
- 7.1 Market Share Analysis
- 7.2 Company Landscape
-
7.3 Company Profiles (includes Global Level Overview, Market Level Overview, Core Business Segments, Financials, Headcount, Key Information, Market Rank, Market Share, Products and Services, and Analysis of Recent Developments).
- 7.3.1 AirTrunk Operating Pty Ltd
- 7.3.2 Canberra Data Centers
- 7.3.3 Digital Realty Trust Inc.
- 7.3.4 Equinix Inc.
- 7.3.5 Fujitsu Group
- 7.3.6 Global Switch Holdings Limited
- 7.3.7 Intervolve Pty Ltd (Vintek Group)
- 7.3.8 Keppel DC REIT Management Pte. Ltd
- 7.3.9 Leaseweb Global BV
- 7.3.10 Macquarie Telecom Group
- 7.3.11 NEXTDC Ltd
- 7.3.12 Telstra Corporation Limited
- 7.4 LIST OF COMPANIES STUDIED
8. KEY STRATEGIC QUESTIONS FOR DATA CENTER CEOS
9. APPENDIX
-
9.1 Global Overview
- 9.1.1 Overview
- 9.1.2 Porter’s Five Forces Framework
- 9.1.3 Global Value Chain Analysis
- 9.1.4 Global Market Size and DROs
- 9.2 Sources & References
- 9.3 List of Tables & Figures
- 9.4 Primary Insights
- 9.5 Data Pack
- 9.6 Glossary of Terms
You Can Purchase Parts Of This Report. Check Out Prices For Specific Sections
Get Price Break-up Now
List of Tables & Figures
- Figure 1:
- VOLUME OF IT LOAD CAPACITY, MW, AUSTRALIA, 2018 - 2030
- Figure 2:
- VOLUME OF RAISED FLOOR AREA, SQ.FT. ('000), AUSTRALIA, 2018 - 2030
- Figure 3:
- VALUE OF COLOCATION REVENUE, USD MILLION, AUSTRALIA, 2018 - 2030
- Figure 4:
- VOLUME OF INSTALLED RACKS, NUMBER, AUSTRALIA, 2018 - 2030
- Figure 5:
- RACK SPACE UTILIZATION, %, AUSTRALIA, 2018 - 2030
- Figure 6:
- COUNT OF SMARTPHONE USERS, IN MILLION, AUSTRALIA, 2018 - 2030
- Figure 7:
- DATA TRAFFIC PER SMARTPHONE, GB, AUSTRALIA, 2018 - 2030
- Figure 8:
- AVERAGE MOBILE DATA SPEED, MBPS, AUSTRALIA, 2018 - 2030
- Figure 9:
- AVERAGE BROADBAND SPEED, MBPS, AUSTRALIA, 2018 - 2030
- Figure 10:
- LENGTH OF FIBER CONNECTIVITY NETWORK, KILOMETER, AUSTRALIA, 2018 - 2030
- Figure 11:
- VOLUME OF IT LOAD CAPACITY, MW, AUSTRALIA, 2018 - 2030
- Figure 12:
- VOLUME OF HOTSPOT, MW, AUSTRALIA, 2018 - 2030
- Figure 13:
- VOLUME SHARE OF HOTSPOT, %, AUSTRALIA, 2018 - 2030
- Figure 14:
- VOLUME SIZE OF MELBOURNE, MW, AUSTRALIA, 2018 - 2030
- Figure 15:
- VOLUME SHARE OF MELBOURNE, MW, HOTSPOT, %, AUSTRALIA, 2018 - 2030
- Figure 16:
- VOLUME SIZE OF PERTH, MW, AUSTRALIA, 2018 - 2030
- Figure 17:
- VOLUME SHARE OF PERTH, MW, HOTSPOT, %, AUSTRALIA, 2018 - 2030
- Figure 18:
- VOLUME SIZE OF SYDNEY, MW, AUSTRALIA, 2018 - 2030
- Figure 19:
- VOLUME SHARE OF SYDNEY, MW, HOTSPOT, %, AUSTRALIA, 2018 - 2030
- Figure 20:
- VOLUME SIZE OF REST OF AUSTRALIA, MW, AUSTRALIA, 2018 - 2030
- Figure 21:
- VOLUME SHARE OF REST OF AUSTRALIA, MW, HOTSPOT, %, AUSTRALIA, 2018 - 2030
- Figure 22:
- VOLUME OF DATA CENTER SIZE, MW, AUSTRALIA, 2018 - 2030
- Figure 23:
- VOLUME SHARE OF DATA CENTER SIZE, %, AUSTRALIA, 2018 - 2030
- Figure 24:
- VOLUME SIZE OF LARGE, MW, AUSTRALIA, 2018 - 2030
- Figure 25:
- VOLUME SIZE OF MASSIVE, MW, AUSTRALIA, 2018 - 2030
- Figure 26:
- VOLUME SIZE OF MEDIUM, MW, AUSTRALIA, 2018 - 2030
- Figure 27:
- VOLUME SIZE OF MEGA, MW, AUSTRALIA, 2018 - 2030
- Figure 28:
- VOLUME SIZE OF SMALL, MW, AUSTRALIA, 2018 - 2030
- Figure 29:
- VOLUME OF TIER TYPE, MW, AUSTRALIA, 2018 - 2030
- Figure 30:
- VOLUME SHARE OF TIER TYPE, %, AUSTRALIA, 2018 - 2030
- Figure 31:
- VOLUME SIZE OF TIER 1 AND 2, MW, AUSTRALIA, 2018 - 2030
- Figure 32:
- VOLUME SIZE OF TIER 3, MW, AUSTRALIA, 2018 - 2030
- Figure 33:
- VOLUME SIZE OF TIER 4, MW, AUSTRALIA, 2018 - 2030
- Figure 34:
- VOLUME OF ABSORPTION, MW, AUSTRALIA, 2018 - 2030
- Figure 35:
- VOLUME SHARE OF ABSORPTION, %, AUSTRALIA, 2018 - 2030
- Figure 36:
- VOLUME SIZE OF NON-UTILIZED, MW, AUSTRALIA, 2018 - 2030
- Figure 37:
- VOLUME OF COLOCATION TYPE, MW, AUSTRALIA, 2018 - 2030
- Figure 38:
- VOLUME SHARE OF COLOCATION TYPE, %, AUSTRALIA, 2018 - 2030
- Figure 39:
- VOLUME SIZE OF HYPERSCALE, MW, AUSTRALIA, 2018 - 2030
- Figure 40:
- VOLUME SIZE OF RETAIL, MW, AUSTRALIA, 2018 - 2030
- Figure 41:
- VOLUME SIZE OF WHOLESALE, MW, AUSTRALIA, 2018 - 2030
- Figure 42:
- VOLUME OF END USER, MW, AUSTRALIA, 2018 - 2030
- Figure 43:
- VOLUME SHARE OF END USER, %, AUSTRALIA, 2018 - 2030
- Figure 44:
- VOLUME SIZE OF BFSI, MW, AUSTRALIA, 2018 - 2030
- Figure 45:
- VOLUME SIZE OF CLOUD, MW, AUSTRALIA, 2018 - 2030
- Figure 46:
- VOLUME SIZE OF E-COMMERCE, MW, AUSTRALIA, 2018 - 2030
- Figure 47:
- VOLUME SIZE OF GOVERNMENT, MW, AUSTRALIA, 2018 - 2030
- Figure 48:
- VOLUME SIZE OF MANUFACTURING, MW, AUSTRALIA, 2018 - 2030
- Figure 49:
- VOLUME SIZE OF MEDIA & ENTERTAINMENT, MW, AUSTRALIA, 2018 - 2030
- Figure 50:
- VOLUME SIZE OF TELECOM, MW, AUSTRALIA, 2018 - 2030
- Figure 51:
- VOLUME SIZE OF OTHER END USER, MW, AUSTRALIA, 2018 - 2030
- Figure 52:
- VOLUME SHARE OF MAJOR PLAYERS, %, AUSTRALIA
Australia Data Center Industry Segmentation
Melbourne, Perth, Sydney are covered as segments by Hotspot. Large, Massive, Medium, Mega, Small are covered as segments by Data Center Size. Tier 1 and 2, Tier 3, Tier 4 are covered as segments by Tier Type. Non-Utilized, Utilized are covered as segments by Absorption.| Hotspot | Melbourne | |||
| Perth | ||||
| Sydney | ||||
| Rest of Australia | ||||
| Data Center Size | Large | |||
| Massive | ||||
| Medium | ||||
| Mega | ||||
| Small | ||||
| Tier Type | Tier 1 and 2 | |||
| Tier 3 | ||||
| Tier 4 | ||||
| Absorption | Non-Utilized | |||
| Utilized | By Colocation Type | Hyperscale | ||
| Retail | ||||
| Wholesale | ||||
| By End User | BFSI | |||
| Cloud | ||||
| E-Commerce | ||||
| Government | ||||
| Manufacturing | ||||
| Media & Entertainment | ||||
| Telecom | ||||
| Other End User | ||||
Need A Different Region or Segment?
Customize Now
Market Definition
- IT LOAD CAPACITY - The IT load capacity or installed capacity, refers to the amount of energy consumed by servers and network equipments placed in a rack installed. It is measured in megawatt (MW).
- ABSORPTION RATE - It denotes the extend to which the data center capacity has been leased out. For instance, a 100 MW DC has leased out 75 MW, then absorption rate would be 75%. It is also referred as utilization rate and leased-out capacity.
- RAISED FLOOR SPACE - It is an elevated space build over the floor. This gap between the original floor and the elevated floor is used to accommodate wiring, cooling, and other data center equipment. This arrangement assist in having proper wiring and cooling infrastructure. It is measured in square feet (ft^2).
- DATA CENTER SIZE - Data Center Size is segmented based on the raised floor space allocated to the data center facilities. Mega DC - # of Racks must be more than 9000 or RFS (raised floor space) must be more than 225001 Sq. ft; Massive DC - # of Racks must be in between 9000 and 3001 or RFS must be in between 225000 Sq. ft and 75001 Sq. ft; Large DC - # of Racks must be in between 3000 and 801 or RFS must be in between 75000 Sq. ft and 20001 Sq. ft; Medium DC # of Racks must be in between 800 and 201 or RFS must be in between 20000 Sq. ft and 5001 Sq. ft; Small DC - # of Racks must be less than 200 or RFS must be less than 5000 Sq. ft.
- TIER TYPE - According to Uptime Institute the data centers are classified into four tiers based on the proficiencies of redundant equipment of the data center infrastructure. In this segment the data center are segmented as Tier 1,Tier 2, Tier 3 and Tier 4.
- COLOCATION TYPE - The segment is segregated into 3 categories namely Retail, Wholesale and Hyperscale Colocation service. The categorization is done based on the amount of IT load leased out to potential customers. Retail colocation service has leased capacity less than 250 kW; Wholesale colocation services has leased capacity between 251 kW and 4 MW and Hyperscale colocation services has leased capacity more than 4 MW.
- END CONSUMERS - The Data Center Market operates on a B2B basis. BFSI, Government, Cloud Operators, Media and Entertainment, E-Commerce, Telecom and Manufacturing are the major end-consumers in the market studied. The scope only includes colocation service operators catering to the increasing digitalization of the end-user industries.
| Keyword | Definition |
|---|---|
| Rack Unit | Generally referred as U or RU, it is the unit of measurement for the server unit housed in the racks in the data center. 1U is equal to 1.75 inches. |
| Rack Density | It defines the amount of power consumed by the equipment and server housed in a rack. It is measured in kilowatt (kW). This factor plays a critical role in data center design and, cooling and power planning. |
| IT Load Capacity | The IT load capacity or installed capacity, refers to the amount of energy consumed by servers and network equipment placed in a rack installed. It is measured in megawatt (MW). |
| Absorption Rate | It denotes how much of the data center capacity has been leased out. For instance, if a 100 MW DC has leased out 75 MW, then the absorption rate would be 75%. It is also referred to as utilization rate and leased-out capacity. |
| Raised Floor Space | It is an elevated space built over the floor. This gap between the original floor and the elevated floor is used to accommodate wiring, cooling, and other data center equipment. This arrangement assists in having proper wiring and cooling infrastructure. It is measured in square feet/meter. |
| Computer Room Air Conditioner (CRAC) | It is a device used to monitor and maintain the temperature, air circulation, and humidity inside the server room in the data center. |
| Aisle | It is the open space between the rows of racks. This open space is critical for maintaining the optimal temperature (20-25 °C) in the server room. There are primarily two aisles inside the server room, a hot aisle and a cold aisle. |
| Cold Aisle | It is the aisle wherein the front of the rack faces the aisle. Here, chilled air is directed into the aisle so that it can enter the front of the racks and maintain the temperature. |
| Hot Aisle | It is the aisle where the back of the racks faces the aisle. Here, the heat dissipated from the equipment’s in the rack is directed to the outlet vent of the CRAC. |
| Critical Load | It includes the servers and other computer equipment whose uptime is critical for data center operation. |
| Power Usage Effectiveness (PUE) | It is a metric which defines the efficiency of a data center. It is calculated by: (𝑇𝑜𝑡𝑎𝑙 𝐷𝑎𝑡𝑎 𝐶𝑒𝑛𝑡𝑒𝑟 𝐸𝑛𝑒𝑟𝑔𝑦 𝐶𝑜𝑛𝑠𝑢𝑚𝑝𝑡𝑖𝑜𝑛)/(𝑇𝑜𝑡𝑎𝑙 𝐼𝑇 𝐸𝑞𝑢𝑖𝑝𝑚𝑒𝑛𝑡 𝐸𝑛𝑒𝑟𝑔𝑦 𝐶𝑜𝑛𝑠𝑢𝑚𝑝𝑡𝑖𝑜𝑛). Further, a data center with a PUE of 1.2-1.5 is considered highly efficient, whereas, a data center with a PUE >2 is considered highly inefficient. |
| Redundancy | It is defined as a system design wherein additional component (UPS, generators, CRAC) is added so that in case of power outage, equipment failure, the IT equipment should not be affected. |
| Uninterruptible Power Supply (UPS) | It is a device that is connected in series with the utility power supply, storing energy in batteries such that the supply from UPS is continuous to IT equipment even during utility power is snapped. The UPS primarily supports the IT equipment only. |
| Generators | Just like UPS, generators are placed in the data center to ensure an uninterrupted power supply, avoiding downtime. Data center facilities have diesel generators and commonly, 48-hour diesel is stored in the facility to prevent disruption. |
| N | It denotes the tools and equipment required for a data center to function at full load. Only "N" indicates that there is no backup to the equipment in the event of any failure. |
| N+1 | Referred to as 'Need plus one', it denotes the additional equipment setup available to avoid downtime in case of failure. A data center is considered N+1 when there is one additional unit for every 4 components. For instance, if a data center has 4 UPS systems, then for to achieve N+1, an additional UPS system would be required. |
| 2N | It refers to fully redundant design wherein two independent power distribution system is deployed. Therefore, in the event of a complete failure of one distribution system, the other system will still supply power to the data center. |
| In-Row Cooling | It is the cooling design system installed between racks in a row where it draws warm air from the hot aisle and supplies cool air to the cold aisle, thereby maintaining the temperature. |
| Tier 1 | Tier classification determines the preparedness of a data center facility to sustain data center operation. A data center is classified as Tier 1 data center when it has a non-redundant (N) power component (UPS, generators), cooling components, and power distribution system (from utility power grids). The Tier 1 data center has an uptime of 99.67% and an annual downtime of <28.8 hours. |
| Tier 2 | A data center is classified as Tier 2 data center when it has a redundant power and cooling components (N+1) and a single non-redundant distribution system. Redundant components include extra generators, UPS, chillers, heat rejection equipment, and fuel tanks. The Tier 2 data center has an uptime of 99.74% and an annual downtime of <22 hours. |
| Tier 3 | A data center having redundant power and cooling components and multiple power distribution systems is referred to as a Tier 3 data center. The facility is resistant to planned (facility maintenance) and unplanned (power outage, cooling failure) disruption. The Tier 3 data center has an uptime of 99.98% and an annual downtime of <1.6 hours. |
| Tier 4 | It is the most tolerant type of data center. A Tier 4 data center has multiple, independent redundant power and cooling components and multiple power distribution paths. All IT equipment are dual powered, making them fault tolerant in case of any disruption, thereby ensuring interrupted operation. The Tier 4 data center has an uptime of 99.74% and an annual downtime of <26.3 minutes. |
| Small Data Center | Data center that has floor space area of ≤ 5,000 Sq. ft or the number of racks that can be installed is ≤ 200 is classified as a small data center. |
| Medium Data Center | Data center which has floor space area between 5,001-20,000 Sq. ft, or the number of racks that can be installed is between 201-800, is classified as a medium data center. |
| Large Data Center | Data center which has floor space area between 20,001-75,000 Sq. ft, or the number of racks that can be installed is between 801-3,000, is classified as a large data center. |
| Massive Data Center | Data center which has floor space area between 75,001-225,000 Sq. ft, or the number of racks that can be installed is between 3001-9,000, is classified as a massive data center. |
| Mega Data Center | Data center that has a floor space area of ≥ 225,001 Sq. ft or the number of racks that can be installed is ≥ 9001 is classified as a mega data center. |
| Retail Colocation | It refers to those customers who have a capacity requirement of 250 kW or less. These services are majorly opted by small and medium enterprises (SMEs). |
| Wholesale Colocation | It refers to those customers who have a capacity requirement between 250 kW to 4 MW. These services are majorly opted by medium to large enterprises. |
| Hyperscale Colocation | It refers to those customers who have a capacity requirement greater than 4 MW. The hyperscale demand primarily originates from large-scale cloud players, IT companies, BFSI, and OTT players (like Netflix, Hulu, and HBO+). |
| Mobile Data Speed | It is the mobile internet speed a user experiences via their smartphones. This speed is primarily dependent on the carrier technology being used in the smartphone. The carrier technologies available in the market are 2G, 3G, 4G, and 5G, where 2G provides the slowest speed while 5G is the fastest. |
| Fiber Connectivity Network | It is a network of optical fiber cables deployed across the country, connecting rural and urban regions with high-speed internet connection. It is measured in kilometer (km). |
| Data Traffic per Smartphone | It is a measure of average data consumption by a smartphone user in a month. It is measured in gigabyte (GB). |
| Broadband Data Speed | It is the internet speed that is supplied over the fixed cable connection. Commonly, copper cable and optic fiber cable are used in both residential and commercial use. Here, optic cable fiber provides faster internet speed than copper cable. |
| Submarine Cable | A submarine cable is a fiber optic cable laid down at two or more landing points. Through this cable, communication and internet connectivity between countries across the globe is established. These cables can transmit 100-200 terabits per second (Tbps) from one point to another. |
| Carbon Footprint | It is the measure of carbon dioxide generated during the regular operation of a data center. Since, coal, and oil & gas are the primary source of power generation, consumption of this power contributes to carbon emissions. Data center operators are incorporating renewable energy sources to curb the carbon footprint emerging in their facilities. |
Need More Details on Market Definition?
Ask a Question
Research Methodology
Mordor Intelligence follows a four-step methodology in all our reports.
- Step-1: Identify Key Variables: In order to build a robust forecasting methodology, the variables and factors identified in Step-1 are tested against available historical market numbers. Through an iterative process, the variables required for market forecast are set and the model is built on the basis of these variables.
- Step-2: Build a Market Model: Market-size estimations for the forecast years are in nominal terms. Inflation is not a part of the pricing, and the average selling price (ASP) is kept constant throughout the forecast period for each country.
- Step-3: Validate and Finalize: In this important step, all market numbers, variables and analyst calls are validated through an extensive network of primary research experts from the market studied. The respondents are selected across levels and functions to generate a holistic picture of the market studied.
- Step-4: Research Outputs: Syndicated Reports, Custom Consulting Assignments, Databases & Subscription Platforms

Get More Details On Research Methodology
Download PDF


