
| Study Period | 2017 - 2030 |
| Base Year For Estimation | 2024 |
| Forecast Data Period | 2025 - 2030 |
| Market Size (2025) | USD 0.67 Billion |
| Market Size (2030) | USD 1.02 Billion |
| CAGR (2025 - 2030) | 8.75 % |
| Market Concentration | Low |
Major Players*Disclaimer: Major Players sorted in no particular order |


Australia Dairy Alternatives Market Analysis
The Australia Dairy Alternatives Market size is estimated at 0.67 billion USD in 2025, and is expected to reach 1.02 billion USD by 2030, growing at a CAGR of 8.75% during the forecast period (2025-2030).
The Australian dairy alternatives market is experiencing significant transformation driven by evolving consumer preferences and health consciousness. As of 2022, approximately 4% of Australians were identified as lactose intolerant, with the condition being more prevalent among women. This health-related concern, combined with growing awareness of plant-based diets, has led to a substantial shift in consumption patterns. The market has responded with an expanding range of dairy substitutes across various product categories, including milk alternatives, butter, cheese, and yogurt alternatives, catering to diverse consumer needs and preferences.
The retail landscape for dairy alternatives continues to evolve, with supermarkets and hypermarkets maintaining their dominance in the distribution network. These traditional retail channels accounted for 75.50% of off-trade sales value in 2022, leveraging their ability to offer wide product assortments and competitive pricing. The sector has witnessed significant modernization in terms of product placement and marketing strategies, with dedicated shelf spaces for vegan dairy becoming increasingly common in major retail chains across Australia.
Consumer demographics and preferences are reshaping the market dynamics, with millennials emerging as key drivers of growth. In 2022, a remarkable 63.5% of millennials expressed interest in consuming vegan food and beverages at restaurants, indicating a strong shift towards plant milk and other plant-based alternatives. This trend is further supported by the growing vegan population in Australia, which reached approximately 2.5 million individuals in 2022, creating a robust consumer base for dairy alternatives.
The market is witnessing significant developments in distribution channels, particularly in the digital space. The e-commerce sector has shown remarkable growth, with online grocery shopping adoption increasing from 14% in 2019 to 18% in 2021. This shift in consumer shopping behavior has prompted both established retailers and specialized vegan food stores to enhance their online presence. The convenience and accessibility offered by online platforms, combined with the availability of detailed product information and user reviews, have made e-commerce an increasingly important channel for milk alternatives products.
Australia Dairy Alternatives Market Trends
Favorable government support to promote vegan culture
- The consumption of different types of plant-based dairy products across the Asia-Pacific region has been on the rise for the past few years due to the growing vegan population. There are even vegan exhibitions/trade shows and music festivals being conducted in several countries. Australia has the third-highest percentage of vegans per capita globally. As of 2022, there were 2.5 million vegans and vegetarians in the country.
- There are several vegan celebrities in Australia, particularly celebrity chefs, who have played a significant role in bringing plant-based lifestyles into mainstream dining and food culture. This trend has increased the inclusion of soy milk, especially in daily diets, as it replaces conventional milk, thus strengthening consumption patterns across the country.
- Consumers, especially those who are allergic to milk, prefer plant-based milk products. Cow milk allergy is one of the most common food allergies among children. As of 2022, in Australia, around one in 50 babies and children showed signs of an allergy to cow milk. Around 45% of consumers are actively trying to reduce the number of animal products they consume. Thus, the per capita consumption of plant-based milk in Australia increased by 7.6% during 2022-2023. .
- The per capita consumption of non-dairy butter is expected to increase by 1.30% during 2023-2024. The key motivations for consumers to use non-dairy butter are a concern for animals or sustainability, followed by a change in dietary habits. However, other dairy alternative product categories like yogurt, cheese, and ice cream are still at a nascent stage.

Understand The Key Trends Shaping This Market
Download PDF
OTHER KEY INDUSTRY TRENDS COVERED IN THE REPORT
- Australia's high-quality arable land in rain-fed areas is well-suited for producing crops, base ingredients in dairy alternatives
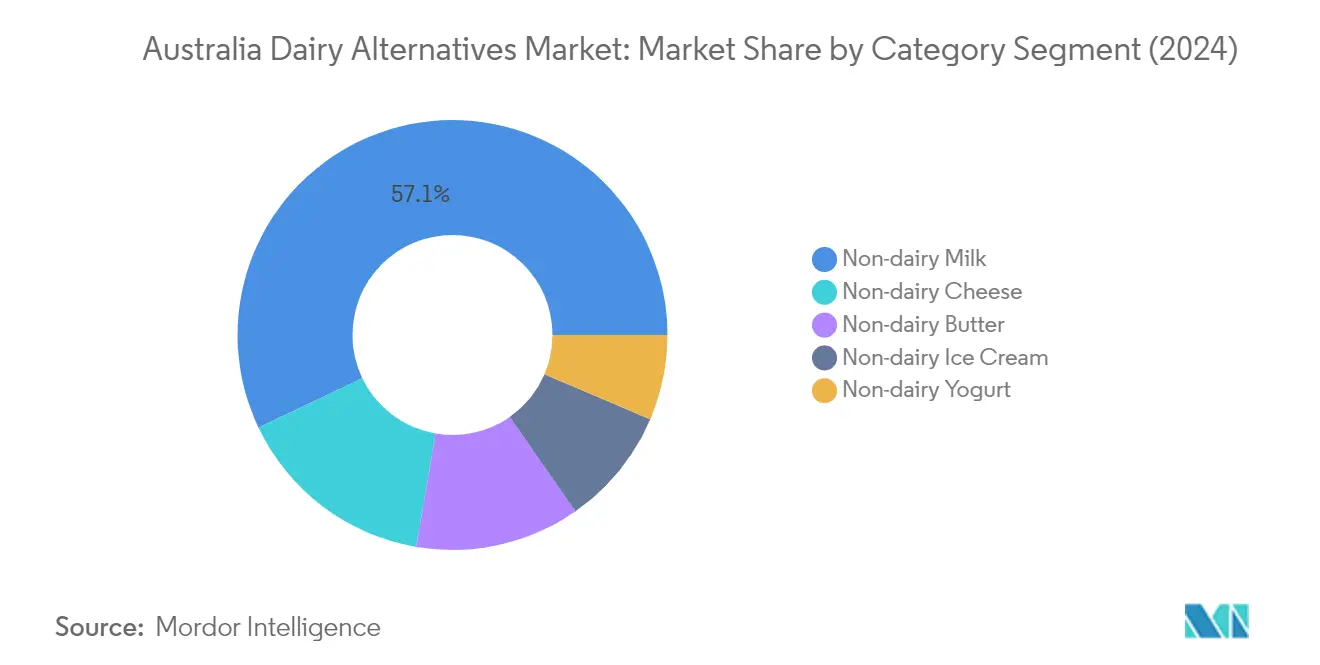
Segment Analysis: Category
Non-Dairy Milk Segment in Australia Dairy Alternatives Market
Non-dairy milk continues to dominate the Australian dairy alternatives market, commanding approximately 57% market share in 2024. This segment's strong position is driven by increasing consumer awareness of the health benefits associated with milk alternatives such as almond milk, soy milk, and oat milk, which also offer a longer shelf life compared to traditional dairy milk. The segment's growth is further supported by the fact that around 40% of Australian households now regularly purchase plant-based milk alternatives. Within this segment, soy milk plays a pivotal role, while oat milk has emerged as a rapidly growing subcategory, particularly in coffee shops and cafes. The availability of various options including almond, soy, oat, coconut milk, and other plant-based alternatives, along with different flavors and fortified variants, has helped maintain this segment's market leadership.
Non-Dairy Cheese Segment in Australia Dairy Alternatives Market
The vegan cheese segment is experiencing remarkable growth in the Australian market, projected to expand at approximately 31% CAGR from 2024 to 2029. This exceptional growth is primarily driven by the rising adoption of veganism and increasing awareness of animal welfare issues among Australian consumers. Manufacturers are actively innovating and introducing a wide variety of vegan cheese formats, including cheddar blocks, slices, shreds, creamy feta, parmesan, cream cheese, and halloumi, to meet diverse consumer preferences. The segment's growth is further supported by the increasing availability of these products through various retail channels and their growing acceptance in foodservice applications.
Remaining Segments in Category
The Australian dairy alternatives market is further diversified with segments including non-dairy butter, non-dairy ice cream, and non-dairy yogurt. Non-dairy butter has gained significant traction due to its widespread use in baking and cooking applications, while non-dairy ice cream has emerged as a popular choice among health-conscious consumers seeking low-sugar and less processed alternatives. The non-dairy yogurt segment has also shown promising growth, driven by increasing demand for probiotic-rich plant-based alternatives. These segments collectively contribute to the market's diversity and cater to different consumer preferences and dietary requirements, from lactose intolerance to lifestyle choices.
Segment Analysis: Distribution Channel
Off-Trade Segment in Australia Dairy Alternatives Market
The off-trade segment dominates the Australia dairy alternatives market, commanding approximately 92% of the total market share in 2024. This substantial market presence is primarily driven by supermarkets and hypermarkets, which serve as the primary retail channels for dairy alternatives. The segment's dominance can be attributed to the extensive product variety, competitive pricing, and convenient accessibility offered through various retail formats. Supermarkets and hypermarkets maintain a particularly strong position, accounting for nearly 76% of off-trade sales, offering consumers a wide selection of dairy alternative products under one roof. The segment's growth is further supported by the increasing penetration of online retail channels and specialty stores, which provide consumers with diverse options and the convenience of home delivery.
On-Trade Segment in Australia Dairy Alternatives Market
The on-trade segment is experiencing significant transformation in the Australian dairy alternatives market, with a projected growth rate of approximately 6% during 2024-2029. This growth is primarily driven by the increasing adoption of plant-based options in cafes, restaurants, and other foodservice establishments. The segment's expansion is particularly notable in the coffee shop sector, where oat milk has emerged as a popular choice for barista-made beverages. Major cafe chains like Starbucks Australia have embraced plant-based alternatives, offering various options including MilkLab oat milk, almond milk, and soy milk for their vegan beverages. The growth is further supported by the rising number of fast-food chains specializing in vegan dishes and the increasing consumer demand for plant-based options in foodservice establishments.
Australia Dairy Alternatives Industry Overview
Top Companies in Australia Dairy Alternatives Market
The Australian dairy alternatives market is characterized by continuous product innovation and strategic expansion initiatives from key players. Companies are focusing on developing new plant milk formulations, particularly in milk alternatives like oat, almond, and soy varieties, while also expanding into emerging categories like non-dairy cheese and butter. Operational agility is demonstrated through investments in manufacturing capabilities and distribution networks, with companies establishing partnerships with local farmers for ingredient sourcing. Strategic moves include expanding product portfolios through both organic growth and acquisitions, particularly in specialized plant-based segments. Market leaders are strengthening their positions through enhanced distribution channels, including supermarket partnerships and e-commerce platforms, while also investing in marketing campaigns to increase brand awareness and consumer education about dairy substitutes.
Mix of Global and Local Players
The Australian dairy alternatives market features a balanced mix of global conglomerates and local specialists, creating a dynamic competitive environment. Global players like Nestlé, Danone, and Vitasoy leverage their extensive research capabilities and international experience to introduce innovative products, while local companies such as Sanitarium Health and Wellbeing and PureHarvest maintain strong market positions through their deep understanding of regional consumer preferences and established distribution networks. The market structure is moderately consolidated, with the top players holding significant market share while leaving room for smaller, specialized manufacturers to carve out niches in specific product categories.
The market is experiencing ongoing consolidation through strategic acquisitions and partnerships, particularly as global players seek to strengthen their presence in the Australian market. Companies are forming strategic alliances with local manufacturers and distributors to enhance their market reach and operational efficiency. The trend toward consolidation is driven by the need to achieve economies of scale, access new distribution channels, and acquire specialized expertise in plant-based product development. However, the market still maintains a competitive dynamic with new entrants, particularly in specialized segments like artisanal plant-based cheese and premium non-dairy beverages.
Innovation and Distribution Drive Future Success
Success in the Australian vegan dairy alternatives market increasingly depends on companies' ability to innovate while maintaining efficient distribution networks. Incumbent players need to focus on continuous product development, particularly in improving taste profiles and nutritional content of plant-based alternatives, while also investing in sustainable packaging solutions and clean-label formulations. Building strong relationships with retailers and expanding presence across multiple distribution channels, including e-commerce platforms, is crucial for maintaining market share. Companies must also invest in consumer education and marketing to build brand loyalty and differentiate their products in an increasingly crowded market.
For contenders looking to gain ground, focusing on specialized product segments and unique value propositions offers the most promising path forward. This includes developing products for specific dietary requirements or targeting premium market segments with innovative ingredients and formulations. Success also depends on building efficient supply chains and establishing partnerships with key distributors while maintaining flexibility to respond to changing consumer preferences. The regulatory environment, particularly regarding labeling requirements and health claims, continues to evolve, and companies must stay proactive in compliance while advocating for industry-friendly policies. The risk of substitution from new alternative products remains moderate, making continuous innovation and market adaptation essential for long-term success.
Australia Dairy Alternatives Market Leaders
-
Danone SA
-
Nestlé SA
-
PureHarvest
-
Sanitarium Health and Wellbeing Company
-
Vitasoy International Holdings Ltd
- *Disclaimer: Major Players sorted in no particular order

Need More Details on Market Players and Competiters?
Download PDF
Australia Dairy Alternatives Market News
- October 2022: Vitasoy International Holdings Ltd planned to expand its dairy alternative business by acquiring the shares from its joint venture Bega Cheese subsidiary National Food Holdings Ltd.
- August 2022: The addition of the new Oat Barista Blend to Califia Farms' already well-liked Original and Unsweetened Almondmilk Barista Blends demonstrated the company's commitment to quality coffee while bolstering its relationships with both old and new coffee shops.
- August 2022: Sanitarium launched a new master brand campaign for its plant-based milk 'So Good' brand.
Free With This Report
We provide a comprehensive and exhaustive set of data pointers for global, regional, and country-level metrics that illustrate the fundamentals of the dairy alternatives industry. With the help of 45+ free charts, clients can access in-depth market analysis based on per capita consumption numbers and production data of raw materials for dairy alternatives, through granular level segmental information supported by a repository of market data, trends, and expert analysis. Data and analysis on dairy alternative products, categories of dairy alternative products, product types, etc., are available in the form of comprehensive reports as well as excel based data worksheets.


Australia Dairy Alternatives Market Report - Table of Contents
1. EXECUTIVE SUMMARY & KEY FINDINGS
2. REPORT OFFERS
3. INTRODUCTION
- 3.1 Study Assumptions & Market Definition
- 3.2 Scope of the Study
- 3.3 Research Methodology
4. KEY INDUSTRY TRENDS
- 4.1 Per Capita Consumption
-
4.2 Raw Material/commodity Production
- 4.2.1 Dairy Alternative - Raw Material Production
-
4.3 Regulatory Framework
- 4.3.1 Australia
- 4.4 Value Chain & Distribution Channel Analysis
5. MARKET SEGMENTATION (includes market size in Value in USD and Volume, Forecasts up to 2030 and analysis of growth prospects)
-
5.1 Category
- 5.1.1 Non-Dairy Butter
- 5.1.2 Non-Dairy Cheese
- 5.1.3 Non-Dairy Ice Cream
- 5.1.4 Non-Dairy Milk
- 5.1.4.1 By Product Type
- 5.1.4.1.1 Almond Milk
- 5.1.4.1.2 Cashew Milk
- 5.1.4.1.3 Coconut Milk
- 5.1.4.1.4 Hazelnut Milk
- 5.1.4.1.5 Oat Milk
- 5.1.4.1.6 Soy Milk
- 5.1.5 Non-Dairy Yogurt
-
5.2 Distribution Channel
- 5.2.1 Off-Trade
- 5.2.1.1 Convenience Stores
- 5.2.1.2 Online Retail
- 5.2.1.3 Specialist Retailers
- 5.2.1.4 Supermarkets and Hypermarkets
- 5.2.1.5 Others (Warehouse clubs, gas stations, etc.)
- 5.2.2 On-Trade
6. COMPETITIVE LANDSCAPE
- 6.1 Key Strategic Moves
- 6.2 Market Share Analysis
- 6.3 Company Landscape
-
6.4 Company Profiles (includes Global Level Overview, Market Level Overview, Core Business Segments, Financials, Headcount, Key Information, Market Rank, Market Share, Products and Services, and Analysis of Recent Developments).
- 6.4.1 Blue Diamond Growers
- 6.4.2 Califia Farms LLC
- 6.4.3 Dairy-Free Down Under
- 6.4.4 Danone SA
- 6.4.5 Namyang Dairy Products Co. Ltd
- 6.4.6 Nestlé SA
- 6.4.7 PureHarvest
- 6.4.8 Sanitarium Health and Wellbeing Company
- 6.4.9 Spiral Foods
- 6.4.10 The Vegan Dairy Pty Ltd
- 6.4.11 Vitasoy International Holdings Ltd
7. KEY STRATEGIC QUESTIONS FOR DAIRY AND DAIRY ALTERNATIVE CEOS
8. APPENDIX
-
8.1 Global Overview
- 8.1.1 Overview
- 8.1.2 Porter’s Five Forces Framework
- 8.1.3 Global Value Chain Analysis
- 8.1.4 Market Dynamics (DROs)
- 8.2 Sources & References
- 8.3 List of Tables & Figures
- 8.4 Primary Insights
- 8.5 Data Pack
- 8.6 Glossary of Terms
You Can Purchase Parts Of This Report. Check Out Prices For Specific Sections
Get Price Break-up Now
List of Tables & Figures
- Figure 1:
- PER CAPITA CONSUMPTION OF DAIRY ALTERNATIVES, KG, AUSTRALIA, 2017 - 2029
- Figure 2:
- PRODUCTION VOLUME OF AUSTRALIA DAIRY ALTERNATIVES MARKET - RAW MATERIAL, METRIC TONNES, AUSTRALIA, 2017 - 2021
- Figure 3:
- VOLUME OF DAIRY ALTERNATIVES, METRIC TONNES, BY AUSTRALIA, 2017 - 2029
- Figure 4:
- VALUE OF DAIRY ALTERNATIVES, USD MN, BY AUSTRALIA, 2017 - 2029
- Figure 5:
- VOLUME OF DAIRY ALTERNATIVES MARKET BY CATEGORY, METRIC TONNES, AUSTRALIA, 2017 - 2029
- Figure 6:
- VALUE OF DAIRY ALTERNATIVES MARKET BY CATEGORY, USD MN, AUSTRALIA, 2017 - 2029
- Figure 7:
- VOLUME SHARE OF DAIRY ALTERNATIVES MARKET, BY CATEGORY , %, AUSTRALIA, 2017 VS 2023 VS 2029
- Figure 8:
- VALUE SHARE OF DAIRY ALTERNATIVES MARKET, BY CATEGORY , %, AUSTRALIA, 2017 VS 2023 VS 2029
- Figure 9:
- VOLUME OF NON-DAIRY BUTTER MARKET, METRIC TONNES, AUSTRALIA, 2017 - 2029
- Figure 10:
- VALUE OF NON-DAIRY BUTTER MARKET, USD MN, AUSTRALIA, 2017 - 2029
- Figure 11:
- VALUE SHARE OF NON-DAIRY BUTTER MARKET, BY DISTRIBUTION CHANNEL, %, AUSTRALIA, 2022 VS 2029
- Figure 12:
- VOLUME OF NON-DAIRY CHEESE MARKET, METRIC TONNES, AUSTRALIA, 2017 - 2029
- Figure 13:
- VALUE OF NON-DAIRY CHEESE MARKET, USD MN, AUSTRALIA, 2017 - 2029
- Figure 14:
- VALUE SHARE OF NON-DAIRY CHEESE MARKET, BY DISTRIBUTION CHANNEL, %, AUSTRALIA, 2022 VS 2029
- Figure 15:
- VOLUME OF NON-DAIRY ICE CREAM MARKET, METRIC TONNES, AUSTRALIA, 2017 - 2029
- Figure 16:
- VALUE OF NON-DAIRY ICE CREAM MARKET, USD MN, AUSTRALIA, 2017 - 2029
- Figure 17:
- VALUE SHARE OF NON-DAIRY ICE CREAM MARKET, BY DISTRIBUTION CHANNEL, %, AUSTRALIA, 2022 VS 2029
- Figure 18:
- VOLUME OF NON-DAIRY MILK MARKET BY PRODUCT TYPE, METRIC TONNES, AUSTRALIA, 2017 - 2029
- Figure 19:
- VALUE OF NON-DAIRY MILK MARKET BY PRODUCT TYPE, USD MN, AUSTRALIA, 2017 - 2029
- Figure 20:
- VOLUME SHARE OF NON-DAIRY MILK MARKET BY PRODUCT TYPE, %, AUSTRALIA, 2017 VS 2023 VS 2029
- Figure 21:
- VALUE SHARE OF NON-DAIRY MILK MARKET BY PRODUCT TYPE, %, AUSTRALIA, 2017 VS 2023 VS 2029
- Figure 22:
- VOLUME OF ALMOND MILK MARKET, METRIC TONNES, AUSTRALIA, 2017 - 2029
- Figure 23:
- VALUE OF ALMOND MILK MARKET, USD MN, AUSTRALIA, 2017 - 2029
- Figure 24:
- VALUE SHARE OF ALMOND MILK MARKET, BY DISTRIBUTION CHANNEL, %, AUSTRALIA, 2022 VS 2029
- Figure 25:
- VOLUME OF CASHEW MILK MARKET, METRIC TONNES, AUSTRALIA, 2017 - 2029
- Figure 26:
- VALUE OF CASHEW MILK MARKET, USD MN, AUSTRALIA, 2017 - 2029
- Figure 27:
- VALUE SHARE OF CASHEW MILK MARKET, BY DISTRIBUTION CHANNEL, %, AUSTRALIA, 2022 VS 2029
- Figure 28:
- VOLUME OF COCONUT MILK MARKET, METRIC TONNES, AUSTRALIA, 2017 - 2029
- Figure 29:
- VALUE OF COCONUT MILK MARKET, USD MN, AUSTRALIA, 2017 - 2029
- Figure 30:
- VALUE SHARE OF COCONUT MILK MARKET, BY DISTRIBUTION CHANNEL, %, AUSTRALIA, 2022 VS 2029
- Figure 31:
- VOLUME OF HAZELNUT MILK MARKET, METRIC TONNES, AUSTRALIA, 2017 - 2029
- Figure 32:
- VALUE OF HAZELNUT MILK MARKET, USD MN, AUSTRALIA, 2017 - 2029
- Figure 33:
- VALUE SHARE OF HAZELNUT MILK MARKET, BY DISTRIBUTION CHANNEL, %, AUSTRALIA, 2022 VS 2029
- Figure 34:
- VOLUME OF OAT MILK MARKET, METRIC TONNES, AUSTRALIA, 2017 - 2029
- Figure 35:
- VALUE OF OAT MILK MARKET, USD MN, AUSTRALIA, 2017 - 2029
- Figure 36:
- VALUE SHARE OF OAT MILK MARKET, BY DISTRIBUTION CHANNEL, %, AUSTRALIA, 2022 VS 2029
- Figure 37:
- VOLUME OF SOY MILK MARKET, METRIC TONNES, AUSTRALIA, 2017 - 2029
- Figure 38:
- VALUE OF SOY MILK MARKET, USD MN, AUSTRALIA, 2017 - 2029
- Figure 39:
- VALUE SHARE OF SOY MILK MARKET, BY DISTRIBUTION CHANNEL, %, AUSTRALIA, 2022 VS 2029
- Figure 40:
- VOLUME OF NON-DAIRY YOGURT MARKET, METRIC TONNES, AUSTRALIA, 2017 - 2029
- Figure 41:
- VALUE OF NON-DAIRY YOGURT MARKET, USD MN, AUSTRALIA, 2017 - 2029
- Figure 42:
- VALUE SHARE OF NON-DAIRY YOGURT MARKET, BY DISTRIBUTION CHANNEL, %, AUSTRALIA, 2022 VS 2029
- Figure 43:
- VOLUME OF DAIRY ALTERNATIVES MARKET BY DISTRIBUTION CHANNEL, METRIC TONNES, AUSTRALIA, 2017 - 2029
- Figure 44:
- VALUE OF DAIRY ALTERNATIVES MARKET BY DISTRIBUTION CHANNEL, USD MN, AUSTRALIA, 2017 - 2029
- Figure 45:
- VOLUME SHARE OF DAIRY ALTERNATIVES MARKET, BY DISTRIBUTION CHANNEL , %, AUSTRALIA, 2017 VS 2023 VS 2029
- Figure 46:
- VALUE SHARE OF DAIRY ALTERNATIVES MARKET, BY DISTRIBUTION CHANNEL , %, AUSTRALIA, 2017 VS 2023 VS 2029
- Figure 47:
- VOLUME OF DAIRY ALTERNATIVES MARKET BY SUB DISTRIBUTION CHANNELS, METRIC TONNES, AUSTRALIA, 2017 - 2029
- Figure 48:
- VALUE OF DAIRY ALTERNATIVES MARKET BY SUB DISTRIBUTION CHANNELS, USD MN, AUSTRALIA, 2017 - 2029
- Figure 49:
- VOLUME SHARE OF DAIRY ALTERNATIVES MARKET, BY SUB DISTRIBUTION CHANNELS , %, AUSTRALIA, 2017 VS 2023 VS 2029
- Figure 50:
- VALUE SHARE OF DAIRY ALTERNATIVES MARKET, BY SUB DISTRIBUTION CHANNELS , %, AUSTRALIA, 2017 VS 2023 VS 2029
- Figure 51:
- VOLUME OF DAIRY ALTERNATIVES MARKET SOLD VIA CONVENIENCE STORES, METRIC TONNES, AUSTRALIA, 2017 - 2029
- Figure 52:
- VALUE OF DAIRY ALTERNATIVES MARKET SOLD VIA CONVENIENCE STORES, USD MN, AUSTRALIA, 2017 - 2029
- Figure 53:
- VALUE SHARE OF DAIRY ALTERNATIVES MARKET, SOLD VIA CONVENIENCE STORES, BY CATEGORY , %, AUSTRALIA, 2022 VS 2029
- Figure 54:
- VOLUME OF DAIRY ALTERNATIVES MARKET SOLD VIA ONLINE RETAIL, METRIC TONNES, AUSTRALIA, 2017 - 2029
- Figure 55:
- VALUE OF DAIRY ALTERNATIVES MARKET SOLD VIA ONLINE RETAIL, USD MN, AUSTRALIA, 2017 - 2029
- Figure 56:
- VALUE SHARE OF DAIRY ALTERNATIVES MARKET, SOLD VIA ONLINE RETAIL, BY CATEGORY , %, AUSTRALIA, 2022 VS 2029
- Figure 57:
- VOLUME OF DAIRY ALTERNATIVES MARKET SOLD VIA SPECIALIST RETAILERS, METRIC TONNES, AUSTRALIA, 2017 - 2029
- Figure 58:
- VALUE OF DAIRY ALTERNATIVES MARKET SOLD VIA SPECIALIST RETAILERS, USD MN, AUSTRALIA, 2017 - 2029
- Figure 59:
- VALUE SHARE OF DAIRY ALTERNATIVES MARKET, SOLD VIA SPECIALIST RETAILERS, BY CATEGORY , %, AUSTRALIA, 2022 VS 2029
- Figure 60:
- VOLUME OF DAIRY ALTERNATIVES MARKET SOLD VIA SUPERMARKETS AND HYPERMARKETS, METRIC TONNES, AUSTRALIA, 2017 - 2029
- Figure 61:
- VALUE OF DAIRY ALTERNATIVES MARKET SOLD VIA SUPERMARKETS AND HYPERMARKETS, USD MN, AUSTRALIA, 2017 - 2029
- Figure 62:
- VALUE SHARE OF DAIRY ALTERNATIVES MARKET, SOLD VIA SUPERMARKETS AND HYPERMARKETS, BY CATEGORY , %, AUSTRALIA, 2022 VS 2029
- Figure 63:
- VOLUME OF DAIRY ALTERNATIVES MARKET SOLD VIA OTHERS (WAREHOUSE CLUBS, GAS STATIONS, ETC.), METRIC TONNES, AUSTRALIA, 2017 - 2029
- Figure 64:
- VALUE OF DAIRY ALTERNATIVES MARKET SOLD VIA OTHERS (WAREHOUSE CLUBS, GAS STATIONS, ETC.), USD MN, AUSTRALIA, 2017 - 2029
- Figure 65:
- VALUE SHARE OF DAIRY ALTERNATIVES MARKET, SOLD VIA OTHERS (WAREHOUSE CLUBS, GAS STATIONS, ETC.), BY CATEGORY , %, AUSTRALIA, 2022 VS 2029
- Figure 66:
- VOLUME OF DAIRY ALTERNATIVES MARKET SOLD VIA ON-TRADE, METRIC TONNES, AUSTRALIA, 2017 - 2029
- Figure 67:
- VALUE OF DAIRY ALTERNATIVES MARKET SOLD VIA ON-TRADE, USD MN, AUSTRALIA, 2017 - 2029
- Figure 68:
- VALUE SHARE OF DAIRY ALTERNATIVES MARKET, SOLD VIA ON-TRADE, BY CATEGORY , %, AUSTRALIA, 2022 VS 2029
- Figure 69:
- MOST ACTIVE COMPANIES BY NUMBER OF STRATEGIC MOVES, COUNT, AUSTRALIA, 2017 - 2029
- Figure 70:
- MOST ADOPTED STRATEGIES, COUNT, AUSTRALIA, 2017 - 2029
- Figure 71:
- VALUE SHARE OF MAJOR PLAYERS, %, AUSTRALIA
Australia Dairy Alternatives Industry Segmentation
Non-Dairy Butter, Non-Dairy Cheese, Non-Dairy Ice Cream, Non-Dairy Milk, Non-Dairy Yogurt are covered as segments by Category. Off-Trade, On-Trade are covered as segments by Distribution Channel.| Category | Non-Dairy Butter | |||
| Non-Dairy Cheese | ||||
| Non-Dairy Ice Cream | ||||
| Non-Dairy Milk | By Product Type | Almond Milk | ||
| Cashew Milk | ||||
| Coconut Milk | ||||
| Hazelnut Milk | ||||
| Oat Milk | ||||
| Soy Milk | ||||
| Non-Dairy Yogurt | ||||
| Distribution Channel | Off-Trade | Convenience Stores | ||
| Online Retail | ||||
| Specialist Retailers | ||||
| Supermarkets and Hypermarkets | ||||
| Others (Warehouse clubs, gas stations, etc.) | ||||
| On-Trade | ||||
Need A Different Region or Segment?
Customize Now
Market Definition
- Dairy Alternatives - Dairy alternatives are foods that are made from plant-based milk/oils instead of their usual animal products, such as cheese, butter, milk, ice cream, yogurt, etc. Plant-based or non-dairy milk alternative is the fast-growing segment in the newer food product development category of functional and specialty beverage across the globe.
- Non-Dairy Butter - Non dairy butter is a vegan butter alternative that is made from a mixture of plant oils. With an increase in alternative diets like vegetarianism, veganism, and gluten intolerance, plant butter is a healthy non-dairy substitute for normal butter.
- Non-Dairy Ice Cream - Plant based ice cream is a growing category. Non-dairy ice cream is a type of dessert made without any animal ingredients. This is typically considered a substitute for regular ice cream for those who cannot or do not eat animal or animal-derived products, including eggs, milk, cream, or honey.
- Plant-Based Milk - Plant based milks are milk substitutes that are made from nuts (e.g., hazelnuts, hemp seeds), seeds (e.g., sesame, walnuts, coconuts, cashews, almonds, rice, oats, etc.) or legumes (e.g., soy). Plant-based milk such as soy milk and almond milk have been popular in East Asia and the Middle East for centuries.
| Keyword | Definition |
|---|---|
| Cultured Butter | Cultured butter is prepared by having the raw butter go through chemical processing and has been added with certain emulsifiers and foreign ingredients. |
| Uncultured Butter | This type of butter is one which has not been processed in any way |
| Natural Cheese | The type of cheese in its most natural form. It is made from natural and simple products and ingredients, including fresh and natural salts, natural colors, enzymes, and high-quality milk. |
| Processed Cheese | Processed cheese undergoes the same processes as natural cheese; however, it requires more steps and many different forms of ingredients. Making processed cheese involves melting natural cheese, emulsifying it, and adding preservatives and other artificial ingredients or colorings. |
| Single Cream | Single cream contains around 18% fat. It’s a single layer of cream that appears over boiled milk. |
| Double Cream | Double cream contains 48% fat, more than double the amount of fat of single cream. It’s heavier and thicker than single cream |
| Whipping Cream | This has a much higher fat percentage than single cream (36%). Used to top cakes, pies, and puddings and as a thickener for sauces, soups, and fillings. |
| Frozen Desserts | Desserts that are meant to be eaten in frozen condition. E.g., sherbets, sorbets, frozen yogurts |
| UHT Milk (Ultra-high temperature milk) | Milk heated at a very high temperature. Ultra-high-temperature processing (UHT) of milk involves heating for 1–8 sec at 135–154°C. which kills the spore-forming pathogenic microorganism, resulting in a product with a shelf-life of several months. |
| Non-dairy butter/Plant-based butter | Butter made from plant-derived oil such as coconut, palm, etc. |
| Non-dairy Yogurt | Yogurt made from typically made from nuts, like almonds, cashews, coconuts, and even other foods like soybeans, plantains, oats, and peas |
| On-trade | It refers to restaurants, QSRs, and bars. |
| Off-trade | It refers to supermarkets, hypermarkets, on-line channels, etc. |
| Neufchatel cheese | One of the oldest kinds of cheese in France. It is a soft, slightly crumbly, mold-ripened, bloomy-rind cheese made in the Neufchâtel-en-Bray region of Normandy. |
| Flexitarian | It refers to a consumer preferring a semi-vegetarian diet, that is centered on plant foods with limited or occasional inclusion of meat. |
| Lactose Intolerance | Lactose intolerance is a reaction in digestive system to lactose, the sugar in milk. It causes uncomfortable symptoms in response to the consumption of dairy products. |
| Cream Cheese | Cream cheese is a soft and creamy fresh cheese with a tangy taste made from milk and cream. |
| Sorbets | Sorbet is a frozen dessert made using ice combined with fruit juice, fruit purée, or other ingredients, such as wine, liqueur, or honey. |
| Sherbet | Sherbet is a sweetened frozen dessert made with fruit and some sort of dairy product such as milk or cream. |
| Shelf stable | Foods that can be safely stored at room temperature, or "on the shelf," for at least one year and do not have to be cooked or refrigerated to eat safely. |
| DSD | Direct Store Delivery is the process in supply chain management wherein the product is delivered from manufacturing plant directly to the retailer. |
| OU Kosher | Orthodox Union Kosher is a kosher certification agency based in New York City. |
| Gelato | Gelato is a frozen creamy dessert made with milk, heavy cream and sugar. |
| Grass-fed Cows | Grass-fed cows are allowed to graze in pastures, where they eat a variety of grasses and clover. |
Need More Details on Market Definition?
Ask a Question
Research Methodology
Mordor Intelligence follows a four-step methodology in all our reports.
- Step-1: Identify Key Variables: In order to build a robust forecasting methodology, the variables and factors identified in Step 1 are tested against available historical market numbers. Through an iterative process, the variables required for market forecast are set, and the model is built on the basis of these variables.
- Step-2: Build a Market Model: Market-size estimations for the forecast years are in nominal terms. Inflation is not a part of the pricing, and the average selling price (ASP) is kept constant throughout the forecast period for each country.
- Step-3: Validate and Finalize: In this important step, all market numbers, variables, and analyst calls are validated through an extensive network of primary research experts from the market studied. The respondents are selected across levels and functions to generate a holistic picture of the market studied.
- Step-4: Research Outputs: Syndicated Reports, Custom Consulting Assignments, Databases & Subscription Platforms

Get More Details On Research Methodology
Download PDF


