
Market Overview
| Study Period | 2020 - 2031 |
|---|---|
| Forecast Data Period | 2026 - 2031 |
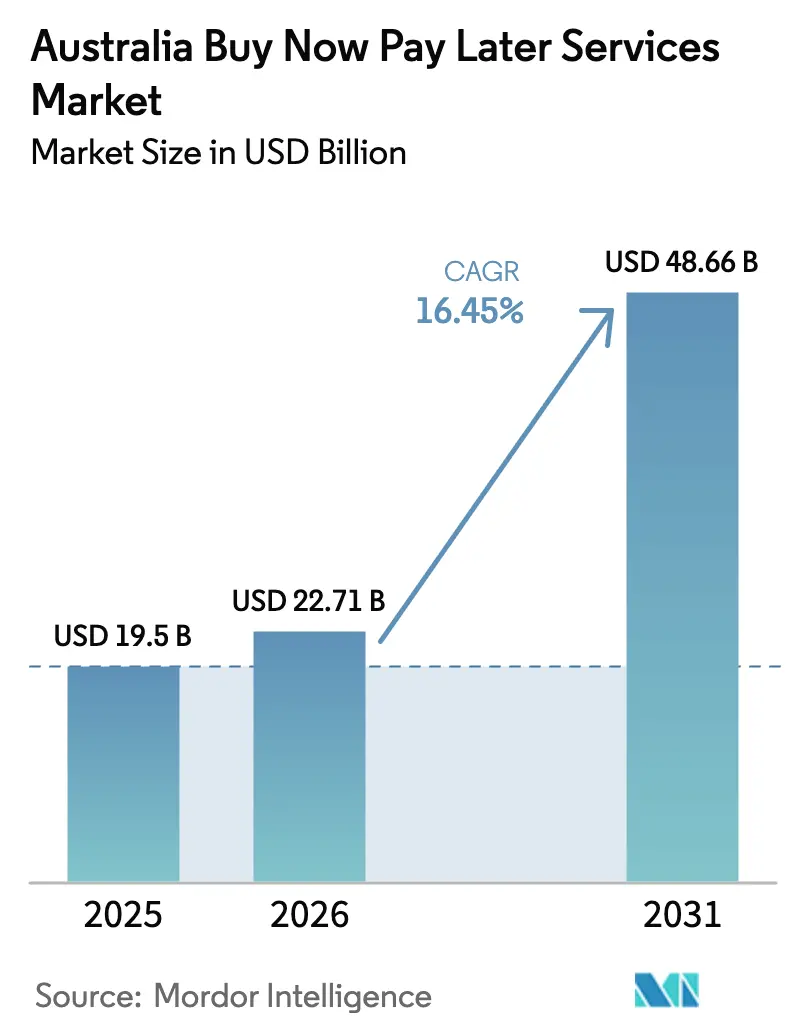
| Base Year Market Size (2025) | USD 19.50 Billion |
| Market Size (2026) | USD 22.71 Billion |
| Market Size (2031) | USD 48.66 Billion |
| Growth Rate (2026 - 2031) | 16.45 % |
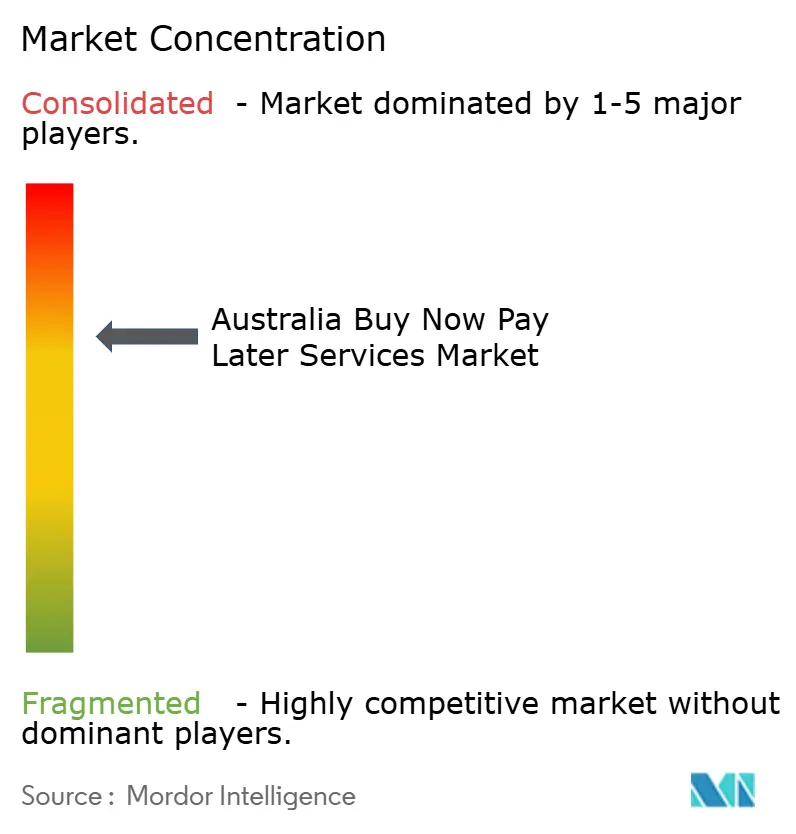
| Market Concentration | High |
Major Players *Disclaimer: Major Players sorted in no particular order Image © Mordor Intelligence. Reuse requires attribution under CC BY 4.0. | |
Australia Buy Now Pay Later Services Market Analysis by Mordor Intelligence
Australia BNPL services market size in 2026 is estimated at USD 22.71 billion, growing from 2025 value of USD 19.50 billion with 2031 projections showing USD 48.66 billion, growing at 16.45% CAGR over 2026-2031. Strong digital-commerce activity, high smartphone penetration, and real-time payment rails continue to propel the Australia BNPL market even as new credit-licensing rules alter competitive priorities. Fintech leaders are reinvesting in fraud analytics and omnichannel acceptance while banks leverage compliance infrastructure to scale. Online checkout remains the dominant use case, yet in-store rollouts tied to contactless POS terminals are expanding faster. Providers that blend responsible lending processes with friction-free user journeys have the best chance to capture incremental share across a tightening regulatory landscape.
Key Report Takeaways
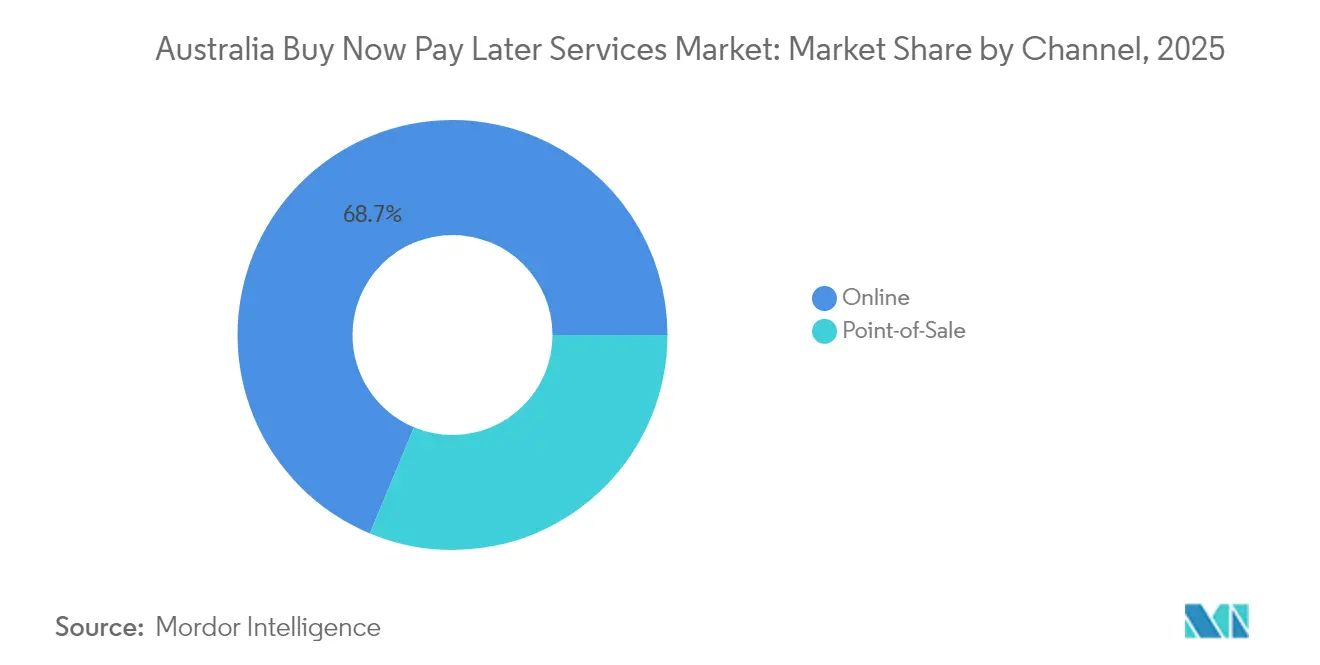
- By channel, the online segment held 68.72% of the Australia BNPL market share in 2025; in-store BNPL is forecasted to grow at an 18.15% CAGR through 2031.
- By end-use industry, fashion and apparel led with a 26.85% share of the Australia BNPL market in 2025, whereas healthcare and wellness are set to expand at a 19.42% CAGR to 2031.
- By age group, millennials controlled 44.25% of the Australia BNPL market size in 2025, while Generation Z records the highest projected CAGR at 19.78% through 2031.
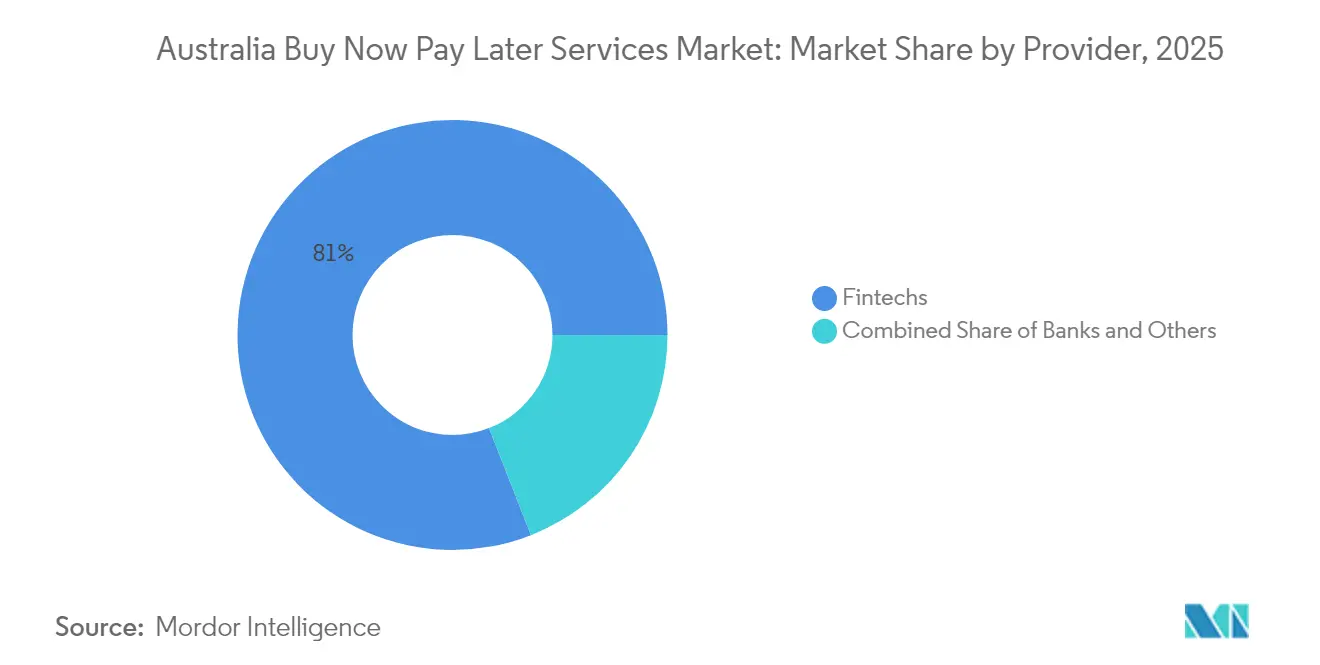
- By provider, fintech firms commanded 80.95% of the Australia BNPL market share in 2025, whereas banks are expected to post a 17.55% CAGR through 2031.
Note: Market size and forecast figures in this report are generated using Mordor Intelligence’s proprietary estimation framework, updated with the latest available data and insights as of 2026.
Australia Buy Now Pay Later Services Market Trends and Insights
Drivers Impact Analysis*
| Driver | ( ~ )% Impact on CAGR Forecast | Geographic Relevance | Impact Timeline |
|---|---|---|---|
| Millennials and Gen Z shift to credit alternatives | +5.1% | National with urban concentration | Medium term (2-4 years) |
| Merchant adoption to lift e-commerce conversion | +4.2% | National, metro focus | Short term (≤ 2 years) |
| Smartphone reach and NPP real-time rails | +3.7% | National | Medium term (2-4 years) |
| BNPL integration inside digital wallets | +2.9% | National | Short term (≤ 2 years) |
| In-store BNPL via POS rollouts | +2.2% | Sydney, Melbourne, Brisbane first | Medium term (2-4 years) |
| Source: Mordor Intelligence | |||
Rising Millennial and Gen Z Preference for Credit Alternatives in Australia
Millennials and Gen Z account for the largest and fastest-growing user pools in the Australia BNPL market, favoring predictable instalments over revolving cards. Generation Z alone already counts 58% penetration and is positioned to drive 48% of national retail spend by 2030, reinforcing a structural demand shift toward interest-free credit. Reduced appetite for traditional cards aligns with household budgeting needs, and purchase values increase once BNPL is presented at checkout. The demographic effect multiplies as younger cohorts consolidate everyday spending inside super-apps that bundle payments, rewards, and savings.
Merchant Adoption Driven by Higher Conversion Rates in Australian E-Commerce
Australian merchants report lower cart abandonment and larger ticket sizes when BNPL is offered. An internal PayPal study found that 75% of merchants saw order-value lifts after adding instalment options. BNPL now powers close to 15% of national online transactions, becoming a required line-item on most major retail sites. Merchants increasingly leverage BNPL data to refine marketing and loyalty offers, creating a feedback loop that reinforces adoption. Competitive differentiation shifts from price toward payment flexibility, and omnichannel retailers notice similar benefits after in-store launches.
High Smartphone Penetration & Real-Time Payments Infrastructure (NPP) Enabling Seamless BNPL Checkouts
Mobile commerce captures nearly all digital shoppers in Australia, supported by 95% smartphone usage[1]. The New Payments Platform settles funds instantly, allowing BNPL providers to verify accounts and disburse merchant payments in real time. Seamless authorization drives customer trust, which is critical given that 68% of consumers exit if checkout appears insecure. Embedded finance opportunities blossom as retailers integrate BNPL natively instead of redirecting to external portals. Enhanced performance analytics further lower fraud risk and operational cost for each instalment plan.
Integration of BNPL with Digital Wallets (Apple Pay, Google Pay)
Digital-wallet penetration keeps rising, and wallet operators now embed BNPL on the same device credential. Splitit’s ¬white-label rollout through Apple Pay and Google Pay allows contactless instalment approvals at any NFC terminal, accelerating usage inside grocery and convenience channels. Wallet aggregation eliminates the need for separate apps, resonating strongly with Gen Z users who toggle between social, banking, and shopping screens in one session. Seamless token-based provisioning lowers fraud exposure and increases merchant acceptance rates.
Restraints Impact Analysis*
| Restraint | ( ~ )% Impact on CAGR Forecast | Geographic Relevance | Impact Timeline |
|---|---|---|---|
| ASIC / AFIA rules on late fees and credit checks | -3.6% | National | Short term (≤ 2 years) |
| Consumer debt delinquencies in living-cost crunch | -2.8% | Lower-income districts | Medium term (2-4 years) |
| Interest-free credit cards from major banks | -1.9% | National | Medium term (2-4 years) |
| Merchant surcharge backlash | -1.5% | National | Short term (≤ 2 years) |
| Source: Mordor Intelligence | |||
Impending ASIC/AFIA Regulatory Tightening on Late Fees & Credit Checks
The Treasury Laws Amendment (Responsible Buy Now Pay Later and Other Measures) Act 2024 reclassifies BNPL as low-cost credit contracts. From June 10, 2025, providers must secure Australian credit licences and follow responsible lending obligations. ASIC has issued Regulatory Guide 281 and urged unlicensed operators to apply, signaling strict enforcement[2]. Consumer groups warn that late-fee caps may create a “poverty premium,” while compliance expenses push smaller firms to merge or exit. Large incumbents with mature risk frameworks can adapt, but growth momentum slows as underwriting rules tighten.
Rising Consumer Debt Delinquencies Amid Cost-of-Living Crisis
Inflationary pressure is raising default rates. Zip Co’s bad debts quadrupled in 2022, and Afterpay experienced a 50% jump in expected credit losses. Surveys show some households trim essentials to stay current on instalments, highlighting vulnerability in lower-income bands. Generation Z often operates several BNPL accounts at once, which compounds repayment risk. Providers are responding with AI-driven affordability checks, yet conservative lending could dampen transaction volumes, tempering the Australia BNPL market during economic stress.
*Our forecasts treat driver/restraint impacts as directional, not additive. The impact forecasts reflect baseline growth, mix effects, and variable interactions.
Segment Analysis
By Channel: Online Dominance Holds as In-Store Momentum Builds
The online segment accounted for 68.72% of the Australia BNPL market share in 2025, reflecting the digital-native origin of the model. Simple widget integrations, one-click authentication, and direct settlement into merchant dashboards preserve online supremacy. The Australia BNPL market size for online sales will still expand, yet growth gradually tapers as penetration nears saturation. Providers focus on loyalty bundles and cross-border checkout to hold engagement.
Point-of-sale adoption becomes the fastest lever for incremental volume, advancing at an 18.15% CAGR between 2026 and 2031. Tap-to-pay acceptance, QR prompts, and dynamic instalment offers at POS counters give shoppers the same flexibility they enjoy online. Contactless infrastructure and token-based credentials cut implementation hurdles, enabling even micro-merchants to switch on BNPL in minutes. As omnichannel journeys blend, consistent repayment dashboards keep customer trust intact and minimize cannibalization risk.

By End-Use Industry: Fashion Presence Endures while Healthcare Accelerates
Fashion and apparel retained 26.85% of the Australia BNPL market size in 2025 through an intuitive fit between seasonal cycles and instalment budgets. High-velocity stock-keeping units and influencer-driven launches sustain repeat usage, anchoring fashion as the performance barometer for the sector. Merchants push BNPL-exclusive discount codes, nudging adoption beyond purely price-driven shoppers.
Healthcare and wellness emerge as the fastest-growing vertical at a 19.42% CAGR through 2031, signaling a pivot from discretionary to essential spend. Dental, optical, and elective medical providers now feature BNPL at reception desks, often for ticket sizes that exceed immediate savings. Extended tenures of up to 24 months meet patient budgets without stretching provider receivables. The diversification builds counter-cyclical resilience into the Australia BNPL market, guarding revenue when retail categories slow.
By Age Group: Digital Natives Shape Long-Run Usage Curve
Millennials captured 44.25% of the Australia BNPL market in 2025, combining strong purchasing power and familiarity with fintech apps. Many already hold multiple accounts and now crave credit-score-building variants. Lifecycle triggers such as home furnishing or family health costs keep this cohort active, and loyalty integrations deepen wallet share.
Generation Z shows a 19.78% CAGR through 2031, making it the core acceleration band for the Australia BNPL market. High mobile screen time and aversion to revolving debt make instalments appealing. Social-checkout pathways that embed BNPL inside creator commerce resonate with this demographic. Older cohorts, including Generation X and Baby Boomers, adopt BNPL once healthcare and travel instalments gain visibility, further broadening the user pool.
By Provider: Fintech Scale Meets Bank Resurgence
Fintech pioneers held 80.95% of the Australia BNPL market share in 2025 after years of brand-led acquisition. Afterpay alone counts about 3.5 million local users and benefits from Block’s balance-sheet strength. Product roadmaps now prioritize licence readiness, AI fraud controls, and extended credit tenures to maintain leadership.
Banks deliver the fastest growth at 17.55% CAGR from 2026 to 2031 by bundling BNPL with everyday current accounts. Commonwealth Bank’s StepPay highlights how existing regulatory approvals, customer data, and branch networks ease onboarding challenges. Hybrid models emerge, where banks underwrite but fintechs front-end the experience. Over time, merchant-provided instalment plans may also surface as large retailers eye fee savings and data ownership, adding layers of competition across the Australia BNPL market.
Geography Analysis
Metropolitan corridors on Australia’s eastern seaboard-Sydney, Melbourne, and Brisbane-generate around 64.35% of national BNPL spend, driven by dense merchant networks and high digital wallet usage. Urban residents receive marketing earlier, accelerating adoption cycles. Strong fibre and 5G coverage in these centres lowers checkout latency and improves conversion.
Western Australia and South Australia follow with rising penetration as local merchants integrate BNPL into omnichannel platforms. Regional shoppers initially met BNPL online; now, in-store activations mirror this behavior, narrowing the urban-regional gap. Provider outreach focuses on trade associations and chamber-of-commerce events to educate small merchants on compliance and fee handling.
Rural penetration trails yet carries long-run upside for the Australia BNPL market. Infrastructure limitations, lower income levels, and fewer large-format retailers slow take-up, but aggregated digital marketplaces start to bridge the divide. As contactless cards grow ubiquitous even in remote stores, BNPL providers can add instalment screens with minimal hardware requirements. Targeted financial-literacy campaigns and transparent cost disclosures build trust among rural consumers and regulators alike.
Regulatory Landscape
Australia has moved BNPL into the statutory consumer-credit perimeter through the Treasury Laws Amendment (Responsible Buy Now Pay Later and Other Measures) Act 2024, bringing BNPL contracts under the National Consumer Credit Protection Act 2009 (National Credit Act) and the National Credit Code as low cost credit contracts. ASIC published Regulatory Guide 281 in May 2025 to set out how these low cost credit contracts are treated, including modified responsible lending expectations, and has signaled a more formal supervisory posture for providers and merchant-facing distribution arrangements.
From June 10, 2025, BNPL providers must hold (or vary) an Australian credit licence and be members of the Australian Financial Complaints Authority (AFCA), raising the compliance bar for both incumbents and smaller operators. The National Consumer Credit Protection Amendment (Low Cost Credit) Regulations 2025 (registered March 7, 2025) add operational guardrails such as fee-related standards, tightening unit economics and increasing the importance of scalable credit decisioning, complaints handling, and governance frameworks.
Value Chain Analysis
The Australia BNPL value chain starts with funding and risk capacity (balance sheet and warehouse facilities), then flows through product design and underwriting (affordability and credit checks aligned to the low cost credit contract framework), merchant acquisition and integration (e-commerce plugins, PSP and POS enablement), transaction processing and settlement (including real-time settlement workflows connected to the New Payments Platform), and finally collections, hardship support, and dispute resolution (including AFCA pathways). Data inputs such as credit files, fraud signals, device identity, and merchant conversion analytics sit across underwriting, fraud prevention, and lifecycle management, while customer experience layers increasingly sit inside digital wallets and bank apps.
Regulation and self-regulation now shape key bottlenecks and cost centers in the chain. Since June 10, 2025, the licensing and AFCA membership requirements, together with ASIC guidance in RG 281 and the Low Cost Credit Regulations 2025, add fixed compliance overhead and constrain fee structures, shifting advantage toward providers with mature compliance operations and automated decisioning. Industry coordination via the Australian Finance Industry Association (AFIA) BNPL Code of Practice acts as a complementary layer for conduct standards and helps normalize merchant and customer expectations, especially as providers extend from online checkout into in-store POS and into higher-ticket verticals such as healthcare.
Competitive Landscape
The Australia BNPL market exhibits high concentration. Afterpay and Zip Co form the dual leaders, reinforced by cross-border acquisitions and strategic tech integrations. Afterpay’s merger with Block injects back-end synergies, while Zip’s latitude acquisition broadens its merchant base and user profiles. Both firms headline merchant marketing that promotes BNPL as a mainstream tender type.
Traditional banks intensify competitive pressure. Commonwealth Bank leverages StepPay inside its digital banking app, instantly reachable by millions of existing customers. National Australia Bank and Westpac pilot similar instalment features, using credit-bureau insights to keep default levels within conventional lending thresholds. Bank entries raise average compliance standards and implicitly validate the product class with regulators.
The fast-growing middle layer includes global entrants such as Klarna, Sezzle, and Laybuy, each targeting specific niches—grocery, lifestyle, or cross-border retail. White-label platforms like Splitit power merchant-branded instalments that keep customer data in-house. AI-driven risk engines, loyalty tie-ins, and healthcare vertical suites serve as the new battlegrounds for differentiation, sustaining innovation velocity even as licensing rules tighten.
Australia Buy Now Pay Later Services Industry Leaders
-
Afterpay Limited
-
Zip Co Limited
-
PayPal Australia Pty Ltd
-
Humm Group Limited
-
CommBank StepPay (Commonwealth Bank of Australia)
- *Disclaimer: Major Players sorted in no particular order
Market Opportunities and Future Outlook
A clear opportunity sits in broadening BNPL beyond discretionary online retail into higher-need, higher-ticket, and more recurring spend categories, supported by product changes that lengthen tenors and embed at mainstream checkout points. Afterpay rolling out Pay Monthly at Apple Stores in Australia (6, 12, or 24 month plans at 0% interest) demonstrates a move toward longer-duration installment credit for premium electronics, while Zip enabling its payment option at checkout on THE ICONIC reinforces the commercial pull of large, high-frequency digital merchants in fashion and lifestyle.
A second opportunity is diversification into adjacent services that keep users inside the provider app and create new engagement loops for underwriting and retention. Zip launching ZMobile in Australia, including eSIM activation and in-app plan management, signals a pathway for BNPL platforms to bundle everyday services with payments and identity, while banks continue to scale app-native instalment products such as Commonwealth Bank StepPay using existing credit-licensing infrastructure. As the regulatory floor (Australian credit licence and AFCA membership) standardizes compliance expectations, merchant-facing differentiation shifts toward omnichannel acceptance, wallet and POS coverage, and risk tooling that supports responsible lending without adding friction at checkout.
Recent Industry Developments
- July 2026: Afterpay launched Pay Monthly at Apple Stores in Australia, enabling customers to split Apple purchases into 6, 12, or 24 monthly payments at 0% interest. The move extends BNPL into longer-tenor, higher-ticket purchases and deepens distribution through a globally recognized retail channel.
- May 2026: Zip Co faced a High Court of Australia decision in a trademark dispute linked to the "Zip" name, prompting the company to review branding implications. Legal clarity around naming and brand assets can influence customer acquisition efficiency and partner negotiations in a highly concentrated BNPL market.
- May 2025: ASIC published Regulatory Guide 281 on low cost credit contracts, providing operational guidance for BNPL reforms and signaling closer supervision. The guidance raised execution requirements around responsible lending controls and compliance readiness for providers operating under the post-June 2025 credit-licensing regime.
Research Methodology Framework and Report Scope
Market Definition and Coverage
This market covers the total value of buy now pay later transactions completed in Australia, where consumers split a purchase into short-term installments at checkout and repayment is scheduled across fixed tranches.
Scope exclusions: We exclude business-to-business pay-later arrangements and traditional credit card installment conversions that are not originated as BNPL at checkout.
Segmentation Overview
- By Channel
- Online
- Point-of-Sale (In-store)
- By End-Use Industry
- Consumer Electronics
- Fashion & Apparel
- Healthcare & Wellness
- Home Improvement
- Travel & Leisure
- Media & Entertainment
- Other End-Use Industries
- By Age Group
- Generation Z (18-28 Years)
- Millennials (29-44 Years)
- Generation X (45-60 Years)
- Baby Boomers (61-79 Years)
- Silent Generation (80 Years and Above)
- By Provider
- Fintechs
- Banks
- Others
Data Sources, Market Sizing, and Validation
Desk Research
Desk work was used to map the demand pool and pin down the right payment definitions before any modeling started. We relied on public sources such as the Reserve Bank of Australia (payments statistics and consumer credit), the Australian Bureau of Statistics (household spending and retail trade), ASIC publications on consumer credit and product design, and AUSTRAC guidance that shapes onboarding and compliance processes. Where it was relevant, we also checked industry disclosures from large merchants and payments participants, plus publicly available annual reports, investor presentations, and reputable press coverage tied to BNPL adoption.
To turn these inputs into a clean model, we used them to create guardrails for total retail and e-commerce spending, the online versus in-store mix, and the typical ticket size patterns that BNPL tends to attract. We also used a paid company financials and intelligence subscription for cross-checking reported volumes and unit economics where public filings were thin, and a patent database for spotting product shifts like virtual cards, in-app wallets, and POS enablement. The sources listed above are illustrative and not exhaustive, and many other public references were used during data collection, validation, and research clarification.
Primary Interviews and Surveys
Primary calls and surveys were run with BNPL ecosystem participants, including payments professionals, merchant-side finance teams, risk and compliance leaders, and channel partners supporting online checkout and physical POS. We used these conversations to pressure-test adoption by merchant type, check whether approval rates were changing, understand delinquency and loss trends, and track how pricing practices (merchant fees and late fees) are shifting alongside regulation and competition.
Distribution of primary research fieldwork respondents
| Company type | Respondent position |
|---|---|
| Top tier: 33% | CXOs: 13% |
| Mid tier: 53% | Functional/Unit leaders: 37% |
| Smaller Players: 14% | Managers: 50% |
Market-Sizing & Forecasting
The core sizing was built using a top-down demand reconstruction, where national retail and e-commerce spending baselines were translated into BNPL value by applying adoption and penetration rates that were validated through interviews. To keep the totals realistic, selective bottom-up checks were then used, such as sampling reported transaction volumes, using typical basket size ranges by merchant category, and stress-testing implied take-up for online checkout versus in-store POS.
A few inputs mattered more than most for this market, so they were treated as explicit model drivers. These included online retail share and its growth rate, BNPL penetration within online checkouts, the pace of in-store BNPL enablement, average ticket size by common BNPL categories, approval rate and repeat usage behavior, and changes in delinquency that can cap offered limits. For forecasting, scenario analysis was used so the model could reflect different paths for regulation, consumer sentiment, and merchant acceptance, which are then aligned to the consensus view we heard from industry experts. When company-level details were not available, gaps were handled by using conservative ranges from primary research and then checking that the implied totals still lined up with retail spending ceilings.
Data Validation & Update Cycle
Outputs were cross-checked against independent signals such as payments system trends, retail trade direction, and the observed mix shift between online and in-store usage. If a metric moved outside a sensible band, the assumptions were reviewed, the math was re-run, and respondents were re-contacted to confirm whether the shift was real or data-driven noise.
Before sign-off, we run multi-step internal reviews that compare year-on-year movements, unit consistency, and implied adoption levels by channel. Reports refresh annually, and interim updates are made when material events occur, such as a major regulatory change or a sharp swing in consumer credit conditions. Right before delivery, a final analyst pass is completed so clients receive the most recent view based on updated data points and re-validated assumptions.
Mordor Intelligence's Australia Buy Now Pay Later Services Market Size Measured Against Other Published Estimates
Published market sizes for BNPL in Australia often do not match, mainly because the definition of what gets counted is not consistent across sources. Differences also show up when one estimate tracks transaction value at checkout while another focuses on provider revenues, which are much smaller by design.
By checking omnichannel checkout value, refreshing the online versus in-store mix, and re-validating typical ticket sizes with merchant-side inputs, Mordor Intelligence keeps the sizing tied to consumer purchase flow rather than to fee-only income measures.
Benchmark comparison
| Source | Market Size | Gaps in Research Methodology |
|---|---|---|
| Mordor Intelligence | USD 19.50 B (2025) | |
| Industry Databook A | USD 16.84 B (2024) | Reports BNPL payments for a different base year and may apply a simplified channel split, which can miss the step-up when in-store POS acceptance expands. |
| Industry Report B | USD 12.95 B (2024) | Uses a more conservative growth path and can blend payment value with revenue-oriented assumptions, which typically lowers the stated market size versus checkout value tracking. |
The spread in the table is mostly explained by how each publisher treats channel coverage and whether the metric is payment value or something closer to provider income. Our model stays repeatable because it starts from observable retail spending pools, and then it is tightened through interview checks on penetration, approval behavior, and POS rollout pace.
Key Questions Answered in the Report
What is the current value of the Australia BNPL market?
The Australia BNPL market size stands at USD 22.71 billion in 2026 and is forecast to reach USD 48.66 billion by 2031.
How fast is the sector growing?
The market is expanding at a 16.45% CAGR for the 2026-2031 period, driven by widespread smartphone usage, real-time payments rails, and merchant adoption.
Which segment holds the largest share?
Online checkouts held 68.72% of the Australia BNPL market share in 2025, reflecting the model’s digital roots.
What impact will new regulations have?
From June 2025, BNPL providers must hold Australian credit licences and apply responsible-lending checks, likely prompting consolidation among smaller operators.
Which vertical shows the fastest growth?
Healthcare and wellness leads with a 19.42% CAGR through 2031 as consumers seek installment options for medical expenses.
Are banks entering the BNPL space?
Yes, banks such as Commonwealth Bank report double-digit growth for in-house BNPL services, leveraging existing compliance frameworks to scale quickly.