
Market Overview
| Study Period | 2021 - 2031 |
|---|---|
| Forecast Data Period | 2026 - 2031 |
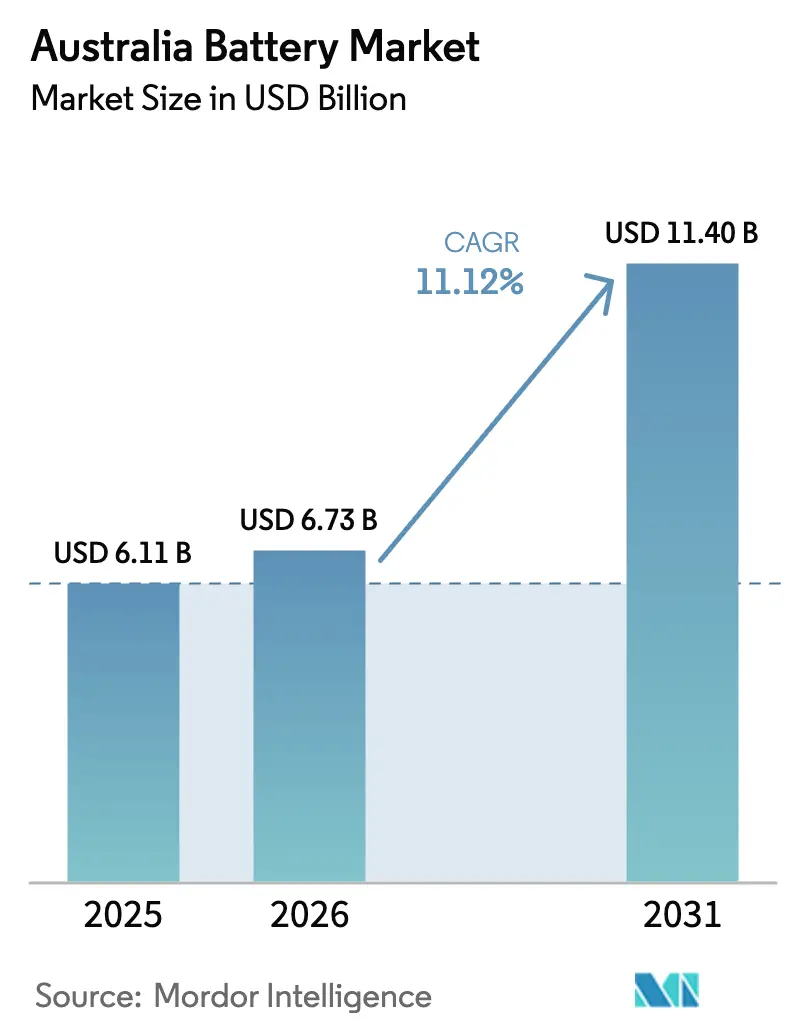
| Base Year Market Size (2025) | USD 6.11 Billion |
| Market Size (2026) | USD 6.73 Billion |
| Market Size (2031) | USD 11.40 Billion |
| Growth Rate (2026 - 2031) | 11.12 % |
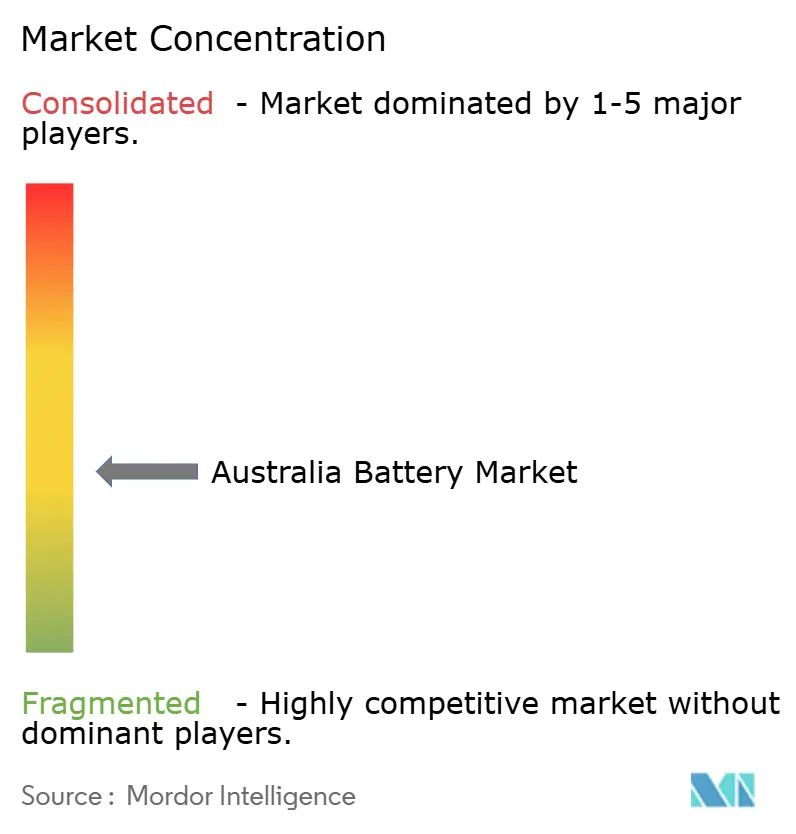
| Market Concentration | Medium |
Major Players
*Disclaimer: Major Players sorted in no particular order Image © Mordor Intelligence. Reuse requires attribution under CC BY 4.0. |
|
Australia Battery Market Analysis by Mordor Intelligence
The Australia Battery Market size is expected to grow from USD 6.11 billion in 2025 to USD 6.73 billion in 2026 and is forecast to reach USD 11.40 billion by 2031 at 11.12% CAGR over 2026-2031.
This trajectory highlights a nationwide transition from fossil-fuel dependence toward electrified transport and renewable-driven power systems, supported by falling lithium-ion pack prices, an AUD 2 billion critical-minerals finance facility, and aggressive state procurement of large-scale batteries. Federal fuel-efficiency standards are pushing vehicle makers to accelerate electric-vehicle (EV) rollouts, which is lifting demand for high-cycle secondary cells, while coal-plant retirement schedules in New South Wales (NSW) and Victoria have moved utilities to tender multi-gigawatt storage arrays. Local assembly ambitions are growing around lithium-iron-phosphate packs as policymakers seek to capture more value domestically, yet upstream material gaps still expose integrators to import risks. Defence orders for submarine and guided-weapon batteries add a strategic layer that prioritizes sovereign capability, nudging suppliers to locate facilities near naval precincts. Together, these vectors narrow payback periods for storage projects, expand addressable use cases, and intensify competition across the Australian battery market.
Key Report Takeaways
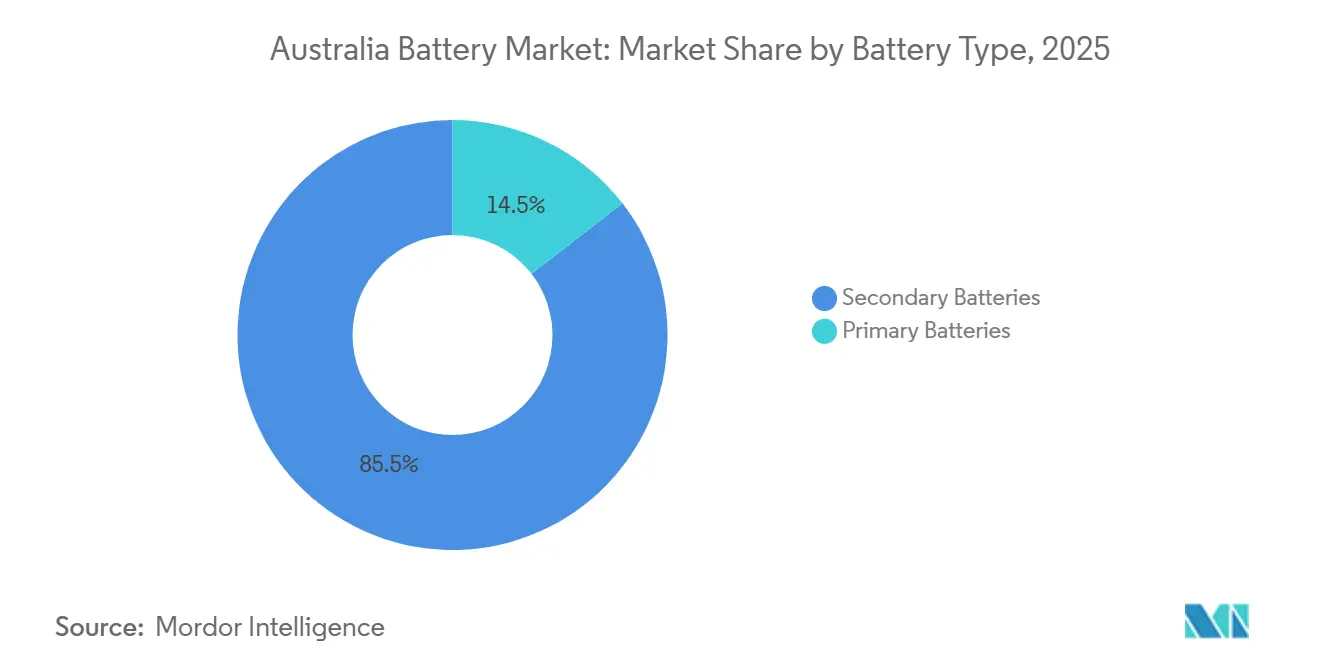
- By battery type, secondary batteries held 85.5% of the Australian battery market share in 2025, and they are set to expand at a 12.8% CAGR to 2031.
- By technology, lead-acid commanded 41.9% of the Australian battery market share in 2025, whereas lithium-ion is forecast to post the fastest 19.5% CAGR through 2031.
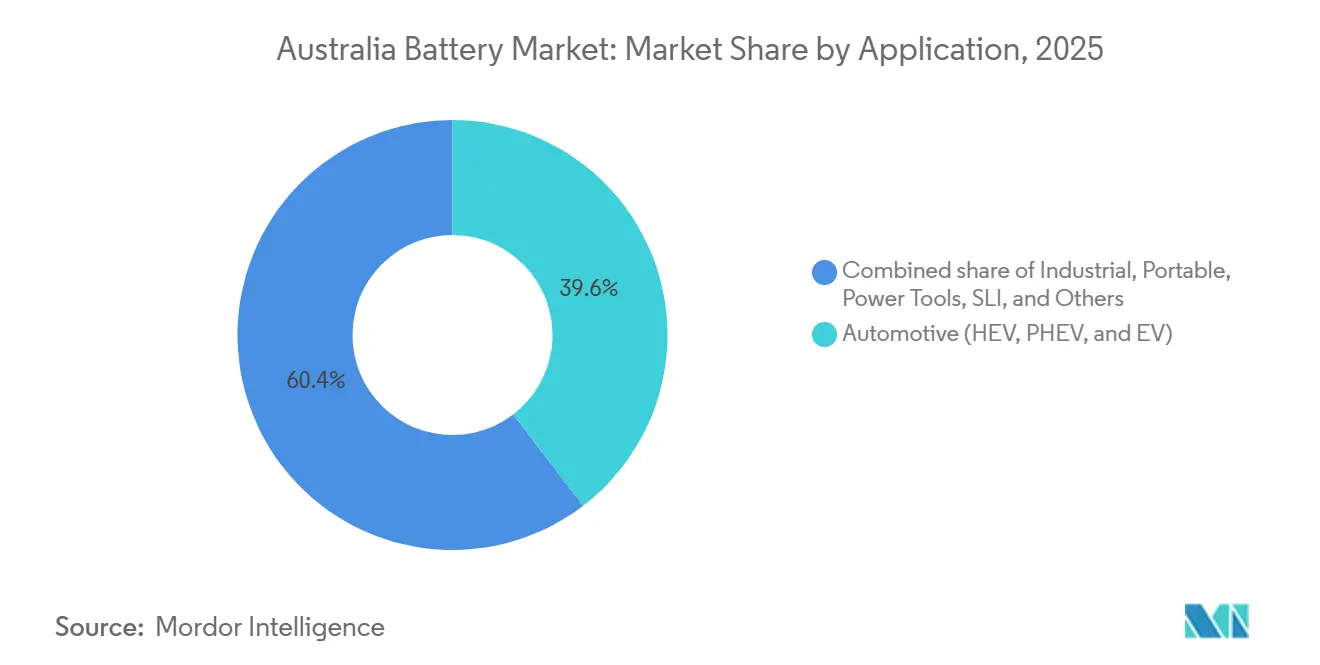
- By application, automotive batteries led with 39.6% share in 2025, while industrial applications are poised to register a 17.2% CAGR to 2031.
Note: Market size and forecast figures in this report are generated using Mordor Intelligence’s proprietary estimation framework, updated with the latest available data and insights as of January 2026.
Australia Battery Market Trends and Insights
Drivers Impact Analysis*
| Driver | (~) % Impact on CAGR Forecast | Geographic Relevance | Impact Timeline |
|---|---|---|---|
| Surging EV adoption catalysed by Federal Fuel Efficiency Standards | +2.3% | National, with early concentration in NSW, VIC metropolitan areas | Medium term (2-4 years) |
| Rapid renewable-plus-storage tenders from states (NSW, SA, VIC) | +2.8% | NSW, SA, VIC leading; QLD emerging | Short term (≤ 2 years) |
| Accelerated phase-out of coal-fired power stations drives grid-scale storage | +2.1% | NSW (Eraring, Liddell), VIC (Loy Yang A, Yallourn), QLD (Callide, Tarong) | Long term (≥ 4 years) |
| Falling lithium-ion battery pack prices (< USD 100/kWh threshold) | +1.9% | National, with spillover to industrial and residential segments | Short term (≤ 2 years) |
| Australian Government's AUD 2 billion Critical Minerals Facility spurs local battery value chain | +1.2% | National, with clusters in WA (lithium), QLD (refining), NSW (manufacturing) | Long term (≥ 4 years) |
| Defence push for sovereign submarine & guided-weapons battery systems | +0.6% | SA (Osborne Naval Shipyard), WA (Henderson), NSW (defence precincts) | Long term (≥ 4 years) |
| Source: Mordor Intelligence | |||
Surging EV Adoption Catalyzed by Federal Fuel-Efficiency Standards
Federal fleet-average CO₂ limits that took effect in 2025 are compelling vehicle brands to raise EV allocations to Australia or face penalty payments. National light-duty EV registrations climbed 35% year on year to 87,000 units in 2025, led by models such as Tesla Model Y and BYD Atto 3.[1]Federal Chamber of Automotive Industries, “Electric Vehicle Sales Data 2025,” fcai.com.au Fleet operators, including rental agencies and ride-hail platforms, have accelerated orders to lock in depreciation schedules, and battery demand is rising for nickel-manganese-cobalt and lithium-iron-phosphate chemistries sized between 60 kWh and 75 kWh. Charging-infrastructure expansion lags vehicle uptake, yet the regulatory certainty has enabled multi-year offtake agreements between global cell makers and domestic pack assemblers. As a result, EV-related orders account for the largest single pull on high-energy-density cells within the Australian battery market.
Rapid Renewable-Plus-Storage Tenders from States (NSW, SA, VIC)
States awarded 4.2 GW of combined renewable-generation and storage contracts in 2025, triple 2023 volume.[2]Australian Energy Market Operator, “Integrated System Plan 2024,” aemo.com.au Flagship projects include the 2 GW Waratah Super Battery in NSW and the 450 MW Geelong Big Battery expansion in Victoria, each backed by 15-year capacity-payment schemes that derisk financing.[3]New South Wales Government, “Waratah Super Battery Project,” nsw.gov.au South Australia’s grid-forming inverter pilots at Hornsdale are showing batteries can supply voltage and frequency reference without thermal plant support.[4]South Australian Government, “Hornsdale Grid-Forming Trials,” sa.gov.au The compressed build schedules are stretching module supply chains, encouraging developers to source from domestic integrators to avoid shipping delays and import duties.
Accelerated Phase-Out of Coal-Fired Stations Drives Grid-Scale Storage
The planned exit of 6.5 GW of coal capacity by 2035 (Eraring in 2027, Yallourn in 2028, and Loy Yang A in 2035) is forcing network planners to procure fast-response batteries to replace synchronous inertia. Queensland’s SuperGrid Blueprint allocates AUD 62 billion (USD 41 billion) to transmission and 3 GW of long-duration storage, signaling a multi-year build cycle. Developers favor retired coal sites that already have transmission links, saving years of grid-connection lead time. The storage mix is diverging between one-hour lithium-ion systems for frequency regulation and four-to-eight-hour flow batteries for evening-peak firming.
Falling Lithium-Ion Battery Pack Prices Below USD 100/kWh
BloombergNEF’s 2024 survey placed average pack pricing at USD 97/kWh, an 18% drop from 2023 and the lowest level on record. Residential installers responded with a 22% jump in battery attachment to rooftop solar in 2025, and commercial buyers cut payback periods to under five years in demand-charge management projects. Although cost declines are slowing as raw-material prices floor, pricing under USD 100/kWh has widened economic viability for a broad spectrum of Australia battery market applications.
Restraints Impact Analysis*
| Restraint | % Impact on CAGR Forecast | Geographic Relevance | Impact Timeline |
|---|---|---|---|
| Fragmented domestic battery manufacturing ecosystem | -1.4% | National, with acute gaps in NSW, VIC assembly capacity | Medium term (2-4 years) |
| Supply-chain bottlenecks for anode/precursor materials | -1.1% | National, with import dependency on China, Japan for graphite, electrolyte salts | Short term (≤ 2 years) |
| Lagging end-of-life recycling & take-back logistics | -0.7% | National, with pilot facilities in VIC, SA only | Long term (≥ 4 years) |
| Distribution-network hosting-capacity limits for behind-the-meter storage | -0.9% | Urban NSW, VIC, QLD distribution feeders | Medium term (2-4 years) |
| Source: Mordor Intelligence | |||
Fragmented Domestic Battery Manufacturing Ecosystem
Australia hosts fewer than a dozen sub-gigawatt-hour assembly plants, none at a scale rivaling Asian gigafactories. Redflow’s voluntary administration in 2025 exposed the capital intensity of local integration without anchor orders. Energy Renaissance’s Tomago facility will reach 1.5 GWh of pack output by 2027, yet it still imports finished cells, capturing only one-fifth of the bill-of-materials value. State subsidies remain fragmented, preventing economies of scale in workforce training and shared R&D. Until coordinated national support emerges, integrators face higher working-capital needs and currency risk, which moderates growth across the Australian battery market.
Supply-Chain Bottlenecks for Anode and Precursor Materials
Synthetic graphite, electrolyte salts, and nickel sulfate are heavily sourced from China and Japan, creating single-country concentration risk. In 2025, 61% of Australian spodumene exports left the country without conversion, forgoing a four-to-six-times value uplift. High-temperature furnaces and renewable-power requirements have slowed domestic synthetic-graphite ventures, and permitting timelines stretch four-plus years. Shipment delays in 2024 postponed grid-battery commissioning by up to 12 weeks, prompting developers to diversify toward suppliers in Mozambique and South Korea, though contracted volumes cover less than 10% of aggregate demand.
*Our forecasts treat driver/restraint impacts as directional, not additive. The impact forecasts reflect baseline growth, mix effects, and variable interactions.
Segment Analysis
By Battery Type: Rechargeable Dominance Reflects Electrification Shift
Secondary batteries accounted for 85.5% of 2025 revenue and are expanding at a 12.8% CAGR, underscoring how electrification in transport, grid services, and households is redefining the Australian battery market size. Primary cells maintained a 14.5% niche in low-drain devices, but extended-producer-responsibility rules under consideration in Victoria and South Australia threaten margins. Residential adoption of Tesla Powerwall 3 exceeded 6,000 units in its first quarter on the market, and installation momentum is spreading to the SonnenCore and LG ESS lines, amplifying volume growth. At the industrial end, grid-storage integrators favor secondary chemistries for multi-cycle resilience, while remote sensors and military hardware keep single-use cells relevant.
Margin pressure is building as lithium-ion costs fall; integrators have seen gross margins slide from 25% to 18% since 2024, prompting deeper vertical integration. Energy Renaissance plans to pair assembly with end-of-life disassembly, targeting 92% lithium, cobalt, and nickel recovery. Primary battery producers face higher landfill fees and tightening mercury limits, nudging clients toward rechargeable alternatives. Long-cycle chemistries such as lithium-metal and solid-state are under pilot evaluation, and their commercialization could introduce higher-density options suitable for aviation and maritime by 2028, reshaping the competitive order inside the Australian battery market.


By Technology: Lithium-Ion Disruption Amid Lead-Acid Incumbency
Lead-acid held 41.9% of 2025 revenue thanks to a mature recycling system that recovers 98% of lead content, insulating producers from raw-material swings. Telecom operators and warehouse-equipment fleets still specify lead-acid where cost and legacy infrastructure outweigh weight penalties. Lithium-ion, however, is advancing at a 19.5% CAGR, driven by EVs, residential solar-plus-storage, and grid-scale arrays. Nickel-metal-hydride keeps a foothold in hybrid vehicles, while nickel-cadmium persists in aviation emergency lighting but faces phase-out pressure.
Solid-state prototypes are edging toward 500 Wh/kg energy density, with QuantumScape reporting 1,000 cycles at 80% retention, yet yields remain too low for volume production. Flow batteries, led by vanadium-redox and zinc-bromine chemistries, offer long-duration discharge and near-unlimited cycles, suiting evening-peak firming despite capital costs that still sit double lithium-ion levels. The technology contest is pushing lead-acid recyclers to diversify into lithium recovery while lithium-ion suppliers race to drop pack prices below USD 80/kWh, a figure that would unlock total-cost parity for industrial motive power in the Australian battery market.
By Application: Industrial Surge Outpaces Automotive Leadership
Automotive batteries represented 39.6% of 2025 revenue as EV and hybrid sales increased, yet industrial usage, including telecom towers, data centers, and grid storage, is forecast to grow faster at 17.2% CAGR through 2031. Telstra installed 2,400 lithium-ion tower systems in 2025, doubling average backup duration to eight hours, and data-center operators such as NextDC now specify lithium-ion UPS with 95% round-trip efficiency. Utility-scale projects reached 1.8 GWh of installed capacity in 2025, with another 6.5 GWh under construction, creating a robust pipeline that supports high-energy cell demand and expands the Australian battery market size for stationary deployments.
Chemistry selection diverges by mobility needs: nickel-manganese-cobalt for long-range EVs, lithium-iron-phosphate for value-oriented models, and nickel-cobalt-aluminum for performance segments. Fleet operators value eight-year warranties and residual guarantees, while commercial-vehicle electrification is catching up as state procurement mandates clarify order volumes. Portable-electronics batteries face mature smartphone demand, but growth persists in wearables, drones, and e-bikes. Altogether, the application mix continues to tilt toward segments with higher cycle counts and longer operating lives, reinforcing top-line resilience for the Australian battery market.
Geography Analysis
Eastern seaboard states dominate deployments. NSW led grid-storage additions in 2025 with the 2 GW Waratah Super Battery and a 700 MW expansion at Eraring, collectively supplying 3.2 GWh of firming capacity scheduled for completion by 2027. Victoria’s renewable-energy zones attracted AUD 8.3 billion (USD 5.5 billion) of investment in 2025, anchored by the Geelong Big Battery, and the state requires that half of new renewable capacity include co-located storage to receive network-connection priority.
South Australia operates the Hornsdale Power Reserve, which became the first large battery to deliver grid-forming capability after a 212 MW expansion in 2025. Queensland’s AUD 62 billion SuperGrid program targets 22 GW of renewables and 3 GW of long-duration storage by 2035, with near-term focus on a north-south transmission corridor that will rely on 1.5 GW of intermediate batteries. Western Australia’s isolated grid is installing solar-battery microgrids to replace rural feeders, recording 200 systems in 2025, while Tasmania leverages hydro reservoirs for pumped storage to export firming via the Marinus Link.
Distribution-network constraints limit behind-the-meter adoption in urban areas. Ausgrid and Powercor have rolled out dynamic operating envelopes that adjust export limits in real time, enabling more rooftop solar batteries without costly feeder upgrades. The Northern Territory and Australian Capital Territory pursue 100% renewable goals by 2030, so their storage spend outweighs load size, exemplified by the 35 MW Darwin-Katherine battery and the 250 MW Big Canberra Battery. Differing state connection codes, tariff structures, and safety standards inflate compliance costs, slowing technology diffusion but also creating consultancy and software niches within the Australian battery industry.
Regulatory Landscape
Australia's battery market operates within the National Electricity Market (NEM) rulemaking, with storage able to participate under an integrated framework. The Australian Energy Market Commission (AEMC) integrated storage into the NEM through the Integrated Resource Provider framework, with a phased rollout completed in 2024, enabling storage and hybrid assets to participate using clearer, technology-neutral registration and dispatch arrangements.
Value Chain Analysis
Australia's battery value chain remains import-intensive for cells and several key inputs, while policy and selected investments pull activity downstream into pack assembly, components, and recycling. Upstream, Australia is strong in critical mineral extraction, notably lithium, but conversion into anode, cathode precursor, and electrolyte supply is still limited, which keeps integrators reliant on international sourcing and exposed to shipping variability.
The National Battery Strategy, launched in May 2024, formalized five priorities covering manufacturing capability, global supply chains, skills, standards, and government coordination. It is supported by programs such as the Battery Breakthrough Initiative (USD 523.2 million in production-linked incentives) and the Building Future Battery Capabilities measure (USD 20.3 million), which focus on standards and guidelines.
Competitive Landscape
The Australian battery market remains moderately fragmented, with no firm controlling more than 15% of total revenue. Global cell giants LG Energy Solution, CATL, and Panasonic supply most modules, while domestic integrators such as Energy Renaissance and Battery Energy Power Solutions focus on pack assembly and balance-of-plant engineering. Tesla’s vertical stack, with cells from Nevada and Megapack assembly and operation at Hornsdale, shows the advantage of scale, yet its premium positioning leaves room for cost-focused rivals.
Strategic moves in 2025 illustrate rising intensity. LG Energy Solution allocated AUD 200 million to expand its Sydney module plant to 2 GWh by 2028. Fluence Energy secured an AUD 1.4 billion EPC contract for the 2 GW Waratah project, deepening utility-scale credentials. Envirostream opened Victoria’s first 3,000-ton-per-year lithium-ion recycling line, while MGA Thermal raised AUD 10 million to commercialize aluminum-silicon heat-storage blocks. Chinese entrants BYD and EVE Energy have begun direct distribution, undercutting incumbent module pricing by up to 20% and prompting consolidation among sub-scale local assemblers.
Despite growing domestic ambition, supply-chain gaps in cathode, anode, and electrolyte production make full vertical integration elusive. The AUD 2 billion Critical Minerals Facility is easing financing hurdles, yet equity co-investment requirements slow uptake. Defence procurement brings a niche but high-margin demand stream, with PMB Defence winning multi-year contracts to supply lithium-polymer packs for guided-weapon programs. As circular-economy regulations tighten, companies able to tie upstream supply with end-of-life recovery are set to gain share in the next growth phase of the Australian battery market.
Australia Battery Industry Leaders
-
Century Yuasa Batteries Pty Ltd
-
Enersys Australia Pty Ltd
-
Sonnen Australia Pty Limited
-
R & J Batteries Pty Ltd.
-
PMB Defence
- *Disclaimer: Major Players sorted in no particular order

Market Opportunities and Future Outlook
Utility-scale storage is the main whitespace area across Australia's energy transition buildout, with new tendering and planning signals translating into larger, financeable project sets. In June 2026, AEMO published the final 2026 Integrated System Plan (ISP), setting a system development target of 35 GW of short and medium-duration storage plus 5 GW of long-duration storage by 2050. The 2026 grid-scale connection pipeline reported at 45 GW also highlights how many projects are competing for approvals and grid access.
Federal underwriting through the Capacity Investment Scheme is further converting planning activity into contracted volume. Tender 8 in June 2026 secured 4.2 GW and 16.2 GWh of battery storage capacity, supporting demand across cells, containers, PCS/inverters, EMS software, and long-term service agreements.
Recent Industry Developments
- July 2026: Samsung C&T submitted the 600 MWh Comet Park BESS for federal environmental assessment under the EPBC Act. The filing moves the project into a national approvals pathway that can affect schedule certainty for large storage builds. It also points to continued participation by global EPC and infrastructure players in Australia’s utility-scale BESS pipeline.
- December 2025: LG Energy Solution Australia committed AUD 200 million to expand its Sydney module facility to 2 GWh of annual capacity by 2028. The investment increases local module availability for stationary and mobility applications while aiming to reduce lead times tied to offshore supply. It also raises competitive pressure for domestic pack assemblers that rely on imported modules.
- August 2024: Li-S Energy opened a 2 MWh battery production facility in Geelong, Victoria, supported by an Industry Growth Program grant. The facility adds domestic manufacturing and testing capacity for next-generation chemistries and small-batch production. It strengthens the local innovation-to-commercialization pathway for specialized battery applications within Australia.


Research Methodology Framework and Report Scope
Market Definition and Coverage
We size the Australia battery market as revenue earned from selling primary and secondary batteries in Australia, counted across major technologies and end-use applications where batteries are installed or replaced.
Scope exclusions: Battery minerals and battery-grade chemicals (such as lithium, nickel, cobalt, and graphite) are excluded, along with charging equipment and installation labor.
Segmentation Overview
-
By Battery Type
- Primary Batteries
- Secondary Batteries
-
By Technology
- Lead-acid
- Li-ion
- Nickel-metal hydride
- Nickel-cadmium
- Sodium-sulfur
- Solid-state
- Flow Battery
- Emerging chemistries
-
By Application
- Automotive (HEV, PHEV, and EV)
- Industrial (Motive, Stationary (Telecom, UPS, ESS), etc.)
- Portable (Consumer Electronics, etc.)
- Power Tools
- SLI
- Other Applications
Data Sources, Market Sizing, and Validation
Desk Research
Desk research was used to set the industry frame and to pull stable, public indicators that can be tracked each year. Common inputs included Australia trade and customs statistics for battery-related imports, energy statistics and outlooks from government bodies, and vehicle market releases to understand the direction of EV and hybrid adoption. We also used public safety and standards references for batteries to sense shifts in allowable chemistries and transport rules, which can affect product mix and pricing.
For supporting evidence, we reviewed sources such as the Australian Bureau of Statistics, the Department of Climate Change, Energy, the Environment and Water, the Clean Energy Regulator, and IEA publications for batteries and energy storage context. We also relied on company annual reports, investor presentations, association publications, and reputable press coverage for demand signals and announced capacity or projects. In a few cases, our analysts used paid subscriptions for company financials and news screening, and for shipment-level import or export reads when public series were too aggregated. These sources are illustrative only, and many other references were used for data collection, validation, and clarification during the study.
Primary Interviews and Surveys
Primary work focused on aligning the model with what is actually moving in Australia across replacement cycles and new installations. We spoke with a mix of battery manufacturers and distributors, automotive and SLI channel participants, portable and tool battery stakeholders, and energy storage project-linked experts, and then we validated assumption ranges on pricing, mix, and timing.
To reduce blind spots, interviews were balanced across demand pools that behave differently, including automotive, stationary storage, and portable uses. We then pressure-tested the same inputs across Australia-wide supply chains before finalizing the market totals.
Distribution of primary research fieldwork respondents
| Company type | Respondent position |
|---|---|
| Top tier: 29% | CXOs: 14% |
| Mid tier: 57% | Functional/Unit leaders: 37% |
| Smaller Players: 14% | Managers: 49% |
Market-Sizing & Forecasting
The core sizing started with a top-down build that reconstructs Australia demand by mapping each major application to a realistic battery need, and then translating that into value using observed pricing and mix. In practice, the model uses application-level demand signals such as vehicle parc and replacement rates for SLI, EV and hybrid sales direction for traction batteries, installed and planned stationary storage capacity trends, and the growth of cordless power tools and portable electronics that drives smaller-format packs.
Once the demand pool was established, results were corroborated with selective bottom-up approximations, including roll-ups from a sample of suppliers and distributors, channel checks on typical price bands, and sanity checks using import intensity where it was a meaningful indicator for Australia. Where bottom-up visibility was uneven (for example, in emerging chemistries or project-led stationary deployments), we handled gaps by using conservative adoption ramps that were validated through expert inputs, then revisited during variance checks.
For forecasting, we used scenario analysis anchored to a base case, because the market can swing with policy settings, grid connection timelines for storage, and sharp movements in lithium-ion pricing. The forward view was shaped by a small set of variables that are easy to update, including EV penetration trend, residential and utility storage additions, replacement cycle timing in automotive batteries, technology mix shifts between lead-acid and lithium-ion, and expected price progression by chemistry.
Data Validation & Update Cycle
Validation was done through multiple passes that compare model outputs with independent signals, and then reconcile gaps before sign-off. Our analysts check whether implied volumes, replacement cycles, and price bands make sense against trade patterns, public installation trends for storage, and the direction of automotive activity. We re-contact selected experts when a variance looks structural rather than timing related.
Before final publication, the draft totals and growth rates go through analyst review steps that include anomaly checks by application and technology, and consistency checks across years so the curve does not move abruptly without a real driver. Reports are refreshed annually, and interim updates are made when a material event changes prices, policy, or demand timing. Right before delivery, we run a final evidence pass so clients receive the latest updated view.
Mordor Intelligence's Australia Battery Market Estimate Compared With Other Published Estimates
Published market values for batteries in Australia can look far apart because the scope line is not the same across studies, and because pricing and mix assumptions are not refreshed at the same speed. Differences also show up when one estimate leans heavily toward energy storage projects, while another is more influenced by consumer and replacement batteries.
Battery minerals and upstream materials sit outside Mordor Intelligence's scope, and that single exclusion can reduce the headline value when another publisher bundles mining or cathode and anode supply into the same number. Gaps also come from whether EV traction batteries are counted only as battery packs sold into vehicles, or whether broader system content is included. Variations also reflect how quickly lithium-ion ASP declines are applied when the technology mix shifts.
Benchmark comparison
| Source | Market Size | Gaps in Research Methodology |
|---|---|---|
| Mordor Intelligence | USD 6.11 B (2025) | |
| Regional Consultancy A | USD 9.80 B (2026) | Uses a wider time base and often blends battery storage investment and broader project value into the battery number, which can lift totals relative to a battery-only revenue view. |
| Industry Publisher B | USD 0.00 B (2024) | Reports a much narrower slice that appears closer to a specific battery subset with unit-based sizing, which understates the full Australia battery revenue across automotive, portable, and stationary uses. |
The table shows that most of the spread is explained by what gets counted, and whether the estimate is product revenue only or partially includes adjacent upstream or system value. By keeping the model tied to application-level demand pools, observable price bands, and cross-checks that can be repeated each year, we end up with a practical number that is easier to audit and update.


Key Questions Answered in the Report
What is the current value of the Australia battery market?
The Australia battery market size stood at USD 6.73 billion in 2026 and is projected to reach USD 11.40 billion by 2031.
Which battery segment is growing fastest in Australia?
Lithium-ion technology is expanding the fastest, advancing at a 19.5% CAGR on the back of grid-scale storage and electric-vehicle uptake.
How are state tenders influencing battery demand?
Combined renewable-plus-storage tenders totaling 4.2 GW in 2025 have locked in 15-year revenue contracts, accelerating utility-scale battery installations.
What is the main constraint on local battery manufacturing?
Fragmented, sub-scale assembly plants and limited cathode, anode, and electrolyte production keep Australia reliant on imported components.
How low have lithium-ion battery pack prices fallen?
Average pack prices dipped below the USD 100/kWh threshold in late 2024, widening the economic case for both EVs and stationary storage.
Which state leads in grid-scale battery capacity?
New South Wales leads, underpinned by the 2 GW Waratah Super Battery and multiple expansions at existing generation sites.
Page last updated on:


 Your data is secure and never sold or shared.


