
Market Overview
| Study Period | 2020 - 2031 |
|---|---|
| Forecast Data Period | 2026 - 2031 |
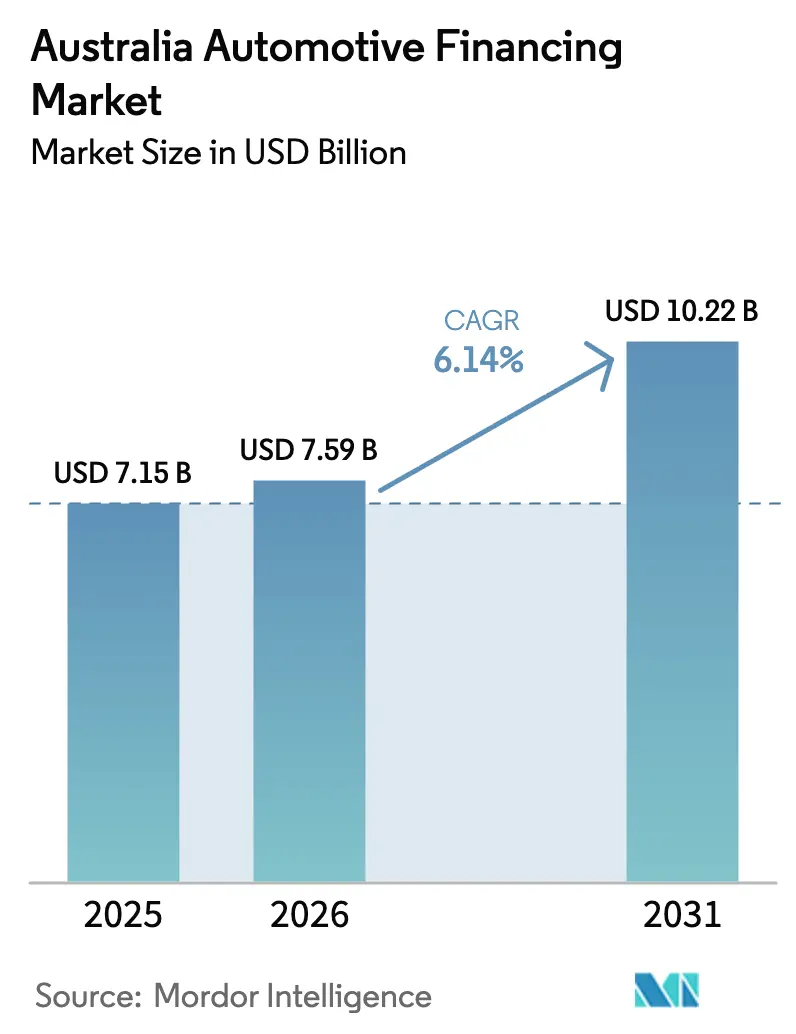
| Base Year Market Size (2025) | USD 7.15 Billion |
| Market Size (2026) | USD 7.59 Billion |
| Market Size (2031) | USD 10.22 Billion |
| Growth Rate (2026 - 2031) | 6.14 % |
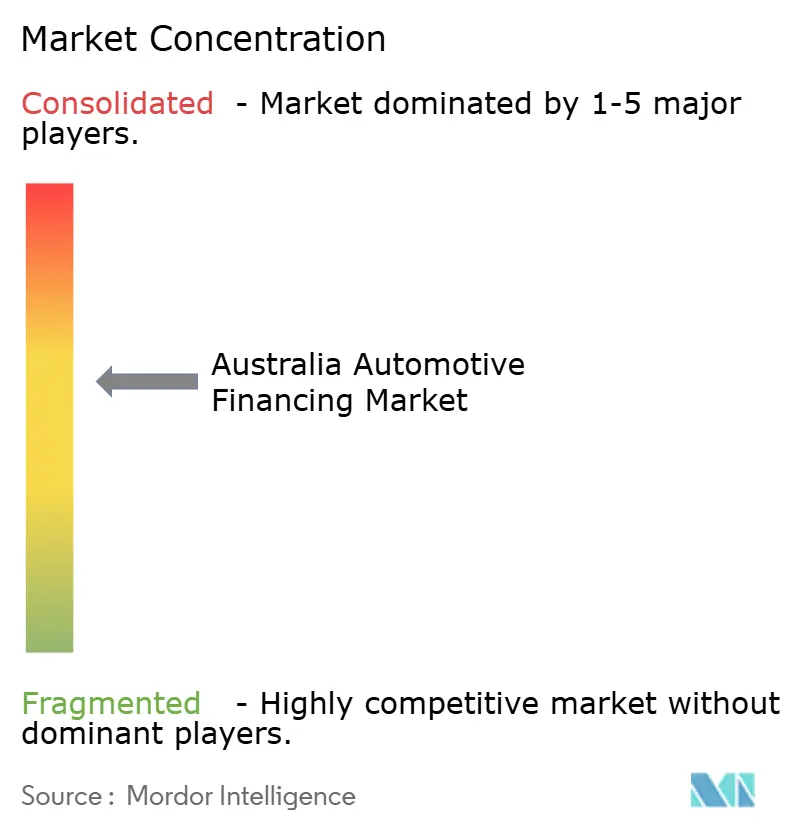
| Market Concentration | Medium |
Major Players *Disclaimer: Major Players sorted in no particular order Image © Mordor Intelligence. Reuse requires attribution under CC BY 4.0. | |
Australia Automotive Financing Market Analysis by Mordor Intelligence
The Australia automotive financing market size is expected to grow from USD 7.15 billion in 2025 to USD 7.59 billion in 2026 and is forecast to reach USD 10.22 billion by 2031 at 6.14% CAGR over 2026-2031. Growth persists despite the Reserve Bank of Australia’s 4.35% cash rate, underpinned by rising electric-vehicle penetration, digital-first lending, and new products such as guaranteed future value loans [1]. Structural shifts include OEM captives scaling embedded finance, fintech-bank partnerships widening credit access, and subscription models meeting demand for flexible mobility. Competitive intensity is rising as banks defend share against OEM captives and specialized non-banks through AI-enabled underwriting and omnichannel origination. Geographic divergence is evident: New South Wales remains volume leader, yet Western Australia posts the fastest gains on mining-driven prosperity. Regulation remains a pivotal force, with ASIC’s ban on flex commissions compressing dealer spreads and open-banking mandates adding compliance costs.
Key Report Takeaways
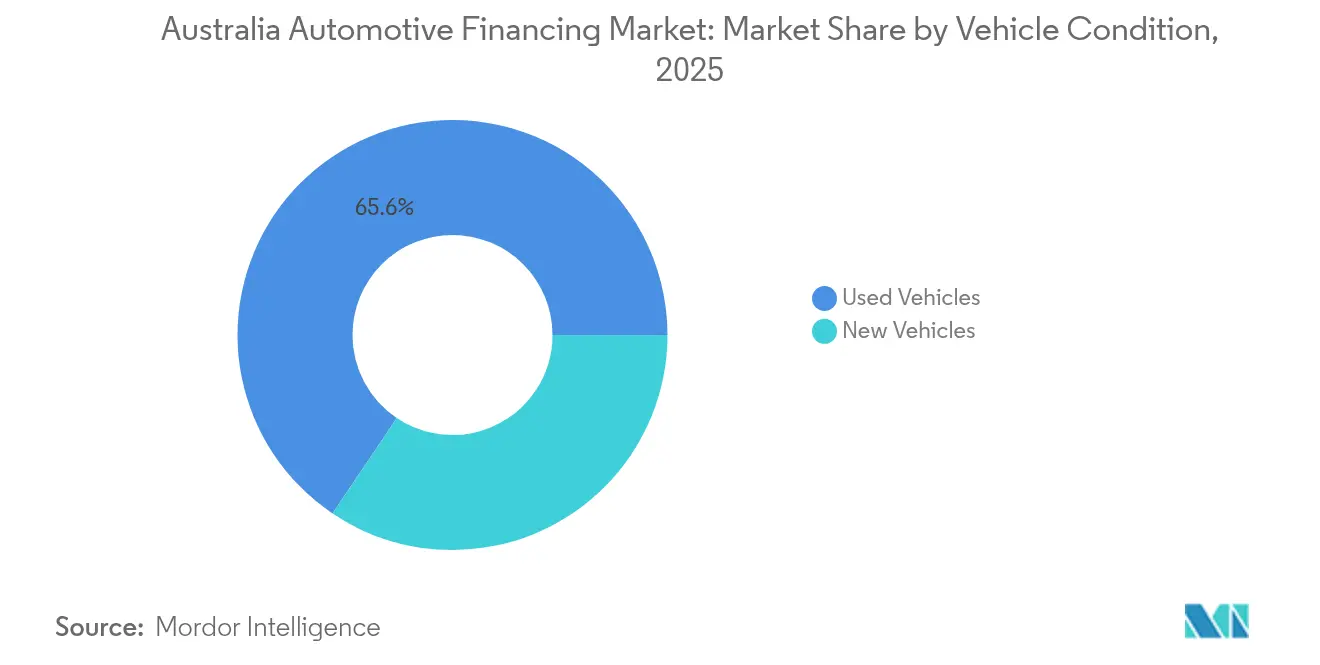
- By vehicle condition, used cars held 65.58% of the Australia automotive financing market share in 2025, whereas new-car loans are projected to advance at a 6.98% CAGR to 2031.
- By financing source, banks led with 53.78% share of the Australia automotive financing market size in 2025, while OEM captive lenders are set to grow fastest at 7.86% CAGR through 2031.
- By financing product, secured auto loans held 48.76% of the Australia automotive financing market share in 2025, whereas subscription and pay-per-use is projected to advance at a 7.28% CAGR to 2031.
- By vehicle type, passenger cars accounted for a 72.63% of the Australia automotive financing market share in 2025 and will grow with a 6.71% CAGR by 2031.
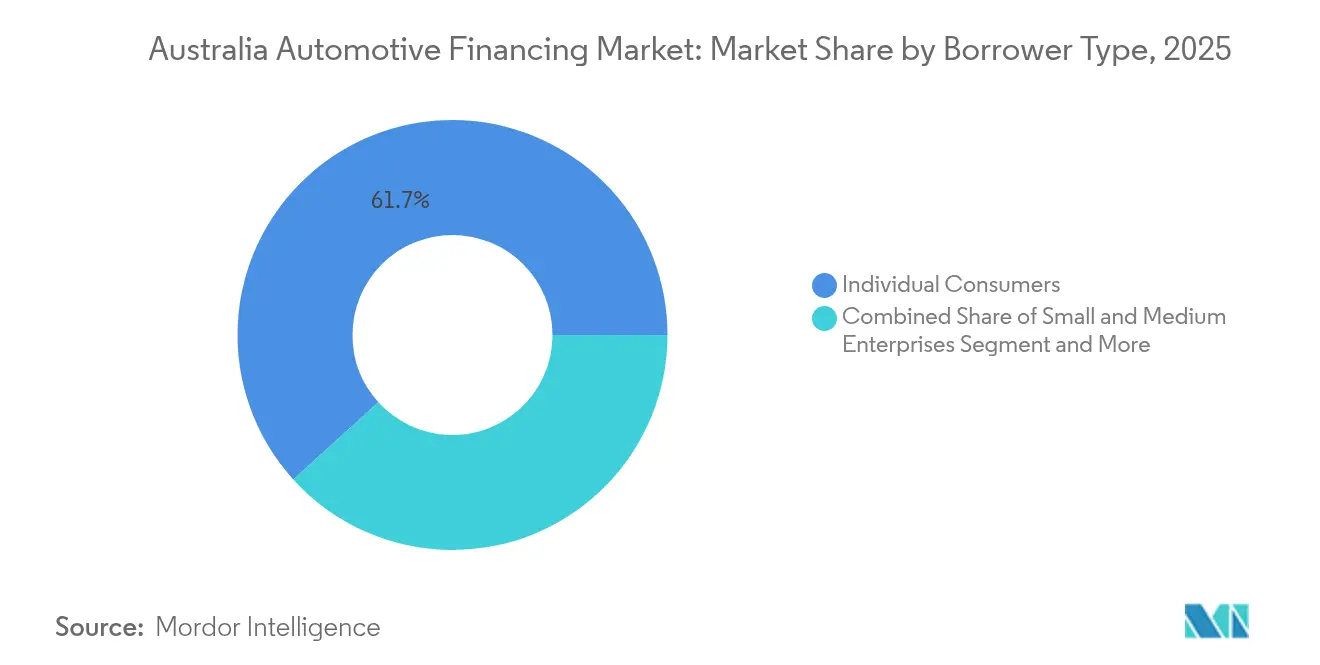
- By borrower type, individual consumers held 61.72% of the Australia automotive financing market in 2025, while small and medium enterprises are expected to grow with an 8.09% CAGR through 2031.
- By channel, dealer-integrated finance captured 56.71% of the Australia automotive financing market in 2025, while direct-to-consumer online model is expected to grow with an 8.52% CAGR through 2031.
- By state/territory, New South Wales captured 34.12% of the Australia automotive financing market in 2025; Western Australia shows the highest projected CAGR at 7.78% to 2031.
Note: Market size and forecast figures in this report are generated using Mordor Intelligence’s proprietary estimation framework, updated with the latest available data and insights as of 2026.
Australia Automotive Financing Market Trends and Insights
Drivers Impact Analysis*
| Driver | (~) % Impact on CAGR Forecast | Geographic Relevance | Impact Timeline |
|---|---|---|---|
| EV and Hybrid Adoption | +1.8% | National, concentrated in ACT, NSW and Victoria | Medium term (2-4 years) |
| Accelerating Digital Loan Origination | +1.2% | National, early adoption in NSW and Victoria | Short term (≤ 2 years) |
| Dealer-led GFV Programs | +1.1% | National, metro uptake | Short term (≤ 2 years) |
| Fintech–Bank Partnerships for Borrowers | +0.9% | National, regional focus | Medium term (2-4 years) |
| Incentives for Subscription and Lease | +0.7% | Urban high-income centers | Long term (≥ 4 years) |
| Residual-Value Insurance and Higher LTVs | +0.5% | Major cities | Long term (≥ 4 years) |
| Source: Mordor Intelligence | |||
Soaring BEV and Hybrid Adoption Supported by EV-specific Loan Products
Battery-electric and hybrid uptake is accelerating loan demand thanks to government rebates, Fringe Benefits Tax exemptions on novated leases, and low-rate green loans from Bank Australia and RACV. July 2025 BEV deliveries rose 7.1% year on year, providing lenders with a segment growing. OEM captives bundle charging credits and insurance, boosting uptake in ACT, New South Wales, and Victoria. As the New Vehicle Efficiency Standard begins in 2025, manufacturers face fleet CO₂ caps that will steer borrowers toward electrified models.
Digital-first Loan Origination and e-KYC Acceleration
Digital-first loan origination and e-KYC compress approval times from days to minutes, resetting consumer expectations nationwide. Pepper Money’s instant offers and Ausloans’ two-minute Zink approvals show how real-time bank feeds, AI credit scoring, and open-banking APIs replace paper statements and manual verifications. Dealers gain higher conversion rates and reduced fall-out, while online portals can fund customers within a browsing session. The efficiency savings lower acquisition cost, widen credit access for regional borrowers, and lift loan volumes despite higher interest rates.
Dealer-led Guaranteed Future Value (GFV) Programs Boosting Affordability
Guaranteed Future Value programs transfer residual-value risk from drivers to lenders, lowering monthly payments and unlocking new-car affordability. The structure generated a significant loan surge as OEM captives, backed by detailed resale data, promote fixed buy-back prices at term-end. Australian Taxation Office minimum residual tables add regulatory clarity, while insurers package coverage that protects lenders against market swings. Uptake is strongest in metro areas where predictable depreciation and high secondary-market liquidity reduce risk premiums for financiers.
Fintech-bank Partnerships Expanding Credit Access to Thin-file Borrowers
Fintech–bank alliances widen credit access for thin-file borrowers by combining real-time bank feeds with alternative data scoring. Plenti’s integration with NAB PayTo enables instant repayments, while Westpac and Rich Data Co deploy AI cash-flow predictions to refine serviceability tests. Marketplace lenders such as SocietyOne still approve only about 11% of applicants, yet their models push incumbents toward inclusive analytics. ASIC’s focus on Indigenous and regional consumers supports this shift, and forthcoming BNPL licensing embeds responsible-lending rules across emerging channels.
Restraints Impact Analysis*
| Restraint | (~) % Impact on CAGR Forecast | Geographic Relevance | Impact Timeline |
|---|---|---|---|
| Interest Rate and Debt Pressure | -1.4% | National; acute in NSW and Victoria | Short term (≤ 2 years) |
| ASIC Cracks Down on Commissions | -0.8% | National | Medium term (2-4 years) |
| Rapid BEV Depreciation Risk | -0.6% | Early-adoption states | Long term (≥ 4 years) |
| Open-Banking Compliance Costs | -0.3% | National; small lenders | Medium term (2-4 years) |
| Source: Mordor Intelligence | |||
Rising Interest-rate Volatility and Household Debt-servicing Pressure
Since May 2022, the Reserve Bank of Australia has lifted the cash rate from 0.10% to 4.35%, pushing the average variable mortgage rate above 6.0% and the average fixed three-year car-loan rate to 8.1%. Treasury modelling indicates that every 100-basis-point rise in mortgage rates cuts household consumption growth by 0.35 percentage points, curbing discretionary outlays such as vehicle upgrades. Economists see a significant recession probability, heightening employment uncertainty and prompting lenders to tighten scorecards and shorten loan terms.
ASIC Clamp-down on Dealer “Flex-commissions” Lowering Margins
The 2018 ban removed mark-ups that once inflated rates, culminating in an AUD 85 million ANZ settlement [2]. The practice’s removal compresses dealer margins, lowering incentives to upsell finance and shifting negotiation power to well-informed borrowers. Some dealers respond by raising vehicle prices or pushing add-on insurance to recover lost profit, but these steps risk greater regulatory scrutiny. Banks and captives must redesign compensation models to keep showroom finance attractive.
*Our forecasts treat driver/restraint impacts as directional, not additive. The impact forecasts reflect baseline growth, mix effects, and variable interactions.
Segment Analysis
By Vehicle Condition: Used-car scale meets new-car EV momentum
Used cars dominated the Australia automotive financing market with a 65.58% share in 2025 as average loan amounts of AUD 28,116 undercut new-car equivalents. Online classifieds integrating escrow payments enhance trust in pre-owned transactions. New-car loans grow at 6.98% CAGR, propelled by EV subsidies and GFV programs lowering monthly outlays. 2024 achieved record sales, which reinforces lender appetite for prime-credit new-car customers.
Digital-first underwriting benefits both segments, yet risk models differ. Used loans face wider condition variance, driving higher provisioning. New-car portfolios gain from warranty coverage and predictable depreciation, especially for OEM-captive paper. ASIC scrutiny remains tighter on second-hand finance to guard vulnerable borrowers.

By Financing Source: Banks anchor, OEM captives climb
Banks held 53.78% of the Australia automotive financing market in 2025, leveraging deposit funding and national branch networks to maintain pricing power. Their Big Four status secures a notable share of banking assets, but OEM captives are expanding at 7.86% CAGR by bundling sub-vented rates, service packages, and GFV guarantees that streamline showroom sales. Customer-owned banks add community-focused competition in loans, growing over time.
Non-bank lenders such as Taurus Auto Finance securitize retail pools to fund AUD 550 million in originations, showing how agile underwriting captures niche cohorts. Portfolio reshuffles—Westpac’s divestiture to Resimac and Macquarie’s sale to Allied Credit—highlight capital-efficiency priorities amid tightening Basel capital buffers. Intensifying competition narrows pricing spreads but widens product choice.
By Financing Product: Secured loans prevail, subscriptions surge
Secured loans accounted for 48.76% of the Australia automotive financing market in 2025, benefiting from vehicle collateral that supports median interest rates and five-year terms. Unsecured personal loans cater to buyers of older vehicles but price in higher credit risk with double-digit rates. Tax-advantaged novated leases flourish for salaried EV buyers under Fringe Benefits Tax exemptions, while GFV structures move residual risk to lenders and fuel a volume spike.
Subscription and pay-per-use models grow 7.28% CAGR, bundling insurance, registration, and maintenance into fixed monthly fees that appeal to urban professionals seeking flexibility. Residual-value insurance enables lenders to stretch loan-to-value ratios, particularly on electric models with uncertain resale curves, without materially elevating capital provisions. Compliance frameworks demand transparent terms to mitigate consumer misunderstanding of balloon obligations .
By Vehicle Type: Passenger cars dominate, LCVs and BEVs follow
Passenger cars retained 72.63% of the Australian automotive financing market in 2025 and are projected to expand at a 6.71% CAGR through 2031 as households prioritize personal mobility and lenders favor predictable depreciation. The Toyota HiLux and Ford Ranger dominate registrations, illustrating the blurred line between passenger and utility use. Light commercial vehicles benefit from instant-asset write-offs that let SMEs depreciate, stimulating fleet renewals. Medium and heavy trucks rely on longer tenors aligned with operational life cycles, requiring specialized underwriting.
Electrification gathers pace in passenger segments, with Tesla Model Y climbing the leader board, whereas commercial EV uptake hinges on payload and range economics. New Vehicle Efficiency Standards starting in 2025 accelerate overall fleet decarbonization and add compliance cost factors to leasing models.
By Propulsion Type: ICE still heavy, BEV grows quickest
Internal-combustion vehicles commanded 74.95% of the Australian automotive financing market in 2025, supported by entrenched refueling infrastructure and lower upfront prices. Battery-electric vehicles, however, show a 8.89% CAGR outlook as charger rollouts and loan discounts narrow cost gaps.
Hybrid sales increased in 2024, providing a transitional pathway. Green loans at 6.95% (Bank Australia) and RACV’s 5.09% offers trim finance expense, while novated-lease FBT relief amplifies paycheck savings. Financing structures reward low-emission borrowers through rate cuts and novated-lease tax breaks. Residual-value uncertainty for BEVs remains a restraint; lenders increasingly price shorter terms and lower balloon residuals. Insurance wrappers offset volatility, sustaining loan appetite even as rapid tech cycles compress depreciation curves.
By Borrower Type: Consumers lead, SMEs accelerate
Individuals comprised 61.72% of the Australian automotive financing market in 2025, with credit scores slightly below the national average yet within prime bands. Household mobility requirements sustain steady demand even amid cost-of-living pressure. Australia's automotive financing market size for SMEs grows 8.09% CAGR as electrified fleets and instant asset write-offs drive uptake. Corporate fleet finance relies on volume rebates and multi-year maintenance packages, often funneled through OEM captives.
Corporate fleet financing emphasizes bulk discounts, operating-lease structures, and total-cost-of-ownership analytics, frequently managed by OEM captives with telematics-based monitoring. Fintech scoring models broaden access for thin-file applicants such as gig-economy drivers, while ASIC oversight safeguards vulnerable cohorts, including Indigenous borrowers, through responsible-lending audits and breach actions. AI-driven income verification accelerates approvals, but lenders still flag higher provisioning for unsecured SME exposures.
By Channel: Dealer finance leads, direct-to-consumer scales
Dealer-integrated finance accounted for 56.71% of the Australian automotive financing market in 2025, leveraging point-of-sale convenience and manufacturer incentives despite ASIC’s flex-commission ban, trimming margins. GFV offers and low-rate captive loans remain persuasive at showrooms, but online direct-to-consumer channels are climbing 8.52% CAGR as digital natives demand transparent pricing and instant decisions.
Brokers aggregate options across 60+ lenders, while Ausloans’ Zink approves in two minutes, illustrating UX as a competitive lever. Open-banking APIs enable real-time income checks, though cybersecurity compliance raises costs for smaller lenders. Marketplace safeguards—such as Carsales–Monoova escrow—boost trust in peer-to-peer deals. As mobile origination apps evolve, lenders blend omnichannel journeys, allowing a borrower to start online, finalize at a dealership, and service the loan via smartphone portals.
Geography Analysis
New South Wales commands 34.12% of the Australia automotive financing market, generating a significant share of loan applications and spearheading EV charging rollouts. New South Wales blends scale and policy support, hosting the largest dealership footprints and concentrated fintech clusters that streamline originations. High urban density favors BEV adoption, and state rebates complement federal incentives. Victoria leverages legacy manufacturing ecosystems and charging corridors along the Melbourne-Sydney route. Queensland benefits from population inflows and tourism, which sustain light-commercial lending.
Western Australia records the fastest CAGR at 7.78%, fueled by mining wealth and infrastructure upgrades. Western Australia’s commodity-backed prosperity buffers cyclical downturns and lifts disposable incomes, with Pilbara infrastructure projects necessitating high-value utility vehicles. South Australia, Tasmania, and the ACT are smaller in volume yet punch above their weight in EV adoption and novated-lease penetration. Northern Territory’s sparse population skews toward larger 4×4 loans, while Tasmania’s lower average loan size signals heightened price sensitivity.
Cross-state regulatory harmony under ASIC ensures uniform consumer safeguards, though varying stamp-duty concessions and registration discounts add complexity to loan pricing. Charging-infrastructure rollout, especially in highway corridors, remains a determinant of BEV loan growth trajectories.
Regulatory Landscape
Australia automotive finance sits primarily under the National Consumer Credit Protection Act 2009 (National Credit Act), with product governance reinforced by Design and Distribution Obligations (DDO) in the Corporations Act 2001. Oversight is shared across ASIC (consumer credit conduct, distribution and disclosure), APRA (prudential supervision of deposit-taking lenders), and the ACCC (competition and consumer protections). In June 2026, ASIC published Report 832 (Lifting the bonnet: ASIC's review of car loans), which increases scrutiny of dealer and broker distribution models and flags concerns around fees and point-of-sale transparency, raising monitoring requirements for third-party channels.
Industry standard-setting is tightening in parallel with regulator focus. The Australian Finance Industry Association (AFIA) Finance Industry Code of Practice is scheduled to take effect on 1 October 2026 and will be monitored by the Finance Industry Code Compliance Committee (FICCC), pushing participants to lift conduct standards, including around disclosure and customer outcomes. Separately, Treasury has progressed an exposure draft for National Consumer Credit Protection Amendment (Low Cost Credit) Regulations 2025, targeting fee structures relevant to credit products, which adds compliance workstreams for lenders and intermediaries.
Value Chain Analysis
The automotive financing value chain in Australia starts with funding and risk capacity at credit providers (banks, OEM captive finance arms, credit unions and mutuals, and non-bank lenders), then moves through origination and distribution via car dealers, brokers, and aggregator platforms, before ending in loan and lease servicing and collections across retail consumers, SMEs, and fleet customers. OEM captives such as Toyota Finance Australia integrate financing into the vehicle purchase journey and support national operations through centralized customer service functions, while aggregator groups such as COG Financial Services Limited sit between lenders and brokers or dealers to expand product access and streamline submission flows.
Friction is concentrated at the distribution layer, where fees, incentives, and disclosure practices shape customer outcomes and lender risk. ASIC's June 2026 Report 832 elevated attention on third-party distributors (including brokers and car dealers) and the transparency of point-of-sale costs, leading lenders to strengthen oversight, auditing, and governance across dealer-integrated finance and broker channels. As a result, compliance, monitoring, and data capture increasingly sit alongside underwriting, documentation, and settlement.
Competitive Landscape
The Australia automotive financing market exhibits moderate concentration. Banks guard incumbency with funding cost advantages and brand trust, yet OEM captives exploit bundled offerings and superior residual-value insights. Non-bank lenders and fintechs differentiate through speed and user experience; Pepper Money’s instant approvals and Taurus Auto Finance’s securitized funding spotlight these advantages.
Regulatory shifts spur strategic recalibration. Westpac exited direct auto lending via a AUD 1.5 billion book sale to Resimac in March 2025, redeploying capital toward core segments. Macquarie’s offload of vehicle loans to Allied Credit in July 2025 underscores an asset-light trend among banks. Technology remains the defining competitive weapon: AI and open-banking data streams lower default rates and unlock underserved niches, while cybersecurity spend rises to protect real-time APIs.
Emergent models include subscription finance and GFV residual insurance, offering annuity-style revenue that offsets margin compression from rate competition. Partnerships—such as NAB’s PayTo integration with Plenti—demonstrate symbiotic bank-fintech plays that expand market coverage without bloating balance sheets.
Australia Automotive Financing Industry Leaders
-
Toyota Finance Australia
-
ANZ Banking Group
-
National Australia Bank (NAB)
-
Macquarie Leasing & Asset Finance
-
Commonwealth Bank (CommBank)
- *Disclaimer: Major Players sorted in no particular order
Market Opportunities and Future Outlook
A near-term opportunity exists in distributor-governed, compliance-forward origination models as lenders respond to ASIC's June 2026 motor finance findings. Report 832's focus on fees and distribution practices creates whitespace for lenders that can evidence stronger dealer and broker oversight (training, monitoring, and product governance under DDO), while redesigning pricing and fee disclosures to reduce point-of-sale friction. This aligns with AFIAs Finance Industry Code of Practice taking effect on 1 October 2026, which accelerates industry onboarding to tighter conduct standards and gives lenders and intermediaries a clearer basis to differentiate on customer outcomes.
There is also scope to scale partnership-led, embedded finance models where they demonstrably widen access and improve customer experience without increasing conduct risk. The NAB PayTo integration with Plenti (as noted in the report context) illustrates how bank-fintech collaboration can support faster repayments and digital journeys, while open-banking-enabled income verification underpins shorter approval cycles in direct-to-consumer online and broker channels. Another area for opportunity is EV and hybrid product design, including novated lease structures supported by Fringe Benefits Tax exemptions, along with residual-value management tools used in GFV and balloon-payment finance, where transparent terms and stronger suitability checks help address regulatory attention on consumer understanding and affordability.
Recent Industry Developments
- May 2026: NAB powered by Plenti car loan portfolio grew to $121 million during the 2026 financial year. The expansion underscores the growing role of non-bank and fintech partnerships in embedded automotive financing, expanding access and scale.
- April 2026: ANZ Banking Group reported March 2026 transport lending under the Good Energy Home Loan increased by about 67% due to EV and hybrid vehicle demand. The move signals open banking enabled green lending momentum and highlights regulatory risk exposure for energy-efficient financing.
- April 2026: Toyota Finance Australia completed issuance of EUR 50 million Floating Rate Notes due 24 May 2027. The capital markets funding strengthens liquidity for auto finance and supports broader EV transition financing.
Research Methodology Framework and Report Scope
Market Definition and Coverage
This market covers financing tied to buying or using a motor vehicle in Australia, including common loan and lease style products arranged through banks, captives, non-banks, dealers, and digital channels, and measured in value (USD).
Scope exclusions: We exclude insurance premiums, dealer service packages, and pure aftersales subscriptions that are not bundled into a financing contract.
Segmentation Overview
- By Vehicle Condition
- New Vehicles
- Used Vehicles
- By Financing Source
- Banks
- OEM Captive Finance
- Credit Unions and Mutuals
- Non-bank Lenders and Fintechs
- By Financing Product
- Secured Auto Loans
- Unsecured Personal Loans
- Lease and Novated Lease
- GFV / Balloon-Payment Finance
- Subscription and Pay-per-use
- By Vehicle Type
- Passenger Cars
- Light Commercial Vehicles
- Medium and Heavy Commercial Vehicles
- By Propulsion Type
- Internal-Combustion Engine (ICE)
- Hybrid Electric Vehicle (HEV)
- Battery Electric Vehicle (BEV)
- By Borrower Type
- Individual Consumers
- Small and Medium Enterprises
- Corporate and Fleet
- By Channel
- Dealer-integrated Finance
- Direct-to-Consumer Online
- Broker and Aggregator Platforms
- By State / Territory
- New South Wales
- Victoria
- Queensland
- Western Australia
- South Australia
- Tasmania
- Australian Capital Territory
- Northern Territory
Data Sources, Market Sizing, and Validation
Desk Research
We started with public statistics that explain how many vehicles are entering the demand pool and how credit conditions are moving over time. Typical inputs came from sources such as the Australian Bureau of Statistics for household and vehicle related indicators, the Reserve Bank of Australia for rate and credit context, and ASIC publications for consumer credit and commission related rules.
To keep the model grounded in real transaction behavior, we also reviewed sources such as FCAI and state registration bodies for sales and parc direction, and APRA releases for lender system signals where relevant. Company annual reports, investor presentations, and reputable business press were used to map product mix and channel shifts, and then paid subscriptions for company financials, news and financials, and patent databases were used selectively to fill gaps on lender positioning and product features. These desk sources are not exhaustive, and many other public and paid references were used to collect data, validate assumptions, and clarify open questions.
Primary Interviews and Surveys
We validated desk assumptions through expert interviews and surveys with lenders, dealer channel participants, brokers, and fleet focused decision-makers across Australia, so pricing, approval behavior, and product mix could be tested against what is happening now. Inputs were checked across major states and territories, and we re-contacted sources when a variable moved sharply (for example, interest rate resets or EV incentive changes) so the sizing logic stayed realistic.
Distribution of primary research fieldwork respondents
| Company type | Respondent position |
|---|---|
| Top tier: 29% | CXOs: 14% |
| Mid tier: 56% | Functional/Unit leaders: 35% |
| Smaller Players: 15% | Managers: 51% |
Market-Sizing & Forecasting
Sizing used a top-down and bottom-up flow, where national vehicle purchase activity and financing penetration were used to reconstruct the annual financed value pool, and then the outputs were checked using selective supplier and channel roll-ups. In practice, we mapped new versus used vehicle turnover, the share financed (by channel), and the split across loans versus lease style products, which are then converted into value using representative ticket sizes and pricing behavior.
Key model inputs included light vehicle sales and registrations, consumer credit conditions and policy rate direction, average loan tenors and residual assumptions used in balloon and lease structures, the mix shift toward EVs and hybrids, and channel mix between dealer-arranged, broker-led, and direct-to-lender origination. Where direct visibility was limited (for example, small non-bank volumes), we used gap-handling through sampling, proxy penetration rates, and consistency checks against credit supply signals from public filings.
Forecasts were built using scenario analysis supported by short series smoothing, because rate paths, affordability, and vehicle supply normalize in steps rather than in a straight line. Final growth paths were aligned to primary feedback on underwriting tightness, expected shifts in used vehicle pricing, and the pace of digital origination adoption.
Data Validation & Update Cycle
We run a multi-step validation where outputs are compared with independent signals, such as vehicle sales direction, reported portfolio commentary, and credit condition changes, and then the largest variances are reviewed by another analyst before sign-off. When an assumption creates an unusual jump, it is traced back to its driver (like a penetration change or ticket-size swing) and corrected or justified with fresh inputs.
Reports are refreshed annually, and interim updates are triggered when material events occur, such as sharp rate moves, major regulatory changes, or sudden supply shifts that can alter loan mix. Before delivery, an analyst performs a final pass to ensure the latest public releases and new primary checks are reflected, so clients receive an up-to-date view.
Mordor Intelligence's Australia Automotive Financing Market Size Measured Against Other Published Estimates
Published market sizes for automotive financing in Australia can look far apart because different studies do not always measure the same thing, even when the titles sound similar. In many cases, the gap comes from whether the number represents annual new financing written, an outstanding loan book, or a narrower slice such as used-only lending.
The benchmark table shows a wide spread that mainly tracks scope choices, currency timing, and how products like novated leases and balloon structures are treated. Some estimates lean on broad credit aggregates, which can accidentally pull in non-vehicle secured lending or mix originations with balances, and then growth can be overstated or muted depending on the base chosen and how rate-driven ticket sizes are updated.
Benchmark comparison
| Source | Market Size | Gaps in Research Methodology |
|---|---|---|
| Mordor Intelligence | USD 7.15 B (2025) | |
| Industry Association A | USD 12.80 B (2024) | Appears to align more with outstanding auto loan and lease balances rather than annual new financing value, so the figure can be structurally higher even with similar vehicle sales. |
| Regional Consultancy B | USD 6.40 B (2025) | Often excludes lease style products (including novated arrangements) and uses conservative ticket-size progression, which can undercount higher-priced vehicle mix shifts. |
The table points to product and measurement choices as the biggest drivers, and under Mordor Intelligence's scope the market is modeled as annual financing value tied to vehicle transactions in Australia, with product mix and ticket sizes refreshed against current credit conditions. With that structure, the estimate stays traceable to vehicle activity, penetration, and pricing inputs that can be rechecked and updated in a repeatable way.
Key Questions Answered in the Report
What is the projected size of the Australia automotive financing market by 2031?
The Australia automotive financing market size is forecast to reach USD 10.22 billion by 2031, supported by a 6.14% CAGR.
Which vehicle condition segment currently leads loan volumes?
Used-car financing commands 65.58% of total volume, driven by affordability advantages over new-car purchases.
Why are OEM captive finance companies growing faster than banks?
OEM captives bundle low-rate loans with vehicles and leverage superior residual-value data, enabling an 7.86% CAGR through 2031.
Which Australian state is expected to post the fastest financing growth?
Western Australia is projected to expand at 7.78% CAGR, buoyed by mining-driven income growth and vehicle replacement demand.