
Market Overview
| Study Period | 2021 - 2031 |
|---|---|
| Forecast Data Period | 2026 - 2031 |
| Base Year Market Size (2025) | USD 8.10 Billion |
| Market Size (2026) | USD 8.39 Billion |
| Market Size (2031) | USD 9.97 Billion |
| Growth Rate (2026 - 2031) | 3.52 % |
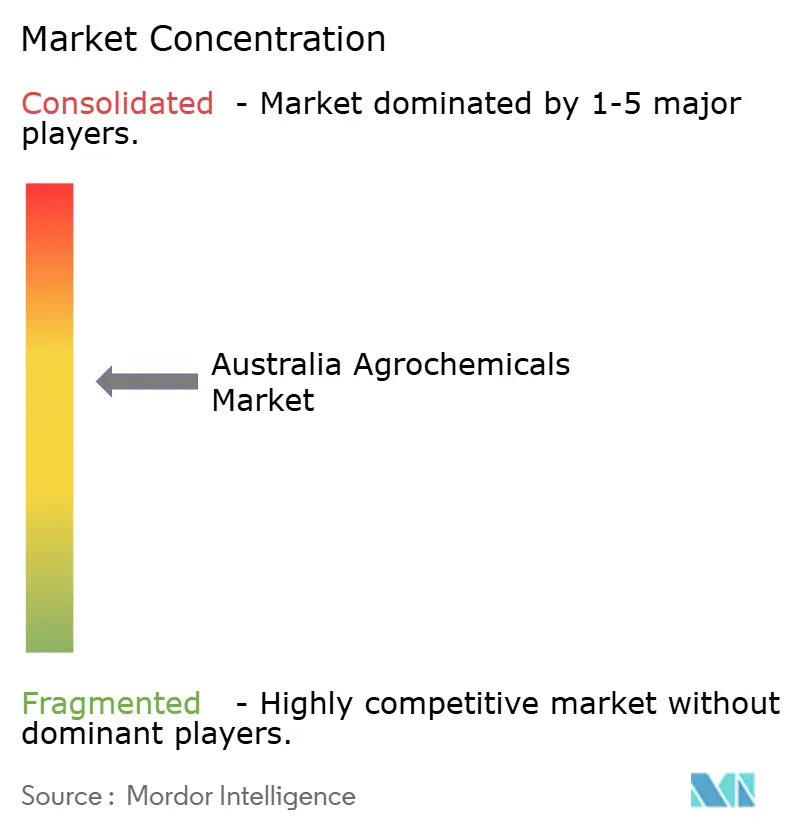
| Market Concentration | Medium |
Major Players *Disclaimer: Major Players sorted in no particular order Image © Mordor Intelligence. Reuse requires attribution under CC BY 4.0. | |
Australia Agrochemicals Market Analysis by Mordor Intelligence
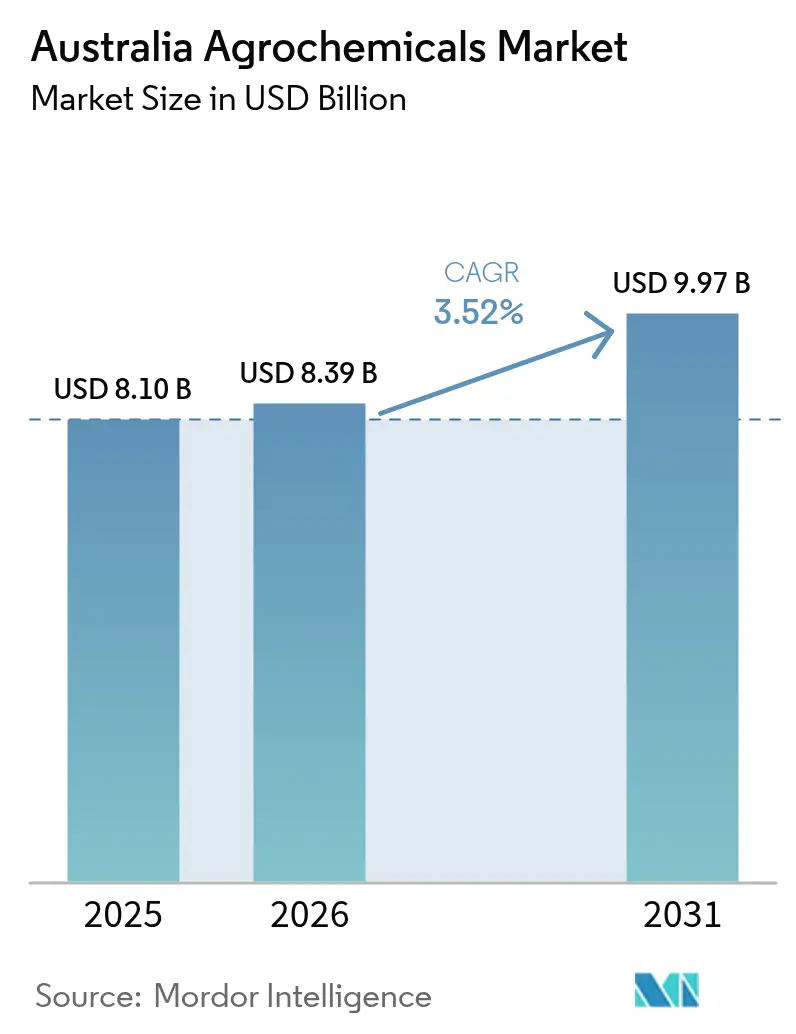
Australia agrochemicals market size in 2026 is estimated at USD 8.39 billion, growing from 2025 value of USD 8.10 billion with 2031 projections showing USD 9.97 billion, growing at 3.52% CAGR over 2026-2031. Growing broadacre cropping in the Northern Territory, nationwide pressure to manage herbicide resistance, and a policy push for precision spraying technologies together sustain steady demand even as input cost volatility tempers spending plans. Investment in controlled-release fertilizers and the rising adoption of genetically modified herbicide-tolerant crops strengthen commercial confidence, while stricter review timelines at the Australian Pesticides and Veterinary Medicines Authority (APVMA) slow the entry of new chemistries. The Australian government's USD 53 million On Farm Connectivity Program supports precision agriculture adoption by offering up to 50% rebates for digital farming technologies. These technologies enable targeted chemical application and reduce environmental impact. The program, along with increased pest pressure due to climate variability in drought-affected regions of southern Australia, drives demand for crop protection solutions that meet both efficacy and environmental requirements. Market opportunities increasingly favor suppliers that pair crop-specific products with digital platforms capable of cutting chemical volumes by up to 96% without sacrificing yield.
Key Report Takeaways
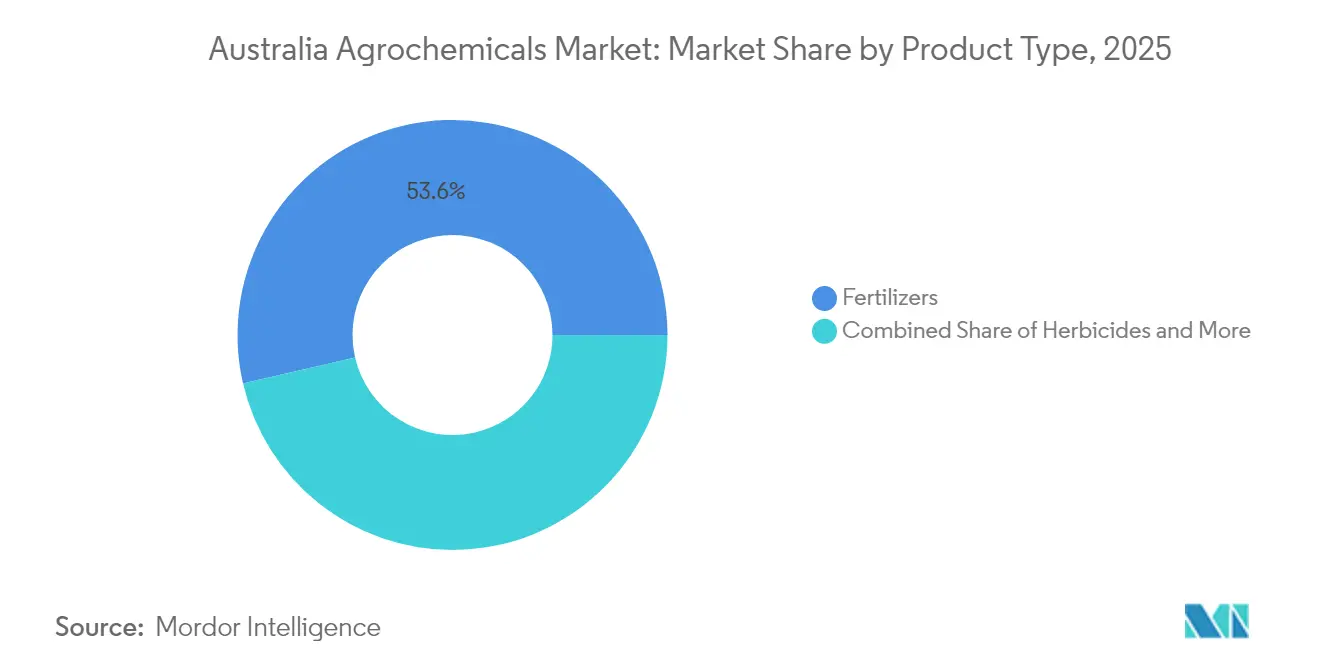
- By product category, fertilizers led with 53.62% of the Australia agrochemicals market share in 2025, while adjuvants posted the fastest growth with a 7.31% CAGR through 2031.
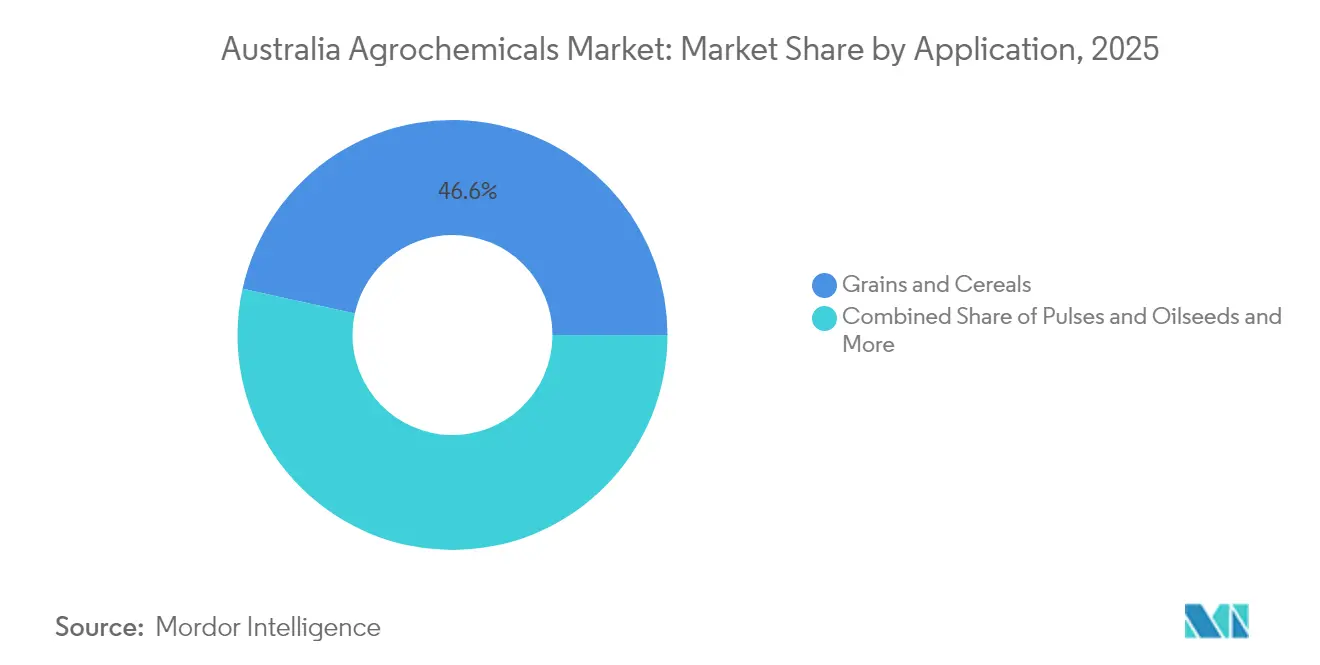
- By application, grains and cereals captured 46.55% of the Australia agrochemicals market size in 2025, while fruits and vegetables applications are advancing at a 6.55% CAGR through 2031.
Note: Market size and forecast figures in this report are generated using Mordor Intelligence’s proprietary estimation framework, updated with the latest available data and insights as of 2026.
Australia Agrochemicals Market Trends and Insights
Drivers Impact Analysis*
| Driver | (~) % Impact on CAGR Forecast | Geographic Relevance | Impact Timeline |
|---|---|---|---|
| Synthetic herbicide-resistance management pressure | +0.8% | National, concentrated in Western Australia and New South Wales | Medium term (2-4 years) |
| Expansion of the broadacre cropping area in the Northern Territory | +0.6% | Northern Territory, spillover to Queensland | Long term (≥ 4 years) |
| Government rebates for precision spraying technologies | +0.4% | National, early adoption in Victoria, and South Australia | Short term (≤ 2 years) |
| Rising adoption of genetically modified herbicide-tolerant crops | +0.5% | National, excluding Western Australia and South Australia moratoria | Medium term (2-4 years) |
| Climate variability increasing pest infestation cycles | +0.7% | Southern Australia, Victoria and South Australia drought zones | Short term (≤ 2 years) |
| Investment in controlled-release fertilizer technologies | +0.3% | National, concentrated in high-value horticulture regions | Long term (≥ 4 years) |
| Source: Mordor Intelligence | |||
Synthetic herbicide-resistance management pressure
Australia records 154 confirmed herbicide-resistance cases, far exceeding neighboring countries, largely due to ryegrass infestation across 18 million hectares. Grower programs now combine new Group 14 herbicides, mechanical weed seed destruction, and AI-guided spot spraying to keep fields productive. Agrochemical companies capable of supplying novel modes of action while also providing digital scouting tools command premium pricing, because integrated programs lift control success and counteract escalating resistance costs. The APVMA’s emphasis on resistance stewardship elevates compliance barriers, giving incumbents with strong regulatory teams a clear edge.
Expansion of the broadacre cropping area in the Northern Territory
The Douglas Daly Stage Two plan targets an extra 60,000 hectares for irrigated and dryland crops, with cotton acreage set to rise from 90 hectares in 2024 to more than 35,000 hectares by 2029. New cotton systems require specialized herbicides that tolerate tropical humidity and soil types. Suppliers that establish extension services in the Territory benefit from early supplier lock-in as infrastructure spending of USD 1.6 billion channels inputs through dedicated hubs.
Government rebates for precision spraying technologies
The USD 53 million On-Farm Connectivity Program funds half the purchase cost of eligible digital hardware, leading more than 1,500 producers to adopt green-on-green spot sprayers and wireless weather stations in 2024.[1] Demonstrated chemical savings and fast payback make rebate-assisted technology a near-mandatory upgrade, and suppliers bundling agronomy support with equipment gain rapid scale. As round-three grants roll out through 2025, the customer base for variable-rate herbicides and tailored adjuvant packs will broaden quickly.
Climate variability increasing pest infestation cycles
Southern drought stress shortens pest generation intervals, forcing growers to spray more frequently to protect yields. Pasture dieback driven by mealybugs already costs livestock producers more than USD 2 billion, highlighting the need for fast-acting insecticides. Seasonal forecasting tools funded by the Future Drought Fund help schedule sprays precisely, which raises demand for data-enabled crop protection subscription models that merge weather insight with product supply.
Restraints Impact Analysis*
| Restraint | (~) % Impact on CAGR Forecast | Geographic Relevance | Impact Timeline |
|---|---|---|---|
| Stricter APVMA reevaluation of endocrine-disrupting chemistries | -0.5% | National, affecting all agricultural sectors | Medium term (2-4 years) |
| Increasing farm input cost inflation linked to ammonia prices | -0.4% | National, concentrated in grain production regions | Short term (≤ 2 years) |
| Growing retailer preference for organic-labeled produce | -0.3% | National, strongest in urban supply chains | Long term (≥ 4 years) |
| Supply disruptions of key technical-grade actives | -0.2% | National, import-dependent regions most affected | Short term (≤ 2 years) |
| Source: Mordor Intelligence | |||
Stricter APVMA reevaluation of endocrine-disrupting chemistries
The APVMA canceled chlorthal dimethyl products in October 2024 and extended paraquat reviews into late 2025, creating uncertainty that delays product launches and triggers reformulation costs. Multinationals with large regulatory budgets can navigate the changes, while smaller firms risk exit. Longer reviews also impede the rapid deployment of new resistance-breaking chemistries, potentially leaving growers without effective options.
Increasing farm input cost inflation linked to ammonia prices
Domestic granular urea prices in Australia reached AUD 865/ metric ton (USD 590/ metric ton) Free Carrier (FCA) Price in Geelong in the week ending June 20, marking an increase from AUD 745-750/ metric ton (USD 508-512/ metric ton) in 15 June 2025, as heightened buying activity from retailers actively securing supplies amid concerns over potential further price increases drove the surge.[2] Orica’s potential closure of the Newcastle ammonia plant increases import reliance, exposing farmers to exchange-rate fluctuations. Australia Vegetable Growers March 2025 pricing update reflects ongoing input cost challenges affecting vegetable producers' profitability and investment capacity for advanced crop protection technologies.
*Our forecasts treat driver/restraint impacts as directional, not additive. The impact forecasts reflect baseline growth, mix effects, and variable interactions.
Segment Analysis
By Product Type: Fertilizers Dominate Amid Import Dependency
Fertilizers captured 53.62% of the Australia agrochemicals market share in 2025 as complete reliance on imported urea inflated purchase volumes following Incitec Pivot Pty Ltd’s plant closure. Urea imports reached 768,800 metric tons in June 2024, 66% higher than the previous year. This intensity cements nitrogenous fertilizers at the core of the Australia agrochemicals market. Controlled-release coatings improve nutrient use efficiency, aligning with retailer sustainability demands and helping growers manage cost spikes. Phosphatic demand tracks grain acreage expansion, while potassic fertilizers gain from Western Australian potash mines that ease logistic costs. Precision soil testing prompts greater uptake of micronutrient blends, creating premium niches for customized formulations.
Pesticides remain the second-largest category. Herbicides account for most value because resistance pressures necessitate multiple modes of action and AI-guided spot spraying. The use of insecticides in cotton has decreased due to Bollgard 3 traits, which eliminate almost all broad-spectrum applications. Fungicide demand stays stable across cereals and horticulture, especially as wetter seasons return in eastern states. Adjuvants are the fastest-growing subsegment at 7.31% CAGR through 2031, fueled by precision sprayers that require specialized surfactants and drift inhibitors. Plant growth regulators have moderate but profitable adoption rates in horticulture, as fruit size and color significantly influence retail prices.

By Application: Grains Lead, Horticulture Accelerates
Grains and cereals account for 46.55% of 2025 consumption, reflecting the scale of wheat and barley exported from New South Wales, Victoria, and Western Australia. The Australia agrochemicals market size for grains is projected to expand steadily as Northern Territory cotton plantings move toward 35,000 hectares by 2029, pulling demand for defoliants, herbicides, and foliar fertilizers suited to tropical agronomy. Pulses and oilseeds maintain solid demand, particularly canola, where herbicide-tolerant traits call for companion chemistries that minimize volunteer persistence.
Fruits and vegetables deliver the highest growth at 6.55% CAGR through 2031 amid consumer pivot toward fresh and organic produce. Tasmania’s USD 10 billion (USD 7.0 billion) farm-gate ambition by 2050 relies on intensive horticulture enabled by smart irrigation and variable-rate fertigation systems. Commercial crops, chiefly cotton and sugarcane, remain heavy users of crop protection given their high gross margins. Pasture systems struggle with dieback, spurring research into integrated pest management tools rather than standard insecticides.
Geography Analysis
Demand in New South Wales and Victoria remains strong because growers rely on full-season crop protection programs to secure export-grade grain quality. Both regions show early adoption of AI-guided sprayers and controlled-release fertilizers that help manage rising input costs and stricter residue rules. The states’ proximity to major ports also reduces freight expense, allowing retailers to hold wider product ranges and replenish stocks quickly. Ongoing government incentives for connectivity upgrades improve data flow between growers and suppliers, supporting broader use of variable-rate application tools.
Western Australia ranks next in overall purchases, even as multi-year drought challenges yield potential and heighten pest pressure across its grain belt. Local debate over aerial spraying regulations encourages uptake of drift-reduction adjuvants and optical sensors that keep chemicals on target while satisfying community expectations. Queensland follows with a diversified cropping mix of cotton, sugarcane, and horticulture that drives year-round demand for insecticides, herbicides, and micronutrient blends. Expanding sugar exports also spur fertilizer sales because cane yields respond strongly to optimized nitrogen programs.
The Northern Territory's tropical climate enables multiple crop rotations throughout the year, allowing early-positioned suppliers to benefit from consistent sales of herbicides, adjuvants, and foliar fertilizers. Private investment in storage and processing infrastructure cuts logistics costs and accelerates product adoption in remote districts. South Australia and Tasmania remain smaller in volume yet strategically important because they serve premium wine grapes, apples, and high-value vegetables that require precise inputs and low residue thresholds.
Regulatory Landscape
Australia regulates agricultural and veterinary (agvet) chemicals under the National Registration Scheme. The Australian Pesticides and Veterinary Medicines Authority (APVMA) handles product registration and approvals up to the point of retail sale, while control-of-use requirements (including application conditions and use restrictions) are administered by state and territory authorities. This split keeps label compliance and stewardship programs central for suppliers operating nationally.
Recent policy and administrative actions have tightened the compliance environment around residues and safety while also pursuing process improvements. APVMA actions referenced in the report context include the cancellation of chlorthal dimethyl products (October 2024) and the continuation of paraquat review activity into late 2025, which can delay portfolio launches and reformulation timelines. At the same time, APVMA continued updating Maximum Residue Levels (MRLs) through Gazette instruments, including the May 2025 amendments referenced in the report, keeping market access and retailer residue specifications linked to ongoing regulatory updates.
Competitive Landscape
The competitive field is moderately concentrated, with the top five suppliers controlling a little over 60% of Australia agrochemicals market share through 2025. Nufarm leverages domestic manufacturing flexibility and an extensive rural retail network to defend core positions in herbicides and insecticides despite pressure from offshore generics. Bayer AG, Syngenta Group, and BASF SE rely on global discovery pipelines to introduce resistance-breaking active ingredients that meet the APVMA’s evolving safety standards. Nutrien and Yara International ASA reinforce their chemical catalogs with strong fertilizer footprints, letting them bundle crop nutrition and protection for large broadacre clients.
Strategy is shifting from simple price competition toward integrated agronomic support and digital enablement. BASF SE partnered with National Rural Independents in early 2024 to train twenty-two young agronomists who now promote its AI-ready Liberty ULTRA herbicide platform in cotton and canola systems. Syngenta Group’s sustained engagement during the paraquat and diquat reviews illustrates the value of experienced regulatory teams that help growers retain critical tools under stricter stewardship requirements. Bayer AG expands Climate FieldView coverage in New South Wales and Victoria, linking satellite imagery with prescription maps that cut chemical volumes while maintaining efficacy. Nufarm accelerates development of controlled-release formulations to capture value in the fast-growing adjuvant and specialty fertilizer niches.
Smaller innovators focus on narrow technology gaps that multinationals overlook. Local start-ups supply polymer coatings that regulate nutrient release in variable soil moisture. Imports of active ingredients remain vulnerable to Asian supply disruptions, so distributors hedge by carrying higher inventories and sourcing from secondary manufacturers in Saudi Arabia and the United Arab Emirates. Overall, companies able to combine strong regulatory compliance, digital agronomy services, and sustainable product portfolios are positioned to capture incremental share as the market continues its measured expansion.
Australia Agrochemicals Industry Leaders
-
Nufarm
-
Bayer AG
-
Incitec Pivot Pty Ltd
-
Nutrien
-
Yara International ASA
- *Disclaimer: Major Players sorted in no particular order
Market Opportunities and Future Outlook
In Australia, opportunities are concentrating on suppliers that combine chemistry with measurable reductions in applied volume and clearer stewardship outcomes as growers and retailers face tighter residue scrutiny and escalating herbicide-resistance management needs. The Australian Government's USD 53 million On-Farm Connectivity Program, offering rebates of up to 50% for eligible digital farming technologies, has supported adoption of connected spraying and sensing systems. The report also notes that more than 1,500 producers adopted spot sprayers and wireless weather stations in 2024, which supports demand for variable-rate compatible herbicides, drift-reduction adjuvants, and crop-specific packs designed to align with prescription maps and AI-guided spot spraying.
A second opportunity comes from shifting production geographies and managing tighter input supply. The Northern Territory's Douglas Daly Stage Two plan targets an additional 60,000 hectares for irrigated and dryland crops, requiring crop protection and nutrition programs adapted to tropical agronomy and new cotton systems. In parallel, reliance on imported nitrogen and urea price volatility sustains demand for efficiency-focused nutrition, including controlled-release fertilizers and tailored micronutrient blends, that reduce loss and improve nutrient use efficiency amid sustainability requirements and tighter budgeting by growers.
Recent Industry Developments
- July 2026: Bayer announced a partnership with Polybee to deploy AI-powered crop intelligence for Australian vegetable growers. The collaboration strengthens decision-support and targeted intervention capabilities, aligning crop protection programs with data-driven scouting and application practices in high-value horticulture.
- April 2026: Incitec Pivot Fertilisers entered a supply agreement with PT Pupuk Indonesia for 250,000 tonnes of agricultural grade urea, supported by an Australian Government-facilitated deal. The additional contracted volume addresses import dependence and improves supply continuity for growers and retailers during periods of global supply disruption.
- May 2024: BASF SE launched Cimegra insecticide in Australia, featuring broflanilide as the active ingredient. The launch expanded options for longer-lasting insect control across multiple crops, supporting rotation strategies and performance requirements under tightening stewardship expectations.
Research Methodology Framework and Report Scope
Market Definition and Coverage
This methodology defines the Australia agrochemicals market as the value of farm-applied crop input chemicals sold for nutrition and crop protection, including fertilizers, pesticides, adjuvants, and plant growth regulators, across major crop groups in Australia.
Scope exclusions: This sizing excludes non-agricultural turf and ornamental uses, farm equipment, and downstream food processing activities.
Segmentation Overview
- By Product Type
- Fertilizers
- Nitrogenous
- Phosphatic
- Potassic
- Other Fertilizers
- Pesticides
- Herbicides
- Insecticides
- Fungicides
- Other Pesticides
- Adjuvants
- Plant Growth Regulators
- Fertilizers
- By Application
- Grains and Cereals
- Pulses and Oilseeds
- Fruits and Vegetables
- Commercial Crops
- Other Applications
Data Sources, Market Sizing, and Validation
Desk Research
Desk research was used to set the outer guardrails for demand and pricing, then to check whether the model outputs match observable activity in Australian cropping. We referenced public sources such as the Australian Bureau of Statistics for agriculture and trade series, the Australian Pesticides and Veterinary Medicines Authority for product and regulatory context, and national bodies such as ABARES for planted area, production, and farm input signals.
To keep assumptions grounded, we also reviewed sources such as FAOSTAT for cross-checking fertilizer use patterns, customs and trade statistics for import and export direction, and peer-reviewed agronomy literature for application-rate ranges by crop and season. On top of this, company annual reports, investor presentations, and reputable agricultural press were used to understand portfolio mix and price movement. Where needed, paid database subscriptions were used only for company financials and news, patent lookups, and shipment-level trade screening to validate directional changes. The sources named here are illustrative, and many other public and paid references were also used for data collection, validation, and clarification.
Primary Interviews and Surveys
Primary work was used to confirm how products are purchased and applied across broadacre and horticulture crops, and to pressure-test desk assumptions on volumes and pricing. We spoke with a mix of manufacturers, distributors, agronomists, and large farm operators to validate application patterns, seasonality, and the practical impact of regulation and resistance management on product choice. Inputs were then reconciled across respondent groups so gaps from public data could be filled without stretching assumptions.
Distribution of primary research fieldwork respondents
| Company type | Respondent position |
|---|---|
| Top tier: 29% | CXOs: 12% |
| Mid tier: 51% | Functional/Unit leaders: 43% |
| Smaller Players: 20% | Managers: 45% |
Market-Sizing & Forecasting
The core sizing uses a top-down demand pool build that reconstructs value from crop area and input intensity, and then it is reconciled against trade flow and local supply signals. In practice, we start from planted area by crop group, apply realistic treatment and application-rate ranges for fertilizers and key pesticide classes, and then translate these into annual volumes, which are priced using average selling price (ASP) bands aligned to product mix.
To keep the totals credible, selective bottom-up approximations are used as cross-checks, including sampled volume-by-channel logic and supplier-side revenue splits where disclosures allow it. A few inputs that materially move the model include cropped hectares by state, seasonal conditions that shift spray frequency, resistance-driven rotation of actives (which affects dosage and mix), the share of pre-emergent versus post-emergent programs in grains, and import parity effects on fertilizer pricing. Where data gaps appear, we avoid filling every micro category and instead apply conservative ranges that are validated through interviews, followed by sensitivity checks so the final number stays within realistic bounds.
For forecasting, scenario analysis is used, supported by simple time-series smoothing on the most stable drivers, such as cropped area and long-run fertilizer demand, and then adjusted using expert views on input price cycles and adoption changes. This approach stays reproducible because each forecast step is tied back to a small set of observable variables and clearly stated assumptions.
Data Validation & Update Cycle
Outputs are validated through triangulation across three angles, namely demand reconstruction, pricing checks, and supply and trade signals, so the final result does not depend on a single dataset. Anomalies, such as sudden value jumps from price spikes or weather-driven volume swings, are flagged and reviewed in a second analyst pass, and follow-up calls are triggered when the variance cannot be explained by public indicators.
The report is refreshed annually, and interim updates are made when material events occur, such as major regulatory decisions, sharp currency shifts affecting import-priced inputs, or sudden changes in crop planting outlook. Before delivery, an analyst runs a fresh review of the latest public releases and interview notes so the published market size reflects the most current and consistent view.
Mordor Intelligence's Australia Agrochemicals Market Size Compared With Other Published Estimates
Published market sizes for Australia agrochemicals can look far apart, even when the headline topic sounds the same, because the timing of pricing, the mix of included products, and the way volumes are converted into value often differ. Another source of variation comes from how often assumptions are refreshed, since input prices can move quickly within a year.
In our work, the main gap drivers typically show up in three places, namely whether fertilizers are counted alongside crop protection, whether ASPs are held constant or stepped up with exchange-rate timing, and whether application intensity is tied to seasonal conditions by crop. The refresh-led difference is important here because the model uses current-year currency conversion windows, updated price bands, and re-check calls on any large deltas before sign-off, which is where Mordor Intelligence tends to separate temporary price spikes from sustained demand shifts.
Benchmark comparison
| Source | Market Size | Gaps in Research Methodology |
|---|---|---|
| Mordor Intelligence | USD 8.10 B (2025) | |
| Industry Publisher A | USD 3.10 B (2025) | This estimate appears to use a narrower product boundary and typically treats agrochemicals closer to crop protection and selected inputs, which can exclude sizable fertilizer value and depress the total even with similar growth assumptions. |
| Industry Publisher B | USD 6.15 B (2025) | The figure is closer, but differences can come from how regional crop mixes are weighted and how ASPs are progressed through the year, especially when fertilizer prices and exchange rates move, which changes the value result without a big volume change. |
Overall, the spread is mainly explained by scope and by the timing rules used to convert volumes into USD value. When the same crop-area base is paired with consistent ASP windows and interview-backed checks on application intensity, the market size becomes easier to trace and repeat year after year.
Key Questions Answered in the Report
What is the current value of the Australia agrochemicals market?
The market stood at USD 8.39 billion in 2026.
How fast is the market projected to grow through 2031?
It is projected to expand at a 3.52% CAGR, reaching USD 9.97 billion by 2031.
Which product category holds the largest share?
Fertilizers lead with 53.62% share, largely due to the nations reliance on imported urea.
Why are adjuvants growing faster than other categories?
Precision sprayers need specialized surfactants and drift inhibitors, pushing adjuvants to a 7.31% CAGR.