
Market Overview
| Study Period | 2021 - 2031 |
|---|---|
| Forecast Data Period | 2026 - 2031 |
| Base Year Market Size (2025) | USD 4.20 Billion |
| Market Size (2026) | USD 4.5 Billion |
| Market Size (2031) | USD 6.60 Billion |
| Growth Rate (2026 - 2031) | 7.96 % |
| Market Concentration | Medium |
Major Players *Disclaimer: Major Players sorted in no particular order Image © Mordor Intelligence. Reuse requires attribution under CC BY 4.0. | |
Australia Agricultural Machinery Market Analysis by Mordor Intelligence
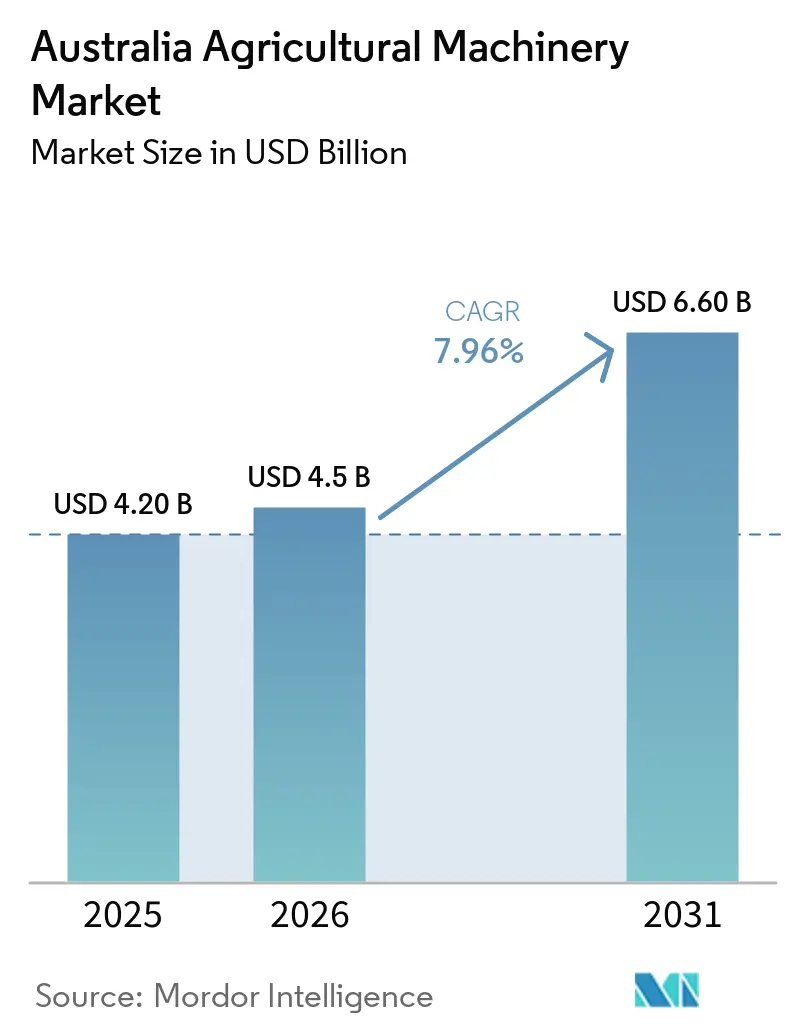
The Australia agricultural machinery market size is anticipated to grow from USD 4.2 billion in 2025 to USD 4.5 billion in 2026 and is forecast to reach USD 6.6 billion by 2031 at a 7.96% CAGR over 2026-2031. Structural labor shortages are steering producers toward capital-intensive solutions while targeted connectivity grants and concessional green loans reduce the effective cost of ownership. Precision farming is no longer confined to guidance systems, as on-farm broadband improves machine-to-cloud data flow and unlocks variable-rate automation. Electric drivetrains are becoming prominent as daytime surplus from rooftop solar arrays can meet charging requirements at nearly zero marginal cost. Autonomous field platforms are progressing beyond trial phases as Australia establishes clear safety guidelines and grants conditional access to public roads. These developments are influencing replacement cycles and shifting the competitive focus from horsepower to data, energy efficiency, and operational uptime.
Key Report Takeaways
- By machinery type, tractors led with 46% of the Australia agricultural machinery market share in 2025, while irrigation equipment is forecast to register the fastest expansion at a 9.1% CAGR from 2026-2031.
Note: Market size and forecast figures in this report are generated using Mordor Intelligence’s proprietary estimation framework, updated with the latest available data and insights as of 2026.
Australia Agricultural Machinery Market Trends and Insights
Drivers Impact Analysis*
| Driver | (~) % Impact on CAGR Forecast | Geographic Relevance | Impact Timeline |
|---|---|---|---|
| Declining farm labor availability and rising wage costs | +1.8% | Nationwide (Acute: New South Wales, Victoria, and Queensland) | Medium term (2-4 years) |
| Government rebates for water-efficient irrigation equipment | +1.2% | Queensland, South Australia, Northern Territory | Short term (2 years) |
| Accelerated investment in autonomous machinery pilots | +1.5% | New South Wales grain belt, Western Australia, Queensland cotton | Medium term (2-4 years) |
| Growth of carbon-credit-funded equipment upgrades | +0.9% | Mixed-farming (New South Wales, Victoria) | Long term ( 4 years) |
| On-farm renewable energy enabling electric machinery adoption | +1.1% | Queensland, South Australia (Wind-Solar) | Long term ( 4 years) |
| Expansion of large-scale horticulture in Northern Australia | +0.7% | Northern Territory (Ord River), Queensland (Burdekin), Western Australia (Kimberley) | Medium term (2-4 years) |
| Source: Mordor Intelligence | |||
Declining Farm Labor Availability and Rising Wage Costs
Agricultural payrolls fell by 31,900 positions to 258,900 in the year to May 2025, cutting labor supply by 11% and pushing operators toward mechanized harvesting and autonomous weeding[1]. Participation in the Pacific Australia Labour Mobility scheme also slipped, worsening staff shortfalls during peak picking windows. Australia’s farm workforce is shrinking and aging, forcing a structural pivot toward capital-intensive operations that rely on automation. Skilled operator wages are surging fastest, amplifying payback on driverless platforms. Operators are evaluating the payback period for an autonomous platform compared to employing seasonal workers. Projected wage inflation further strengthens the case for automating core field tasks.
Government Rebates for Water-Efficient Irrigation Equipment
Queensland's Irrigation Pricing Rebate reduces water bills, enabling many sugar and cotton growers to quickly recover costs on variable-rate pivots. The national On-Farm Emergency Water Infrastructure Rebate supports the transition from flood irrigation systems to drip and low-pressure sprinklers. In South Australia, vineyards have installed soil moisture probes and automated valves through drought-readiness grants, achieving significant reductions in total water use. Queensland’s Drought Preparedness Grants provide eligible primary producers with up to USD 50,000 (AUD) per business to invest in permanent on-farm capital infrastructure aimed at enhancing resilience. This includes projects such as pivot upgrades, drip system conversions, and water storage improvements, covering 25% of the total project cost. With application windows closing once funds are exhausted, growers have rushed procurement, front-loading 2024-2026 sales of sensors, controllers, and variable-rate pumps. In the Ord River expansion, rebate-supported pivots play a critical role in cooling high-value horticultural crops during periods of extreme evapotranspiration.
Accelerated Investment in Autonomous Machinery Pilots
Digital agriculture has the potential to increase gross production value by 25%, representing a nationwide gain. Grain Automate is a five-year initiative (2023–2028) aimed at encouraging the adoption of autonomous systems, machine automation, and digital intelligence technologies within the Australian grains industry. This initiative includes a USD 24.8 million investment from the Grains Research and Development Corporation (GRDC). Artificial intelligence sprayers have demonstrated 96% savings in herbicide use while maintaining equivalent yield metrics, persuading late adopters of the immediate Return on Investment (ROI). Original Equipment Manufacturers (OEMs) now offer cloud-based fleet portals as part of their product packages.
Growth of Carbon-Credit-Funded Equipment Upgrades
The Clean Energy Finance Corporation (CEFC) and National Australia Bank (NAB) introduced a USD 300 million (AUD) co-financing program in 2025 to offer discounted loans to support emissions-reduction efforts in Australia's business and agricultural sectors. Rabobank extends credit lines repayable in part from future Australia Carbon Credit Unit revenues, allowing mixed farmers to finance no-till drills whose lower diesel draw also generates offsets. Early adopters report payback shortening by almost two seasons when carbon cash flows underwrite principal and interest. Revenue from soil-carbon credits is being recycled into no-till drills, variable-rate lime spreaders, and telemetry kits linked to greenhouse-gas accounting. The forthcoming Integrated Farm and Land Management method will let growers stack multiple sequestration activities, further boosting liquidity for equipment purchases.
Restraints Impact Analysis*
| Restraint | (~) % Impact on CAGR Forecast | Geographic Relevance | Impact Timeline |
|---|---|---|---|
| High upfront and maintenance cost of machinery | –1.4% | Small and medium farms nationwide | Short term (≤2 years) |
| Data-privacy risks in cloud-linked equipment | −0.6% | New South Wales and Victoria precision-agriculture leaders | Medium term (2–4 years) |
| Limited on-farm connectivity in remote regions | −0.8% | Western Australia, Queensland interior, and Northern Territory | Medium term (2–4 years) |
| Supply-chain delays for spare parts | −0.5% | National but easing as new distribution hubs open | Short term (≤2 years) |
| Source: Mordor Intelligence | |||
High Upfront and Maintenance Cost of Machinery
Insurance costs for large combines have increased by over 300% since 2022, while the prices of critical parts remain significantly higher than pre-pandemic levels. This has led growers to reduce planting intentions and delay equipment upgrades. The total cost of ownership is now heavily influenced by proprietary software fees and specialized electronic components, maintaining high break-even thresholds for smaller operations despite the availability of new leasing models. Precision retrofit kits, priced at approximately USD 30,000 per farm, pose a significant challenge for livestock and horticulture operators operating with margins below 8%. Annual service costs for combine harvesters are substantial, even before accounting for downtime losses, making equipment rental an increasingly popular strategy during harvest.
Data-Privacy Risks in Cloud-Linked Equipment
Farmers cite data control anxieties when considering telematics or drone-mapped agronomy because ownership terms remain vendor-set. The voluntary Farm Data Code establishes best practices but does not provide enforceable rights, leading many growers to avoid automatic uploads to manufacturer servers. Early adopters in New South Wales and Victoria are utilizing detailed, precise, and accurate data on their crop performance (yield) to strengthen their position in justifying the rental price for their land. The resulting trust gap slows the transition from semi-autonomous to fully autonomous systems that depend on continuous connectivity for safe, remote oversight[2].
*Our forecasts treat driver/restraint impacts as directional, not additive. The impact forecasts reflect baseline growth, mix effects, and variable interactions.
Segment Analysis
By Machinery Type: Tractors Remain the Anchor, Irrigation Leads Growth
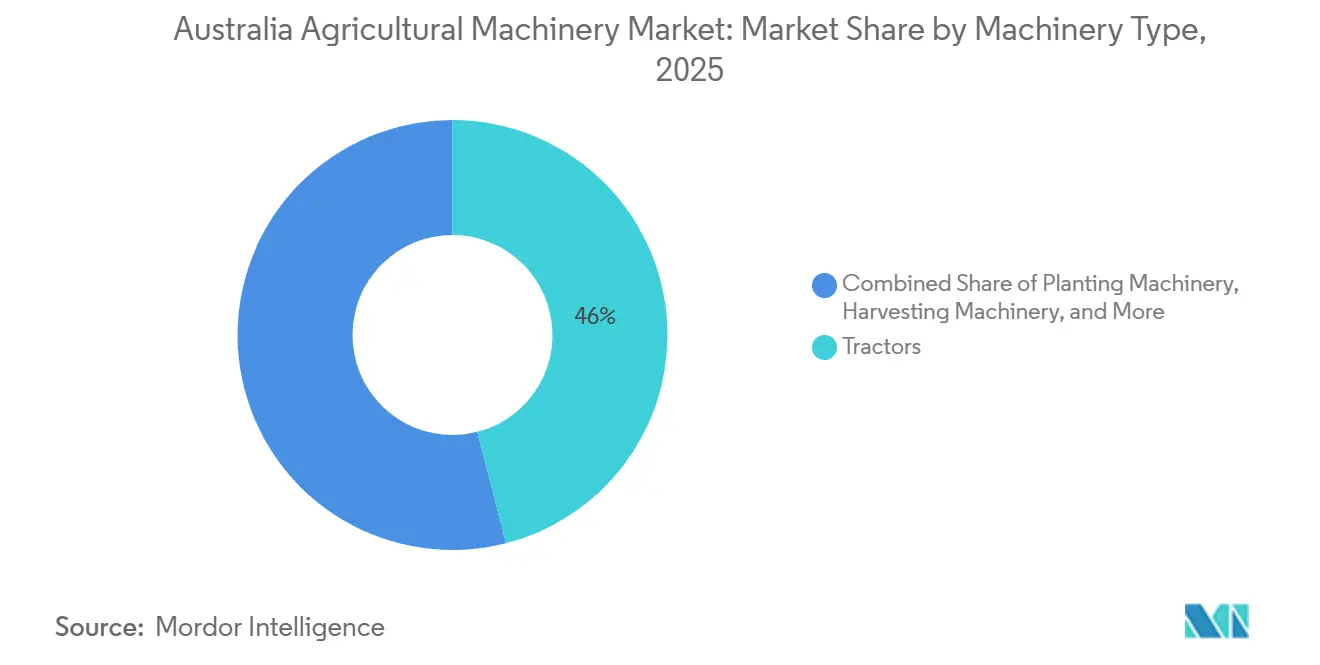
Tractors account for the largest market share, representing 46% of the Australia Agricultural Machinery Market in 2025, while Irrigation Machinery is driving the fastest growth trajectory at 9.1% CAGR from 2026-2031, reflecting their evolution from basic power units to sophisticated precision agriculture platforms. In 2025, Deere & Company's announcement of nearly USD 20 billion in the United States manufacturing investment over the next decade, combined with its commitment to demonstrate a fully autonomous corn and soybean production system by 2030, exemplifies the technological transformation occurring within this segment[3]. The segment's growth is being driven by the integration of AI-powered automation features, with manufacturers introducing predictive groundspeed automation and harvest settings optimization that enhance productivity while reducing operator fatigue. Electric variants are scaling rapidly from a low base, supported by solar-linked charging pilots that slash fuel bills for low-hour horticulture work.
Irrigation machinery is experiencing accelerated growth driven by concerns about water scarcity and government rebate programs. Semi-autonomous retrofits extend the operational lifespan of implements, such as planters, by incorporating sectional shut-off and rate control modules instead of requiring full replacements. Planting machinery is experiencing renewed interest due to precision seeding technologies that enable variable-rate application and real-time monitoring of seed placement accuracy. Harvesters now feature self-learning sensors that dynamically adjust threshing, increasing throughput during compressed harvest windows. Ploughing and cultivating demand stabilizes as controlled-traffic and no-till adoption becomes widespread in the northern wheat belt. Other machinery types, including grain dryers and farm loaders, are benefiting from the overall mechanization trend and the need for post-harvest processing efficiency improvements.

Geography Analysis
New South Wales led the Australia agricultural machinery market in 2025, driven by extensive crop and pasture areas and high adoption of precision guidance systems. The release of advanced machinery models aligned with harvest schedules further supported market growth. Victoria followed closely, with strong demand for forage and hay equipment linked to dairy industry expansion and trials of electric tractors exploring sustainable farming solutions. Precision Planting’s SmartDepth retrofit resonates with mixed farmers adopting strip-till and cover crop practices that align with carbon markets.
Queensland and Western Australia contributed significantly, with Queensland benefiting from sugarcane mechanization and horticulture projects, while Western Australia saw growth in controlled-traffic farming and local assembly plants, reducing equipment lead times. Both regions are adopting technologies like GPS and autonomous systems to enhance efficiency and productivity. Rooftop solar clusters and irrigation advancements also helped drive equipment upgrades. Government subsidies on water pricing further accelerate sales of irrigation gear, especially variable-rate pivots that reduce pumping demand during peak tariff hours.
South Australia, Tasmania, and the Northern Territory held smaller shares but showed potential for growth. South Australia focused on vineyard modernization and smart irrigation systems, while Tasmania saw upgrades in forage equipment to meet dairy demands. The Northern Territory experienced growth through irrigation projects and specialized machinery suited for tropical conditions, catering to the needs of export-oriented farming operations. Dealers adopt mobile service hubs that restock via Darwin ports, a two-day truck haul shorter than sourcing from southern capitals. Precision irrigation and specialty harvesters dominate orders because fragile produce must meet export phytosanitary standards.
Regulatory Landscape
Australia regulates agricultural machinery through road access, biosecurity, and emissions frameworks. The Road Vehicle Standards Act 2018 (RVSA) and related vehicle type-approval pathways shape how OEMs configure lighting, braking, and other road-safety requirements for tractors and self-propelled equipment, while purpose-built machines are sometimes handled as non-road vehicles under the Road Vehicle Standards (Classes of Vehicles that are not Road Vehicles) Determination 2021. The Department of Infrastructure, Transport, Regional Development, Communications and the Arts administers these frameworks, determining how equipment is certified for road use.
Competitive Landscape
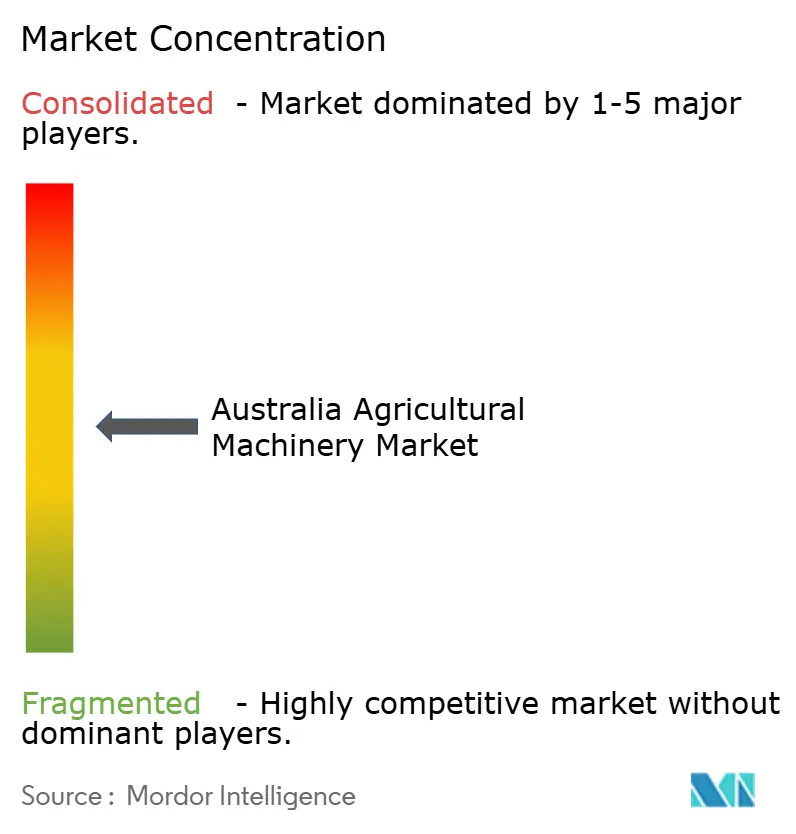
Market concentration in the Australia agricultural machinery market remains moderate in 2025, with the top players such as Deere & Company, Kubota Corporation, CNH Industrial N.V., AGCO Corporation, and CLAAS KGaA mbH holding a significant share. Established players like Deere and CNH Industrial have strengthened their positions through investments in distribution infrastructure, enhancing service efficiency, and reducing lead times. CNH Industrial N.V.’s collaboration with Intelsat in 2024 is emblematic, as it embeds satellite connectivity, removing the biggest adoption hurdle for the autonomous kit in remote farms. Kubota continues to focus on mid-horsepower tractors and implements, catering to mixed farms with an emphasis on compact designs and fuel efficiency.
Technological advancements are shaping the market, with AGCO introducing electric tractors from 2023 and advanced planting technologies to attract early adopters. Valmont’s cloud-based platform, launched in 2023, enables remote monitoring for large farms, while SwarmFarm uses an integrated autonomy model, providing the autonomous SwarmBot platform and charging an ongoing service fee for specific "missions" or software applications. This open-ecosystem approach allows farmers to attach third-party implements for tasks like weeding or sensing
Strategic shifts highlight a divide between established OEMs expanding service infrastructure and new entrants adopting innovative pricing models. Companies like Mahindra & Mahindra Limited are targeting cost-sensitive buyers, while others focus on dealership consolidation to enhance service capabilities. Emerging trends such as subscription robotics and pay-per-use financing are disrupting traditional sales models, creating opportunities for brands that can ensure fleet uptime and comply with evolving safety standards.
Australia Agricultural Machinery Industry Leaders
-
Deere & Company
-
Kubota Corporation
-
CNH Industrial N.V.
-
AGCO Corporation
-
CLAAS KGaA mbH
- *Disclaimer: Major Players sorted in no particular order
Market Opportunities and Future Outlook
Connectivity-enabled precision systems are increasingly tied to total cost of ownership and the shift toward new aftersales models. The Australian Government On Farm Connectivity Program Round 3 includes rebates up to AUD 20,000 to support machine-to-cloud workflows such as telematics, variable-rate control, and remote monitoring, which are central to autonomy and uptime-focused service offerings.
Investment and commercialization support also remains a near-term lever for adoption. The NSW Agriculture Industries Innovation and Growth Program provides up to AUD 25 million in support for equipment and agtech through January 2026, and Queensland launched the AUD 30 million Sowing the Seeds of Farming Innovation Fund in April 2026 to fund on-farm technology development and adoption. Federal Right to Repair reforms are under active policy development, indicating movement toward diagnostic access and faster service turnaround.
Recent Industry Developments
- July 2026: JCB initiated a multi-million dollar expansion of its Australian parts and aftersales network across regional hubs. The company is focused on reducing downtime and improving service response times. The expansion strengthens aftermarket support and dealer coverage in key farming corridors.
- May 2025: Policy developments on Right to Repair progressed in Australia. The changes signaled regulatory momentum toward diagnostic access and faster service turnaround for agricultural machinery.
- September 2024: Kubota Corporation Australia opened a new parts warehouse in Victoria to centralize inventory. This move is intended to speed up parts distribution.
Research Methodology Framework and Report Scope
Market Definition and Coverage
For this study, the market covers the value of agricultural machinery sold into Australia for farm operations, where equipment is used to prepare land, plant, irrigate, harvest, and manage crop and forage work.
Scope exclusions: We exclude post-sale services, long-term maintenance contracts, farm labor services, and used-equipment resale value where it is not part of new equipment revenues.
Segmentation Overview
- By Machinery Type
- Tractors
- Horsepower
- Below 40 HP
- 40 -120 HP
- Above 120 HP
- Utility Type
- Compact Utility Tractors
- Utility Tractors
- Row Crop Tractors
- Horsepower
- Ploughing and Cultivating Machinery
- Ploughs
- Harrows
- Cultivators and Tillers
- Other Planting and Cultivating Machinery (Rotary Hoes, Ridge Formers, etc.)
- Planting Machinery
- Seed Drills
- Planters
- Spreaders
- Other Planting Machinery (Transplanters, Bed Planters, etc.)
- Harvesting Machinery
- Combine Harvesters
- Forage Harvesters
- Other Harvesting Machinery (Sugarcane Harvesters, Potato Harvesters, etc.)
- Haying and Forage Machinery
- Mowers and Conditioners
- Balers
- Other Haying and Forage Machinery (Tedders, Rakes, etc.)
- Irrigation Machinery
- Sprinkler Irrigation
- Drip Irrigation
- Other Irrigation Machinery (Pivot Corner Arms, Flood Irrigation Sets, etc.)
- Other Machinery Types (Grain Dryers, Farm Loaders, etc.)
- Tractors
Data Sources, Market Sizing, and Validation
Desk Research
Desk research is used to set the base structure of the market and to anchor the model to real world farming activity in Australia. We mainly pull public signals that relate to machinery demand, such as cropped area and crop production outlooks, seasonal weather patterns, and farm input economics that affect replacement cycles.
Sources used include public datasets and official publications such as the Australian Bureau of Statistics, ABARES, the Bureau of Meteorology, Department of Agriculture Fisheries and Forestry releases, and customs and trade statistics portals, plus peer-reviewed journals on mechanization and precision agriculture. We also review company annual reports and investor presentations, dealership announcements in reputable press, and association websites to understand product mix changes. Where company financials, patent activity, and shipment or trade movements are hard to map directly, a limited set of paid database subscriptions is used to improve consistency. These desk sources are not exhaustive, and many other references were reviewed to collect data points, validate assumptions, and clarify open questions.
Primary Interviews and Surveys
Primary work is used to stress-test the desk model and to convert activity indicators into value, especially where pricing and mix can shift quickly from season to season. We speak with a spread of stakeholders, including equipment distributors and dealers, farm operators, financing and leasing participants, and product and service leaders connected to major machinery lines, and the coverage is balanced across Australia's key farming regions.
Feedback from these conversations is used to confirm what is being purchased now versus delayed, how discounting and bundled implements are handled in dealer discussions, and how demand differs between broadacre cropping, mixed farming, and forage-linked operations.
Distribution of primary research fieldwork respondents
| Company type | Respondent position |
|---|---|
| Top tier: 35% | CXOs: 13% |
| Mid tier: 50% | Functional/Unit leaders: 35% |
| Smaller Players: 15% | Managers: 52% |
Market-Sizing & Forecasting
Sizing is built using a top-down approach where national demand pools are reconstructed from farming activity and equipment intensity, and then translated into value using typical price bands by machinery category. For Australia, the model leans on a practical chain of logic that starts with cropped area and crop mix, then moves through mechanization needs by farm type, and finally maps this to replacement cycles and new-buy triggers.
To keep the totals realistic, we corroborate results with selective bottom-up approximations, such as supplier and dealer roll-ups in sampled states, channel checks on unit movement, and volume times average selling price checks for high-value categories like tractors and harvesting machinery. Inputs that materially move the model include rainfall and drought signals, planted acreage shifts, grain and oilseed price direction, farm income conditions, equipment age and replacement behavior, and observed changes in irrigation investment. Forecasting is done using scenario analysis supported by simple time-series smoothing on the largest categories. Primary feedback is used to pick reasonable paths for price progression, discounts, and adoption of automation features. When bottom-up signals are incomplete, gaps are handled by applying category-level mix shares that are validated through interviews and then rechecked against import trends and farm activity indicators.
Data Validation & Update Cycle
Outputs are validated through triangulation across independent signals, and variance checks are run at the category level so unusual jumps are questioned before they are accepted. We compare implied units and spending per farm area with expected ranges, and when results drift from those ranges, assumptions on price, mix, or replacement timing are revisited.
A multi-step analyst review is followed so the market totals, growth rates, and key assumptions are checked for consistency across years. If a material variance is found, primary respondents are re-contacted to confirm whether it reflects a true market shift or a modeling artifact. Reports are refreshed annually, with interim updates when major events occur, and a final pre-delivery pass is completed to reflect the latest available public indicators.
Mordor Intelligence's Australia Agricultural Machinery Market Size Versus Other Published Estimates
Published market sizes for Australia agricultural machinery often vary even when the topic name sounds the same, since each estimate can use a different equipment list, pricing basis, and timing for currency conversion. Differences also show up when one publisher counts only new equipment sales, while another blends in broader equipment and technology bundles.
The main gap comes from whether irrigation systems, planting attachments, and certain farm support implements are fully counted inside the machinery total, and in Mordor Intelligence the figure is built by counting only the defined machinery types and then applying category-level pricing and mix checks that are refreshed with dealer and farm feedback.
Benchmark comparison
| Source | Market Size | Gaps in Research Methodology |
|---|---|---|
| Mordor Intelligence | USD 4.20 B (2025) | |
| Industry Publisher A | USD 4.20 B (2025) | Uses a similar year and broad machinery grouping, but typically applies a longer forecast horizon with smoother price and adoption assumptions, which can lower near-term volatility versus seasonal reality. |
| Market Marketplace B | USD 6.21 B (2025) | The higher value is consistent with a broader scope that can fold in adjacent equipment and technology spend, and it may rely more on sales-side aggregation without the same category-by-category activity and pricing cross-checks. |
The comparison shows that scope definition is the biggest driver of the spread, followed by how prices, discounts, and mix are carried forward in forecasts. By keeping the model tied to observable farm activity and then validating value through channel checks, the estimate stays traceable to repeatable steps and clear assumptions.
Key Questions Answered in the Report
What is the current value of Australia's agricultural machinery sector?
The Australia agricultural machinery market is valued at USD 4.5 billion in 2026 and is forecast to reach USD 6.6 billion by 2031.
How fast is the sector expanding?
A rapidly growing CAGR of 7.96% from 2026 to 2031 highlights strong growth driven by automation and government incentives.
Which machinery category leads spending?
Tractors hold 46% of the Australia agricultural machinery market size in 2025.
Why are carbon credits important for machinery sales?
Rising Australian Carbon Credit Unit (ACCU) prices give farmers new cash flow that is increasingly reinvested in precision and no-till equipment required for soil-carbon projects.