
Austin Data Center Market Size and Share
Market Overview
| Study Period | 2020 - 2031 |
|---|---|
| Forecast Data Period | 2026 - 2031 |
| Base Year Market Size (2025) | 1.54 gigawatt |
| Market Volume (2026) | 1.63 gigawatt |
| Market Volume (2031) | 2.19 gigawatt |
| Growth Rate (2026 - 2031) | 6.05% CAGR |
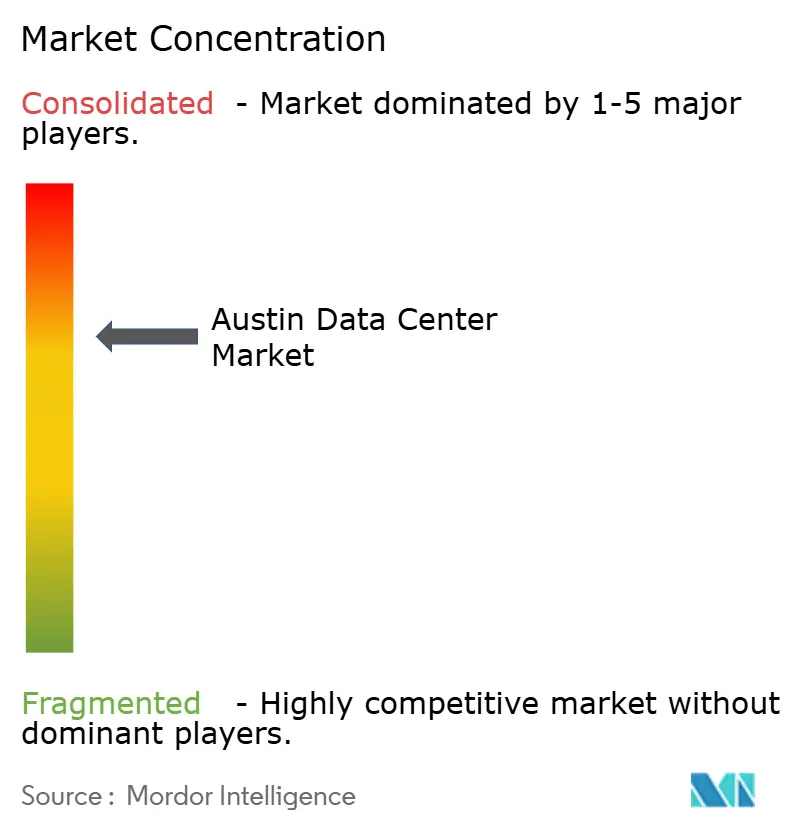
| Market Concentration | Medium |
Major Players *Disclaimer: Major Players sorted in no particular order Image © Mordor Intelligence. Reuse requires attribution under CC BY 4.0. | |
Austin Data Center Market Analysis by Mordor Intelligence
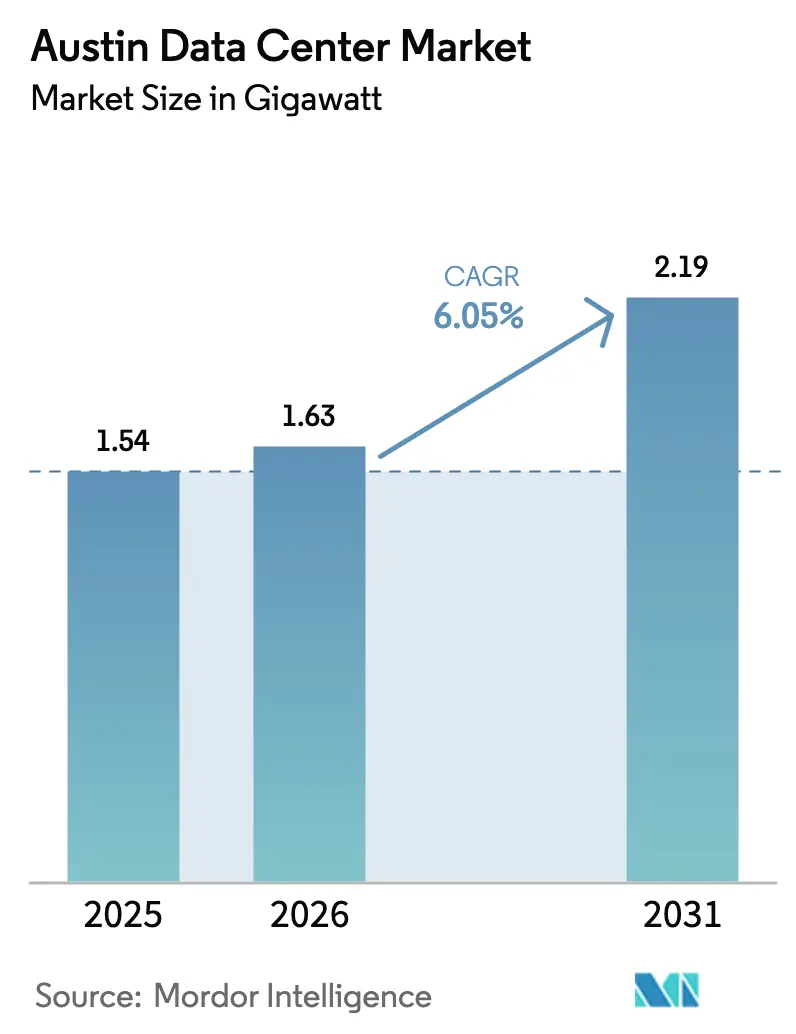
The Austin data center market size was valued at 1.54 gigawatts in 2025 and estimated to grow from 1.63 gigawatts in 2026 to reach 2.19 gigawatts by 2031, at a CAGR of 6.05% during the forecast period (2026-2031). The projected capacity expansion is underpinned by sustained hyperscaler migration from Dallas–Fort Worth and Houston, semiconductor-driven edge-compute demand, and a supportive Texas incentive framework. Rapid renewable-energy procurement through favorable ERCOT rules further accelerates site selection, while capital inflows from global infrastructure funds signal durable interest in Austin’s power-dense campuses. Growing requirements for AI model training, automotive-edge workloads, and sovereign cloud deployments reinforce Austin’s position as the fastest-growing secondary hub within the broader Texas Triangle. As of early 2025, the Austin data center market hosts 47 operational facilities run by 21 providers, creating an ecosystem that combines low-latency regional reach with access to West Texas wind and solar resources.
Key Report Takeaways
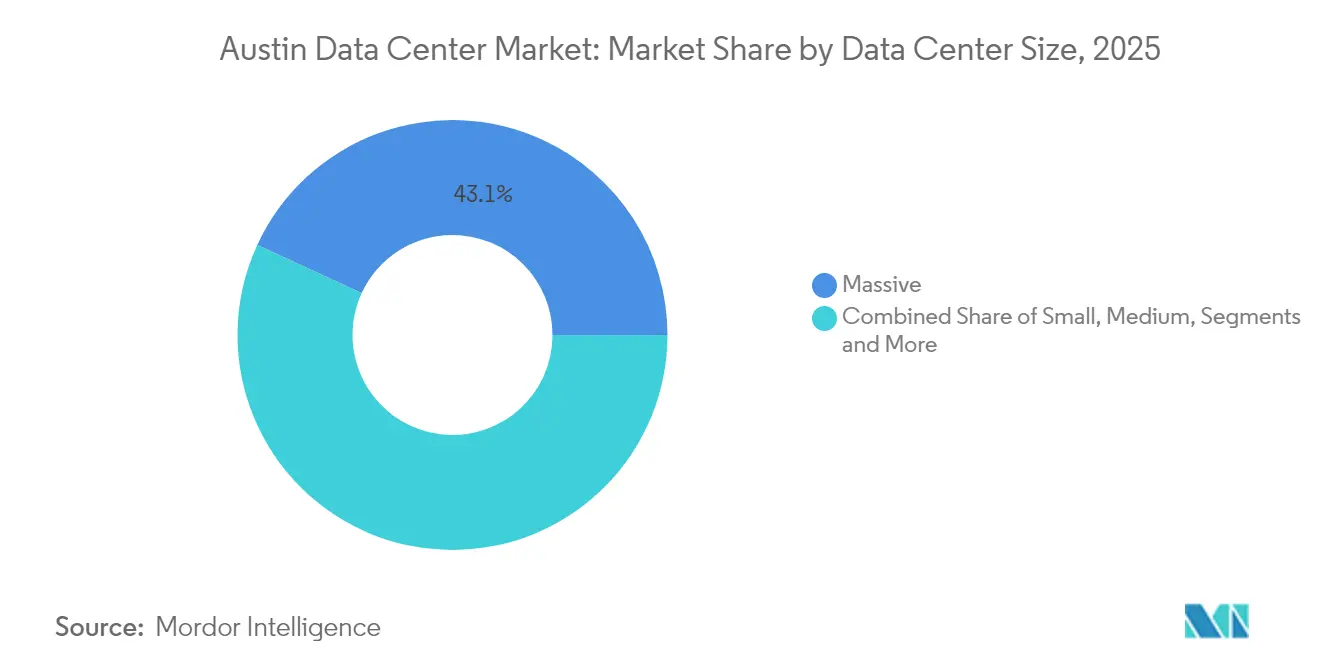
- By data center size, massive facilities held 43.12% of Austin data center market share in 2025; mega-scale deployments are projected to grow at a 9.05% CAGR through 2031.
- By tier, Tier 3 configurations accounted for 53.85% revenue share in 2025, while Tier 4 is the fastest-growing category at a 9.88% CAGR to 2031.
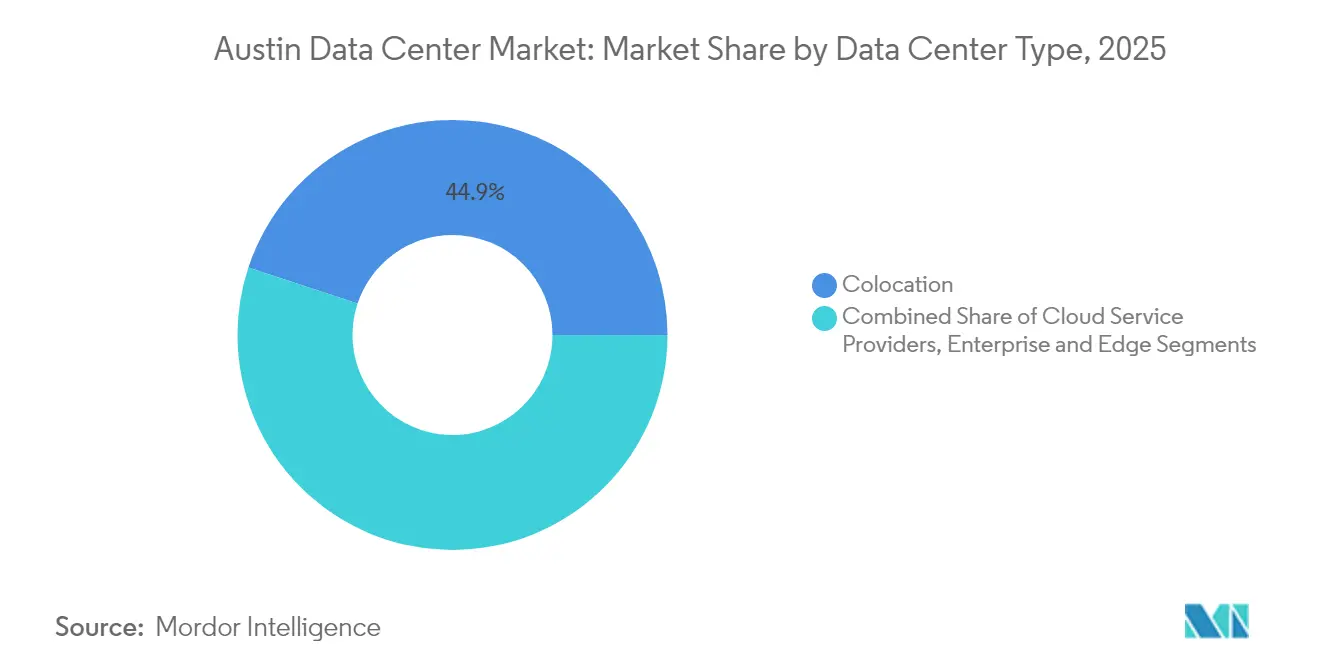
- By data center type, colocation controlled 44.92% of the Austin data center market size in 2025, whereas cloud service providers are expanding at a 12.05% CAGR through 2031.
- By power procurement model, renewable-linked PPAs represented 37.65% of contracted load in 2025 and are on pace to exceed 56.15% of contracted capacity by 2031.
- Digital Realty, CyrusOne, Switch, Sabey Data Centers, and Aligned Data Centers collectively accounted for nearly 37.45% of installed megawatt capacity in 2025.
Note: Market size and forecast figures in this report are generated using Mordor Intelligence’s proprietary estimation framework, updated with the latest available data and insights as of 2026.
Austin Data Center Market Trends and Insights
Drivers Impact Analysis*
| Driver | ( ~ ) % Impact on CAGR Forecast | Geographic Relevance | Impact Timeline |
|---|---|---|---|
| Hyperscaler migration from Dallas and Houston corridors | +1.8% | Austin metro, Round Rock, Georgetown | Medium term (2-4 years) |
| Enterprise cloud off-load from “Silicon Hills” semiconductor expansion | +1.5% | Austin-Taylor corridor, Williamson County | Long term (≥ 4 years) |
| Texas sales- and property-tax abatements for mission-critical facilities | +0.9% | Travis and Williamson Counties | Short term (≤ 2 years) |
| Cheap renewable PPAs enabled by ERCOT congestion-zone reforms | +0.7% | ERCOT West Zone to Austin load centers | Medium term (2-4 years) |
| Rising edge-compute demand from autonomous-vehicle testing cluster | +0.4% | SH-130 corridor, downtown Austin | Long term (≥ 4 years) |
| Rapid 5G densification raising micro-edge colocation needs | +0.3% | High-density Austin corridors | Short term (≤ 2 years) |
| Source: Mordor Intelligence | |||
Hyperscaler migration from Dallas and Houston corridors
Central Texas land prices remain below Dallas-Fort Worth averages, while ERCOT queue data shows greater available interconnection capacity near Austin. Alphabet and Microsoft already committed to multi-site expansion programs that prioritize contiguous parcels capable of supporting 100 megawatt increment builds.[1]SiliconHills News, “Austin and San Antonio’s Data Center Market Sees Record Growth and Demand,” siliconhillsnews.com The proximity advantage reduces latency to the state’s largest enterprise clusters and allows operators to blend West Texas wind with solar power generated closer to load. As grid congestion worsens north of Waco, developers are shifting pipelines southward, leading to a surge in campus announcements around Hutto, Taylor, and Georgetown. New subsea cable landing partnerships through the Gulf Coast further shorten round-trip latency to Latin America, adding to Austin’s appeal for hyperscalers seeking multi-region disaster recovery.
Enterprise cloud off-load from “Silicon Hills” semiconductor expansion
Samsung’s ongoing USD 45 billion commitment to the Taylor fabrication complex has introduced unprecedented edge-analytics requirements.[2]Williamson County Economic Development Partnership, “Samsung Taylor Expansion Overview,” williamsoncountytxedp.com Process nodes at 2 nanometers generate telemetry in terabytes per hour, demanding real-time compute for yield analysis. AMD’s investment in local AI accelerator RandD intensifies that need, while the broader semiconductor supply chain—from photoresist suppliers to backend test vendors—requires proximity-based data ingestion. The Austin data center market is therefore becoming a parallel infrastructure backbone for the region’s chip ecosystem, providing low-latency links between design centers, fabs, and cloud AI clusters. Over the forecast period, each additional fabrication phase could translate into 30-50 megawatts of incremental compute demand, reinforcing a virtuous cycle between manufacturing scale-up and data center growth.
Texas sales- and property-tax abatements for mission-critical facilities
Under Chapter 312, counties approve abatements of up to 85% on real-property taxes when developers commit at least USD 200 million and meet wage thresholds that exceed county averages.[3]Texas Comptroller of Public Accounts, “Data Center Exemption Program,” comptroller.texas.gov Williamson County’s agreement with Samsung for the Taylor site and Bastrop County’s incentive package for EdgeConneX illustrate the competitive bidding that counties now pursue to attract digital-infrastructure investment. Sales-tax exemptions on servers and networking equipment further improve project net present value, reducing effective total-cost-of-ownership by nearly 9% on a 20-year horizon. These structures encourage multi-building phased developments, with abatements typically front-loaded during the construction period to accelerate cash-flow breakeven.
Cheap renewable PPAs via ERCOT congestion-zone reforms
ERCOT’s 2024 congestion revenue right auctions cleared at multi-year lows in the West Zone after transmission upgrades entered service, enabling merchant solar and wind owners to negotiate sub-USD 30 per megawatt-hour bundles with flexible curtailment clauses ercot.com. Data center operators utilize virtual PPAs coupled with nodal hedges to lock in pricing and hedge congestion risk. Google’s direct participation in West-to-Austin firming contracts exemplifies the model, pairing solar output with grid-side battery storage to deliver near-baseload profiles. As additional 345 kV lines reach readiness, developers expect further basis tightening, making ERCOT one of the few U.S. markets where large loads can realistically reach 80–90% hourly renewable matching before 2030.
Restraints Impact Analysis*
| Restraint | ( ~ ) % Impact on CAGR Forecast | Geographic Relevance | Impact Timeline |
|---|---|---|---|
| Power-grid volatility and curtailment risk | –1.2% | ERCOT West Zone, local transmission ties | Short term (≤ 2 years) |
| Shrinking water table and cooling-water moratoriums | –0.8% | Highland Lakes watershed, Travis County | Medium term (2-4 years) |
| Escalating land valuations in Williamson and Travis Counties | –0.5% | Austin core to Cedar Park | Long term (≥ 4 years) |
| Specialized workforce shortage in critical-facility OandM | –0.3% | Tier 4 operations across metro | Medium term (2-4 years) |
| Source: Mordor Intelligence | |||
Power-grid volatility and curtailment risk
ERCOT forecasts indicate peak load could hit 218 gigawatts by 2031, with data centers accounting for nearly 40% of incremental demand. Local congestion at the 138 kV layer around Pflugerville and Manor forces occasional load-shed directives when wind output in the West Zone collapses. Some operators now add behind-the-meter gas turbines sized at 30–50 megawatts to assure N+1 supply, but regulators remain wary of the emissions trade-off. In May 2025, the Texas Legislature granted the Public Utility Commission expanded authority to scrutinize new large-load interconnection requests, potentially lengthening approval cycles. Until ERCOT finalizes its market-design reform aimed at firming reserve margins, curtailment risk will weigh on near-term build schedules, tempering the Austin data center market growth trajectory.
Shrinking water table and cooling-water moratoriums
Lake Travis and Lake Buchanan reached a combined 42% capacity in early 2025, triggering Stage 1 drought restrictions across the Highland Lakes watershed. Municipal utilities instituted volumetric surcharges for non-residential customers exceeding allocation baselines. Data center campuses consuming upward of 5 million gallons per day now evaluate dry optimization methods such as refrigerant-based heat rejection and rear-door heat exchangers. Samsung’s Taylor fab already contracts reclaimed wastewater from Austin’s South Wastewater Treatment Plant, providing a model for circular reuse partnerships. Nonetheless, city councils from Round Rock to Cedar Park have signaled willingness to pause new high-water-use permits should lake levels fall below 35%, making water stewardship a strategic differentiator for future projects.
*Our forecasts treat driver/restraint impacts as directional, not additive. The impact forecasts reflect baseline growth, mix effects, and variable interactions.
Segment Analysis
By Data Center Size: Mega-Scale Drives AI Infrastructure
Mega facilities are on track to capture USD 8.65 billion cumulative capital deployment between 2026 and 2031, representing the fastest-growing slice of the Austin data center market. Massive sites still retained a 43.12% share of installed megawatts in 2025, yet their decade-old shell designs struggle to host AI racks exceeding 80 kilowatts. Aligned Data Centers’ 2-story slab-on-grade buildings with DeltaFlow liquid cooling achieve rack densities above 140 kilowatts, a configuration favored for generative-AI clusters. Mega campuses typically span 250–500 acres, providing space for on-site 400 kV substations that ensure multi-gigawatt scalability. Growth also benefits from ERCOT’s simplified interconnection studies for single-owner master-planned developments, trimming lead time by eight months compared with piecemeal expansion. As a result, mega-scale deployments command the highest development pipeline share, underpinning an expected 9.05% CAGR that outpaces the overall Austin data center market. Smaller facilities continue to serve edge and latency-critical workloads, but they now adopt modular liquids cooling pods to stay competitive against high-density mega campuses.
Long-term, mega campuses should anchor at least 55% of the Austin data center market size once the current tranche of 1.1 gigawatts under construction fully energizes by 2028. Campus operators secure 15-year renewable PPAs at volume discounts, enabling total energy cost per kWh that is 12% below averages paid by medium facilities. This cost spread encourages AI tenants to commit to 30-year ground leases, reducing churn risk for developers. Meanwhile, federal incentives under the CHIPS Act strengthen the link between semiconductor plant expansions and co-located compute estates. The resulting ecosystem positions mega campuses as the backbone infrastructure for South-Central United States AI proliferation.


By Tier Type: Tier 4 Expansion Reflects Mission-Critical Migration
Tier 3 maintained 53.85% of the Austin data center market size in 2025, sustained by a wide base of enterprise disaster-recovery deployments. However, Tier 4 recorded a 9.88% CAGR, primarily due to the influx of financial-services trading platforms, healthcare e-records, and public-sector secure clouds. Tier 4 facilities in Austin deliver fault-tolerant architecture with fully independent distribution paths, reducing unplanned outage risk to below 0.4 hours annually. Sabey Data Centers’ Round Rock campus illustrates the appeal: the site guarantees 99.995% uptime, employs eight layers of physical security, and has already won a USD 457 million supercomputer program award. This momentum indicates that Tier 4 adoption is transitioning from niche to mainstream inside the Austin data center market.
As state agencies modernize legacy systems and adopt zero-trust architectures, contract language increasingly specifies Tier 4 uptime guarantees. Healthcare providers follow similar paths because HIPAA expansion now demands stricter availability targets for electronic health-record hosting environments. Simultaneously, Tier 1 and Tier 2 footprints concentrate at the metropolitan edge, addressing IoT and content-delivery use cases where cost minimization outweighs redundancy. The divergence channels high-value workloads toward Tier 4, thereby elevating its share of Austin data center market share to an expected 37.25% by 2031, up from 21.40% in 2025.
By Data Center Type: CSPs Lead AI Infrastructure Build-Out
Cloud service providers recorded a 12.05% CAGR, the highest among all operator categories, as hyperscalers design purpose-built AI campuses capable of allocating up to 10 exaflops per building. Colocation, while retaining 44.92% share of the Austin data center market size in 2025, evolves to offer fit-out suites preconfigured for immersion cooling, courting mid-tier SaaS vendors migrating from wholesale space in Dallas. Intersect Power’s supply agreement with Google showcases how CSPs bundle power and land in a single transaction, circumventing the colocation layer entirely. Retail colocation still attracts regional enterprises seeking 100-kilowatt cages, but wholesale contracts are elongating to 7–10 years, a clear sign that tenants crave stability to amortize GPU-dense infrastructure.
Enterprise self-build remains relevant for Fortune 500 firms headquartered in Austin’s suburban sub-markets, though ballooning construction costs and scarce mission-critical talent constrain new in-house starts. Modular deployments gain traction inside manufacturing facilities, allowing semiconductor lines to keep sensitive defect-analysis workloads on-premise. Edge nodes proliferate to serve AV, 5G, and live-event streaming use cases, forming a lattice of 1 megawatt micro-sites connected via high-count fiber to primary CSP or colocation hubs. Aggregating these trends, hyperscaler ownership is forecast to surpass 52.45% of total deployed megawatts by 2031, reshaping the Austin data center market competitive balance.
Geography Analysis
The broader Texas data center ecosystem is now second only to Northern Virginia in under-construction capacity, and Central Texas alone accounts for 463.5 megawatts of development in 2025. Vacancy across Austin and neighboring counties sits at 1.8%, with 96% of pipelines pre-leased before first steel arrives. This tight market pushes developers to scout land farther east toward Bastrop and south toward San Marcos, expanding the functional footprint of the Austin data center market. Williamson County remains the anchor thanks to Samsung’s fab and a cluster of AI-centric startups spun out of the University of Texas. Proximity to I-35 and SH-130 arterials ensures efficient logistics for heavy equipment, a key advantage over more congested Dallas sub-markets.
Austin’s integration into the Texas Triangle gives enterprises the option to architect active-active-active replication across Dallas, Austin, and Houston, achieving sub-5 millisecond intra-state latency. Fiber Path ownership diversity has improved after the 2024 completion of three new long-haul routes, reducing single-point-of-failure risk. Renewable developers favor west-to-east transmission corridors that terminate near Austin load centers, allowing campuses to contract multi-decade PPAs tied to new build wind and solar farms. The state’s deregulated energy market further shortens procurement cycles compared with regulated peers, speeding time-to-market for capacity additions within the Austin data center market.
Within city limits, zoning overlays along Burnet Road and Metric Boulevard limit building heights to preserve residential sightlines, nudging large campuses to suburban municipalities that offer expedited permitting. Bastrop County’s USD 1.4 billion EdgeConneX approval and Milam County’s USD 3 billion SB Energy project highlight regional governments’ readiness to trade tax abatements for job creation. Meanwhile, Laredo’s 50,000-acre Data City Texas concept underscores Texas’s ambition to host multi-gigawatt clusters tied directly to renewable-rich load pockets. Taken together, these geographic dynamics position the Austin data center market as an operational command center for statewide digital-infrastructure expansion.
Regulatory Landscape
Regulation of the Austin data center market is shaped by Texas incentive policy, ERCOT and Public Utility Commission of Texas oversight of large-load interconnections, and local permitting and resource-management actions across Central Texas. Texas offers a state sales tax exemption for qualifying data centers (6.25% state sales tax) tied to minimum investment and job thresholds administered through the Texas Comptroller; however, the exemption is in a review cycle. State leaders and committees have signaled potential changes ahead of the 2027 legislative session, with an interim hearing scheduled for July 27, 2026 to examine data center incentives.
In parallel, large-load governance tightened after the Texas Legislature expanded the Public Utility Commission of Texas role in reviewing major interconnection requests in May 2025. On June 10, 2026, the Governor directed the PUCT and ERCOT to develop recommendations that align data center interconnection and infrastructure costs with the loads creating them, with the PUCT instructed to initiate actions by July 31, 2026 addressing transmission cost allocation concerns. At the municipal and county level, constraints are increasingly tied to water use, drought planning, and zoning, which can shift siting toward jurisdictions with clearer capacity pathways. Austin policy discussions in 2026 included proposals around disclosure of projected water consumption, drought-condition curtailment plans, and renewable energy offset requirements, while San Marcos City Council denied a large data center proposal in February 2026 and Hays County discussed a moratorium framework for high industrial water use. These actions raise compliance and community-engagement requirements for developers, alongside technical adherence to tier and availability standards benchmarked against Uptime Institute classifications.
Value Chain Analysis
The Austin data center value chain starts with land aggregation and entitlement, then moves through grid and fiber access (interconnection applications, transmission capacity planning, and carrier on-ramps), facility design and construction, and then equipment procurement, commissioning, and ongoing operations. In Austin, operators such as Digital Realty and CyrusOne operate at the platform layer, delivering powered shells alongside interconnection ecosystems and staged expansion across multi-building campuses. Power sourcing and grid integration remain an upstream dependency, since most large facilities rely on ERCOT market procurement and must secure transmission capacity and interconnection approvals early to reduce schedule slippage. This makes utility coordination, ERCOT processes, and Public Utility Commission of Texas large-load reviews key gating steps before full buildout.
Downstream, the supply chain is influenced by tax policy and resiliency requirements. Under Texas rules, exempted items tied to qualifying data center projects can include servers and storage, networking gear, cooling systems, emergency generators, and certain electrical and plumbing infrastructure, which affects capex planning and vendor selection across MEP and IT stacks. At the operations layer, service providers span facilities management, security, and energy management, with tier targets (Tier II through Tier IV) shaping redundancy, commissioning depth, and maintenance regimes. As AI-driven rack densities rise, the cooling technology ecosystem (liquid-ready mechanical designs, water-reduction strategies, and electrical distribution designed for higher power per rack) becomes a differentiator inside the Austin value chain, influencing both construction partners and long-term operations and maintenance specialization.
Competitive Landscape
Competition in the Austin data center market features a mix of publicly traded REITs, private-equity-backed specialists, and new-entrant development platforms. Digital Realty operates an 86,000-square-foot carrier hotel on East 7th Street that anchors regional interconnection with more than 15 network providers digitalrealty.com. Switch continues to scale its Tier 4 Gold-certified campus in Pflugerville, leveraging proprietary hot-aisle containment to support 65 kilowatt racks without active liquid cooling. Sabey Data Centers entered the market in 2024 with a 430,000-square-foot facility and promptly secured the Texas Advanced Computing Center as anchor tenant sabeydatacenters.com.
Aligned Data Centers, freshly capitalized with USD 12 billion, is adopting a gigawatt-ready template, front-loading electrical infrastructure to shrink deployment cycles to less than eight months. The firm’s OCP Ready for Hyperscale designation positions it to court GPU cluster tenants searching for open-compute bare metal at scale aligneddc.com. White-space newcomers like Tract and EdgeConneX target 500-acre parcels that can host multiple multi-story data halls, signaling a pivot toward industrial-park style planning. Fiber-network owners such as Zayo and Telia Carrier deepen ecosystem stickiness by adding diverse on-ramps across both suburban and downtown sites, strengthening Austin’s role as an interconnection gateway for Central Texas.
Technology differentiation revolves around cooling efficiency, renewable energy integration, and on-site power resilience. Operators deploy rear-door heat exchangers, immersion tanks, or dielectric-fluid baths to tackle AI rack densities exceeding 200 kilowatts. Renewable integration strategies range from direct utility-scale PPAs to co-locating solar arrays on warehouse rooftops. Aligned’s partnership model bundles stranded gas-to-power turbines for resilience, whereas Digital Realty focuses on utility green tariffs. The strategic imperative to marry large-scale capacity with high renewable matching levels favors well-capitalized players able to underwrite transmission upgrades and long-duration storage, suggesting gradual consolidation around a handful of mega-platforms over the next decade.
Austin Data Center Industry Leaders
Digital Realty Trust Inc.
CyrusOne LLC
QTS Realty Trust Inc.
DataBank Ltd.
Aligned Data Centers
- *Disclaimer: Major Players sorted in no particular order

Market Opportunities and Future Outlook
Opportunities in the Austin data center market center on reducing resource and permitting friction while meeting hyperscale delivery timelines. The market already operates with tight capacity planning (with the report context citing a large share of pipeline pre-leased), and 2026 policy actions in Austin and at the state level have pushed water, power, and cost-allocation transparency higher in project selection and design. This supports whitespace for campuses that can document low-water cooling approaches and drought-response operating plans, as well as for developments that secure clearer power pathways through early engagement with ERCOT processes and the Public Utility Commission of Texas large-load review framework. Texas sales tax exemptions on eligible equipment, administered by the Texas Comptroller, also remain a cost lever for projects meeting the investment and job thresholds, and the announced July 27, 2026 interim hearing on incentives highlights the need to structure projects to stay compliant if program terms change.
Geographically, policy and infrastructure signals support continued dispersion beyond the Austin urban core into corridor and exurban submarkets where large parcels and utility coordination are more feasible. Tract expanding the Caldwell Valley Technology Park to 3,000 acres and Amazon Data Services acquiring 1,300 acres near Cedar Creek in Bastrop County (both in July 2026) illustrate how developers and hyperscalers are securing land positions around Austin to enable multi-hall, power-dense deployments outside the most constrained municipal zones. On the capital side, Digital Realty's March 2026 final close of a USD 3.25 billion US hyperscale data center fund reflects sustained funding for U.S. hyperscale capacity, supporting phased capacity additions in markets including Austin where renewable procurement mechanisms and regional enterprise demand are already established.
Recent Industry Developments
- July 2026: Amazon Data Services acquired 1,300 acres of land near Cedar Creek in Bastrop County. The land acquisition expands the Austin area data-center footprint and supports proximity to growth corridors for hyperscale deployments.
- July 2026: Tract expanded Caldwell Valley Technology Park in Caldwell County to 3,000 acres. The expansion adds a major submarket facility to Austin metro and enables multi-hall, power-dense deployments within a single park.
- March 2026: Digital Realty final close of a 3.25 billion US Hyperscale Data Center Fund. The fundraising milestone supports hyperscale deployments in the Austin market and catalyzes large-scale capacity while strengthening incumbent leadership.


Research Methodology Framework and Report Scope
Market Definition and Coverage
For this methodology, the Austin data center market covers third-party and self-operated facilities in the Austin metro that provide powered white space capacity, measured in installed and committed IT load (MW and GW).
Scope exclusions: We exclude purely on-premise server rooms inside non-data center buildings and temporary mobile units that are not part of a commercial site footprint.
Segmentation Overview
- By Data Center Size
- Small
- Medium
- Large
- Massive
- Mega
- By Tier Type
- Tier 1 and 2
- Tier 3
- Tier 4
- By Data Center Type
- Cloud Service Providers (CSPs)
- Enterprise, Modular and Edge
- Colocation
- Utilized
- Colocation Type
- Retail
- Wholesale
- Hyperscale
- End User
- Cloud and IT
- Telecom
- Media and Entertainment
- Government
- BFSI
- Manufacturing
- E-Commerce
- Other End User
- Colocation Type
- Utilized
Data Sources, Market Sizing, and Validation
Desk Research
Desk research is used to build the local demand and supply context, before any sizing assumptions are finalized. We mainly review public power and infrastructure signals that directly affect data center capacity delivery timelines, such as interconnection queues, major transmission additions, and electricity generation mix.
Sources referenced include public and official materials such as US Energy Information Administration data, Federal Energy Regulatory Commission filings, Texas state energy and utility commission publications, US Census Bureau business statistics, and local economic development announcements, followed by company filings, investor presentations, and reputable press coverage. Where it helped, we also used a paid subscription for company financials and another paid subscription for an import and export shipment-level view to sanity check equipment demand timing. This list is not exhaustive, and many other sources were also reviewed to collect data, validate assumptions, and clarify open questions.
Primary Interviews and Surveys
We use interviews and surveys with data center developers, operators, infrastructure advisers, utility specialists, and enterprise technology managers involved in the United States market. Respondents help clarify Austin construction schedules, expected utilization, pricing conditions, power availability, and projects that public filings may not yet show. Their input is compared with the capacity model and secondary records before final adjustments are made.
Distribution of primary research fieldwork respondents
| Company type | Respondent position | Region |
|---|---|---|
| Top tier: 30% | CXOs: 15% | |
| Mid tier: 50% | Functional/Unit leaders: 35% | |
| Smaller Players: 20% | Managers: 50% |
Market-Sizing & Forecasting
Sizing is built using a top-down approach where metro-level capacity is reconstructed from active facility inventory, pipeline additions, and power availability constraints, which are then mapped into usable IT load. That output is corroborated with selective bottom-up approximations, such as sampled site-by-site capacity rollups, channel checks on delivered electrical gear, and a reasonability check using typical MW-per-building ranges.
Key inputs used in the model include installed and under-construction capacity, preleasing and vacancy direction, utility service territory signals (where new substations and transmission upgrades unlock new sites), typical build-to-energization timelines, and shifts in rack density that change MW absorption per hall. For forecasting, we used scenario analysis supported by short-cycle indicators from interviews, since the biggest swing factor is timing of power delivery and construction completion rather than a smooth demand curve. Where a facility's public MW disclosure was missing, capacity was imputed using standardized building size signals and typical power-to-floor ratios, and then re-checked with primary feedback.
Data Validation & Update Cycle
Findings are validated through triangulation across supply pipeline tracking, utility and permitting signals, and repeated checks with interviewees when numbers move unexpectedly. If the model produces unusual step changes, the assumptions are re-opened, and the source trail is reviewed before the output is accepted.
A second analyst reviews inputs, unit conversions, and the logic for inclusions and exclusions, followed by a final pre-release review so the latest market events are reflected. Reports are refreshed annually, and interim updates are made when material capacity announcements, power constraints, or project cancellations meaningfully change the outlook.
Mordor Intelligence's Austin Data Center Market Size Versus Other Published Estimates
Published estimates for Austin data centers can look far apart because some sources report development pipeline activity, while others report installed capacity, and the boundary between Austin alone versus the Austin-San Antonio corridor is not always kept consistent.
By tracking site-level commissioned IT load and refreshing corridor overlap checks, Mordor Intelligence keeps the Austin-only capacity number tied to energization timing and not just under-construction headlines, which is why spreads show up when a corridor view is used or when planned sites are counted early.
Benchmark comparison
| Source | Market Size | Gaps in Research Methodology |
|---|---|---|
| Mordor Intelligence | USD 1.54 B (2025) | |
| Real Estate Advisory A | USD 0.47 B (2025) | Uses Austin-San Antonio under-construction MW as a proxy for market size, so commissioned capacity and existing inventory are not fully reflected, and timing is anchored to active builds only. |
| Industry Brief B | USD 2.19 B (2024) | Blends planned and announced campus capacity into the current year and applies a single utilization view, which can overstate near-term size when power delivery dates slip. |
Across the three sources, the main driver of variance is what gets counted as live capacity versus pipeline, and whether the corridor is combined with Austin. Our approach stays repeatable because the total is built from observable capacity milestones, with adjustments only when construction and power-readiness signals change.


Key Questions Answered in the Report
What is the projected capacity of the Austin data center market by 2031?
The Austin data center market is forecast to reach 2.19 gigawatts by 2031, supported by a 6.05% CAGR driven by hyperscaler expansion and semiconductor-edge demand.
Which facility size segment is growing the fastest?
Mega-scale campuses larger than 100 megawatts are expected to advance at a 9.05% CAGR through 2031, outpacing other size categories as AI workloads demand higher power density.
Why are Tier 4 data centers gaining traction in Austin?
Financial-services, healthcare, and public-sector clients require 99.995% uptime, pushing operators to build fault-tolerant Tier 4 sites that address strict compliance needs and grid-resilience concerns.
How do Texas tax incentives impact data center economics?
Chapter 312 abatements and sales-tax exemptions on equipment can lower total-cost-of-ownership by nearly 9% over a 20-year lifecycle, encouraging multi-phase developments in Austin.
What role do renewable-energy PPAs play in Austin’s data-center growth?
ERCOT congestion-zone reforms let operators secure long-term wind and solar PPAs below retail rates, enabling campuses to target 80–90% hourly renewable matching and meet sustainability goals.
How significant is the semiconductor industry to local data-center demand?
Samsung’s USD 45 billion Taylor fab and the broader “Silicon Hills” supply chain generate terabytes of real-time data that must be processed nearby, creating sustained incremental demand for high-density compute in the Austin data center market.
Page last updated on:






