
Audiological Devices Market Size and Share
Market Overview
| Study Period | 2020 - 2031 |
|---|---|
| Market Size (2026) | USD 14.81 Billion |
| Market Size (2031) | USD 19.71 Billion |
| Growth Rate (2026 - 2031) | 5.86 % |
| Fastest Growing Market | Asia-Pacific |
| Largest Market | North America |
| Market Concentration | Medium |
Major Players *Disclaimer: Major Players sorted in no particular order Image © Mordor Intelligence. Reuse requires attribution under CC BY 4.0. | |
Audiological Devices Market Analysis by Mordor Intelligence
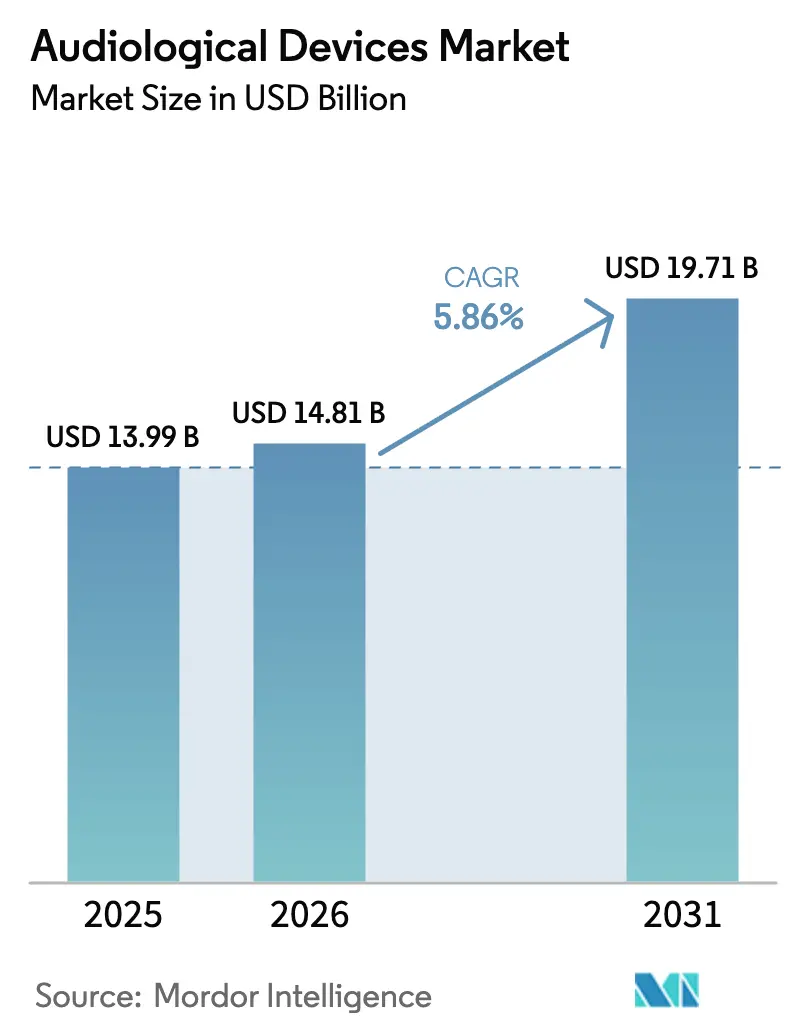
The Audiological Devices market size is expected to grow from USD 13.99 billion in 2025 to USD 14.81 billion in 2026 and is forecast to reach USD 19.71 billion by 2031 at 5.86% CAGR over 2026-2031. Rising life expectancy, rapid digitalisation of hearing aids, and favourable regulatory updates such as the United States over-the-counter (OTC) rule are expanding both clinical and retail channels for hearing care.[1]Source: U.S. Food and Drug Administration, “FDA Finalizes Historic Rule Enabling Access to Over-the-Counter Hearing Aids for Millions of Americans,” fda.gov A growing base of older adults is intensifying device demand, while artificial intelligence (AI) integration is lifting premium product performance and pricing power. Broader newborn and elderly screening initiatives foster early diagnosis, which in turn stimulates sales of diagnostic instruments and software. Connectivity features built on Bluetooth LE Audio and Auracast are blurring the line between medical and consumer devices, opening fresh partnership opportunities with electronics brands. However, high out-of-pocket costs and variable insurance cover remain barriers in several regions.
Key Report Takeaways
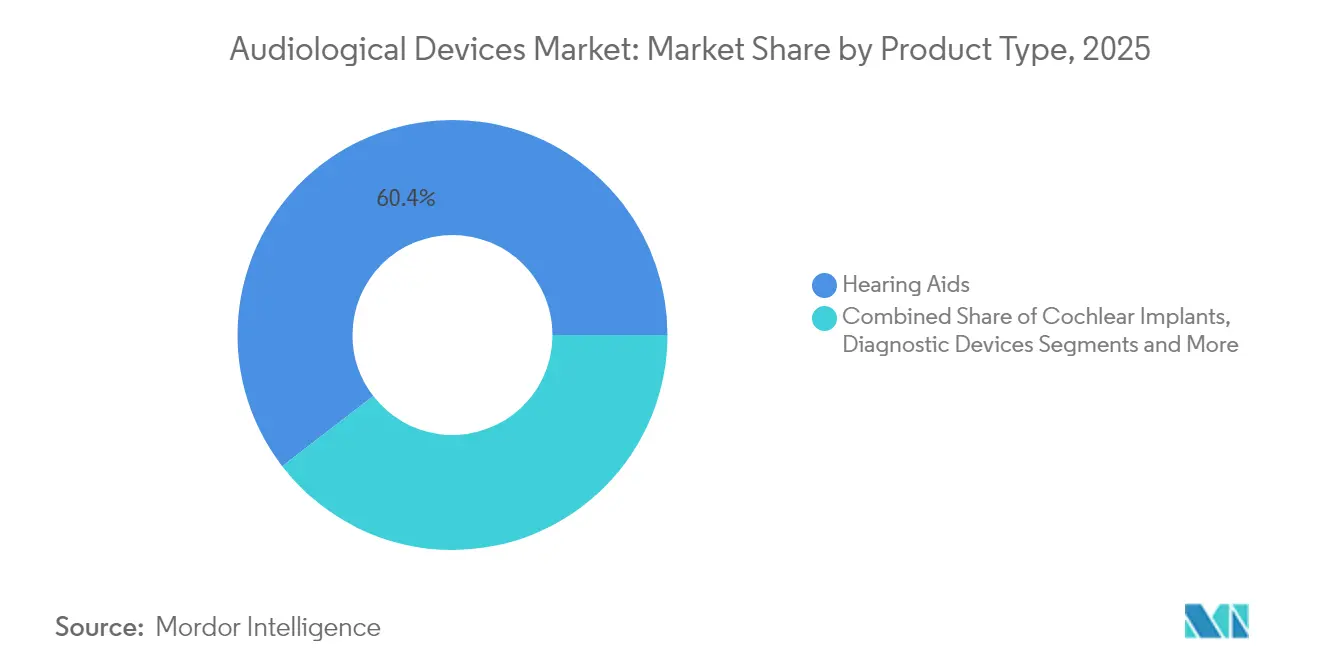
- By product type, hearing aids held 60.44% of audiological devices market share in 2025; diagnostic devices are projected to expand at 6.93% CAGR through 2031.
- By disease type, Meniere’s disease led with 29.21% revenue share in 2025, whereas otosclerosis is forecast to grow at 6.59% CAGR to 2031.
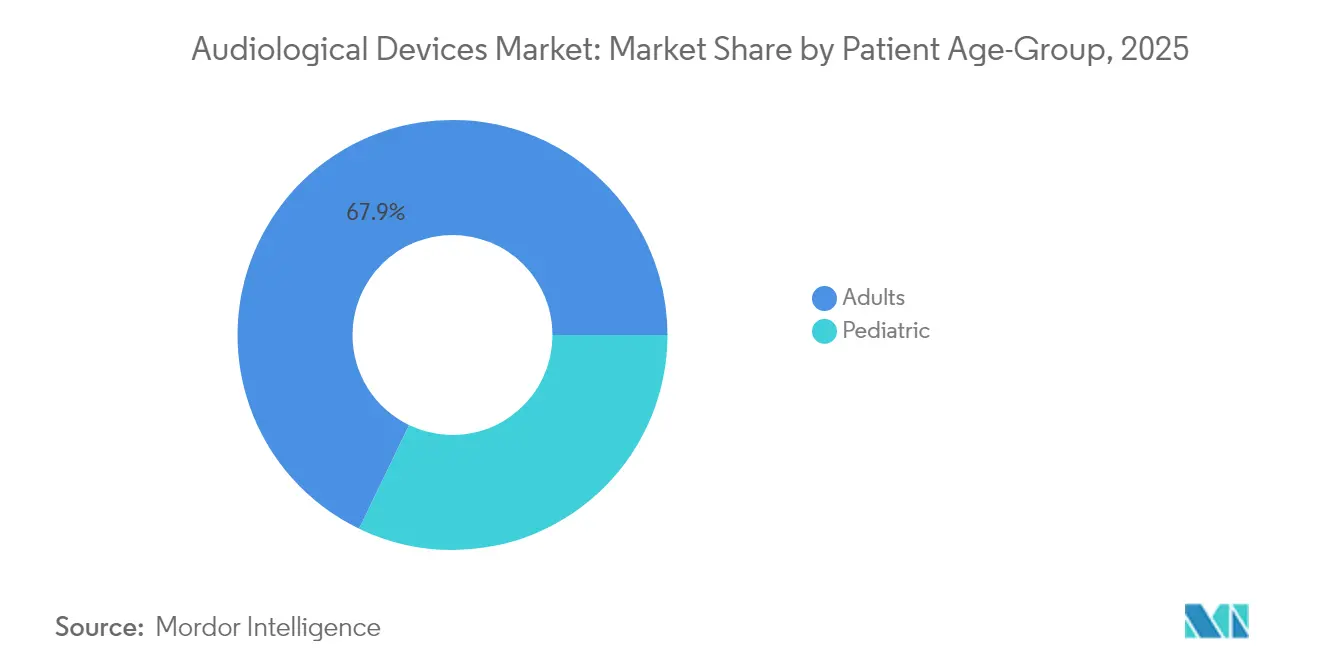
- By patient age group, adults commanded 67.85% of the audiological devices market size in 2025, while paediatrics is advancing at 6.3% CAGR during 2026-2031.
- By end user, hospitals led with 45.30% share of the audiological devices market size in 2025; ear-nose-throat (ENT) clinics are growing fastest at 7.28% CAGR to 2031.
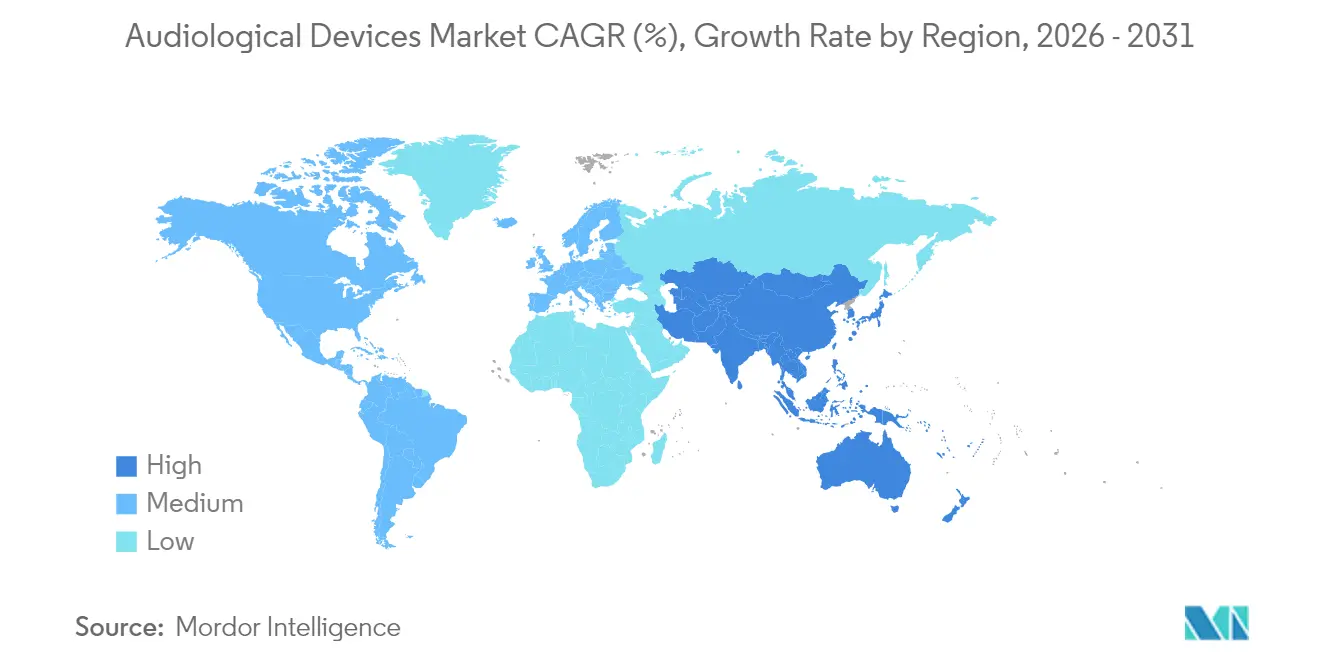
- By geography, North America held 34.12% of audiological devices market share in 2025, while Asia-Pacific shows the highest regional CAGR at 7.71% for 2026-2031.
Note: Market size and forecast figures in this report are generated using Mordor Intelligence’s proprietary estimation framework, updated with the latest available data and insights as of 2026.
Market Trends and Insights
Drivers Impact Analysis of Audiological Devices Market*
| Driver | (~) % Impact on CAGR Forecast | Geographic Relevance | Impact Timeline |
|---|---|---|---|
| Aging Population and Rising Prevalence of Hearing Loss | +2.1% | Global, with highest impact in North America, Europe, and Japan | Long term (≥ 4 years) |
| Rapid Adoption of Digital and Bluetooth-Enabled Hearing Aids | +1.8% | Global, led by developed markets in North America and Europe | Medium term (2-4 years) |
| Government-Led Newborn and Elderly Hearing-Screening Programs | +0.9% | Global, with early gains in developed countries and expanding to emerging markets | Medium term (2-4 years) |
| High Noise-Exposure Levels in Urban and Industrial Settings | +0.7% | Global, particularly in manufacturing-heavy regions like Asia-Pacific and industrial centers | Long term (≥ 4 years) |
| OTC Hearing-Aid Legislation Unlocking Untapped Consumer Base | +1.2% | North America initially, expanding to Europe and other developed markets | Short term (≤ 2 years) |
| Tele-Audiology Platforms Accelerating Rural Market Penetration | +0.6% | Global, with highest impact in rural areas of developing countries | Medium term (2-4 years) |
| Source: Mordor Intelligence | |||
Aging Population and Rising Prevalence of Hearing Loss
Worldwide demographic ageing is lifting baseline demand as bilateral loss affects 37.9 million Americans and 90.7% of adults above 80 years. This demographic shift creates sustained demand pressure, as age-related hearing loss typically begins with high-frequency deficits that progressively impact speech comprehension in noisy environments. Age-related deficits diminish speech comprehension, increase cognitive decline risk, and reduce workforce productivity, prompting public and private stakeholders to invest in early intervention and rehabilitation.
Rapid Adoption of Digital and Bluetooth-Enabled Hearing Aids
Bluetooth LE Audio and Auracast broadcast functions are now baseline in premium lines, enabling direct links to public address systems and smartphones. Brands such as ReSound, Beltone, and Phonak integrate these features to deliver 10 dB signal-to-noise gains and 45% listening-effort reduction. This connectivity revolution extends beyond entertainment to healthcare integration, with devices now capable of real-time health monitoring and telehealth consultations, positioning hearing aids as comprehensive wellness platforms rather than single-purpose medical devices.
Government-Led Newborn and Elderly Screening Programmes
Systematic hearing screening initiatives demonstrate measurable impact on early detection rates and intervention outcomes, particularly in underserved populations where traditional healthcare access remains limited. Tele-enabled screening pilots like the North STAR trial in rural Alaska improved follow-up to 68.5% versus 32.1% for standard referrals, underscoring technology’s role in early detection. Digital ENT assessments show 85% sensitivity compared with 20% for traditional methods, boosting efficiency without compromising safety. The integration of tympanometry with mobile health screening significantly improves detection sensitivity, particularly in environments with high infection-related hearing loss prevalence, establishing new protocols for global hearing health initiatives.[2]Source: Ear and Hearing, “Demographic and Audiological Characteristics of OTC Candidates,” earandhearing.com
High Noise Exposure in Urban and Industrial Settings
Occupational studies report 34.69% loss prevalence among Iranian factory workers, while complex impulse noise requires kurtosis-adjusted measures to predict injury risk. Urban traffic noise raises tinnitus incidence, highlighting a need for both prevention and advanced rehabilitation devices. These multifaceted exposure patterns drive demand for sophisticated hearing protection and rehabilitation technologies, including specialized devices for specific occupational sectors such as dental professionals, who show 15-25% prevalence of hearing thresholds exceeding ISO standards.
Restraints Impact Analysis of Audiological Devices Market*
| Restraint | (~) % Impact on CAGR Forecast | Geographic Relevance | Impact Timeline |
|---|---|---|---|
| High Upfront Device and Fitting Costs | -1.4% | Global, with highest impact in emerging markets and underinsured populations | Long term (≥ 4 years) |
| Persistent Social Stigma Among Younger Demographics | -0.8% | Global, particularly in image-conscious markets like Asia-Pacific and urban centers | Medium term (2-4 years) |
| Patchy Reimbursement in Many Emerging and Developed Markets | -1.1% | Global, with varying impact by healthcare system structure | Long term (≥ 4 years) |
| Semiconductor Supply-Chain Disruptions Impacting Production | -0.9% | Global, with highest impact on manufacturers with Asian supply chains | Short term (≤ 2 years) |
| Source: Mordor Intelligence | |||
High Upfront Device and Fitting Costs
High upfront costs for devices and fittings pose a significant barrier to the growth of the audiological devices market. Many potential users, especially in emerging economies, find these expenses prohibitive. This financial hurdle limits the accessibility of audiological solutions, curbing market expansion. Average premium hearing aid bundles exceed USD 4,000 per pair, deterring adoption where insurance coverage is limited. Cost-sensitive buyers may postpone purchase or switch to basic amplification products, tempering revenue growth. As a result, manufacturers and providers are exploring innovative financing options and subsidies to mitigate this challenge and broaden their market reach.
Persistent Social Stigma Among Younger Users
Style concerns delay help-seeking, particularly in image-conscious urban markets. Fashion-centric solutions such as smart earbuds and eyewear-based amplifiers aim to normalise device use. Highlighting the impact of social perceptions, younger individuals often shy away from using audiological devices due to prevailing societal judgments. This reluctance not only curtails the potential user base but also stifles the overall growth of the audiological devices market.
*Our forecasts treat driver/restraint impacts as directional, not additive. The impact forecasts reflect baseline growth, mix effects, and variable interactions.
Audiological Devices Market Segment Analysis
By Product Type:
AI Integration Drives Premium Hearing Aid EvolutionHearing aids held 60.44% of audiological devices market share in 2025, underpinned by sustained demand from older adults and expanding OTC access. The segment benefits from real-time AI chips that deliver up to 10 dB noise-reduction gains, as seen in Phonak Audéo Sphere Infinio. Receiver-in-the-ear and behind-the-ear styles dominate thanks to space for high-capacity batteries and antennas.
Diagnostic devices are growing fastest at 6.93% CAGR, lifted by broader screening mandates and portable imaging advances such as optical coherence tomography otoscopes. Cochlear implants, bone-anchored aids, and software each target niche needs; fully implantable prototypes from MED-EL and Envoy Medical indicate a future of discreet rehabilitation options.


By Disease Type:
Meniere’s Disease Dominance Reflects Diagnostic ComplexityMeniere’s disease accounted for 29.21% of 2025 revenue owing to its multifaceted symptoms that require both vestibular diagnostics and tinnitus-friendly amplification, sustaining demand for premium solutions. The audiological devices market size for this indication will remain robust as awareness campaigns improve early referral patterns.
Otosclerosis is set to record a 6.59% CAGR, supported by refined stapedectomy techniques and conductive-loss-specific hearing aid algorithms. Acoustic neuroma care integrates surgical navigation with post-operative cochlear implantation, while otitis media continues to drive paediatric diagnostic equipment sales such as tympanometers and ultrasound otoscopes.
By Patient Age-Group:
Adult Segment Stability Contrasts with Paediatric InnovationAdults represented 67.85% of 2025 revenue, reflecting demographic weight and rising appreciation of untreated hearing loss consequences. The audiological devices market size for adults is reinforced by value-added functions like fall detection and cognitive health tracking in premium lines.
Paediatrics advances faster at 6.3% CAGR on the back of universal newborn screening and lower implant age approvals, such as FDA clearance for the Osia System at 5 years. Remote monitoring tools let parents track device performance, while classroom audio integration supports inclusive education.
By End User:
ENT Clinics Emerge as Growth LeadersHospitals held 45.30% revenue share in 2025 due to capacity for surgery and complex diagnostics. ENT clinics are growing quickest at 7.28% CAGR by leveraging portable equipment and cloud data solutions to offer one-stop testing and fitting with lower overheads.
Home healthcare is a nascent but rising channel, as remote fitting and smartphone testing enable aging users to receive professional support without clinic visits. Ambulatory surgery centres gain from minimally invasive cochlear implant techniques that permit same-day discharge.
Geography Analysis
North America Audiological Devices Market
North America captured 34.12% of global revenue in 2025 on the back of advanced infrastructure, strong research pipelines, and the landmark OTC rule that expands retail access. Widespread private insurance and Medicare Advantage plans support premium product uptake, yet patchy traditional Medicare coverage creates affordability gaps.
APAC Audiological Devices Market
Asia-Pacific is the fastest-growing region at 7.71% CAGR through 2031, driven by ageing populations in Japan and South Korea and rising disposable incomes in China and India. Government cochlear implant programmes and expanding private clinics accelerate penetration. Urban industrial zones deepen the need for occupational hearing protection, while growing middle-class awareness boosts adoption of advanced hearing aids.
EMEA and South America Audiological Devices Market
Europe shows steady momentum, supported by universal care models that ensure basic access and stringent regulations that maintain quality. Reimbursement frameworks vary, prompting manufacturers to tailor pricing tiers. Middle East and Africa and South America remain nascent but improving: investments in tertiary hospitals and mobile outreach programmes widen access, while urbanisation lifts noise-related demand.

Regulatory Landscape
In the United States, the FDA created an over-the-counter (OTC) hearing aid category for adults with perceived mild-to-moderate hearing loss, effective October 17, 2022, under 21 CFR Part 874 with specific product codes (QUF, QUG, QUH). This framework broadened retail distribution while keeping medical-device quality expectations through requirements tied to labeling, manufacturing controls, and post-market reporting, including adverse-event submissions to MAUDE and monitoring provisions linked to FDARA Section 709(d).
Beyond hearing aids, the FDA continued to refine ENT-device classifications relevant to audiology. Effective June 10, 2026, the agency classified combined acoustic and electrical external stimulation devices for tinnitus relief as Class II under 21 CFR 874.3410 with special controls. The update clarifies the regulatory pathway for tinnitus-focused products that intersect with amplification and sound-therapy use cases.
Competitive Landscape
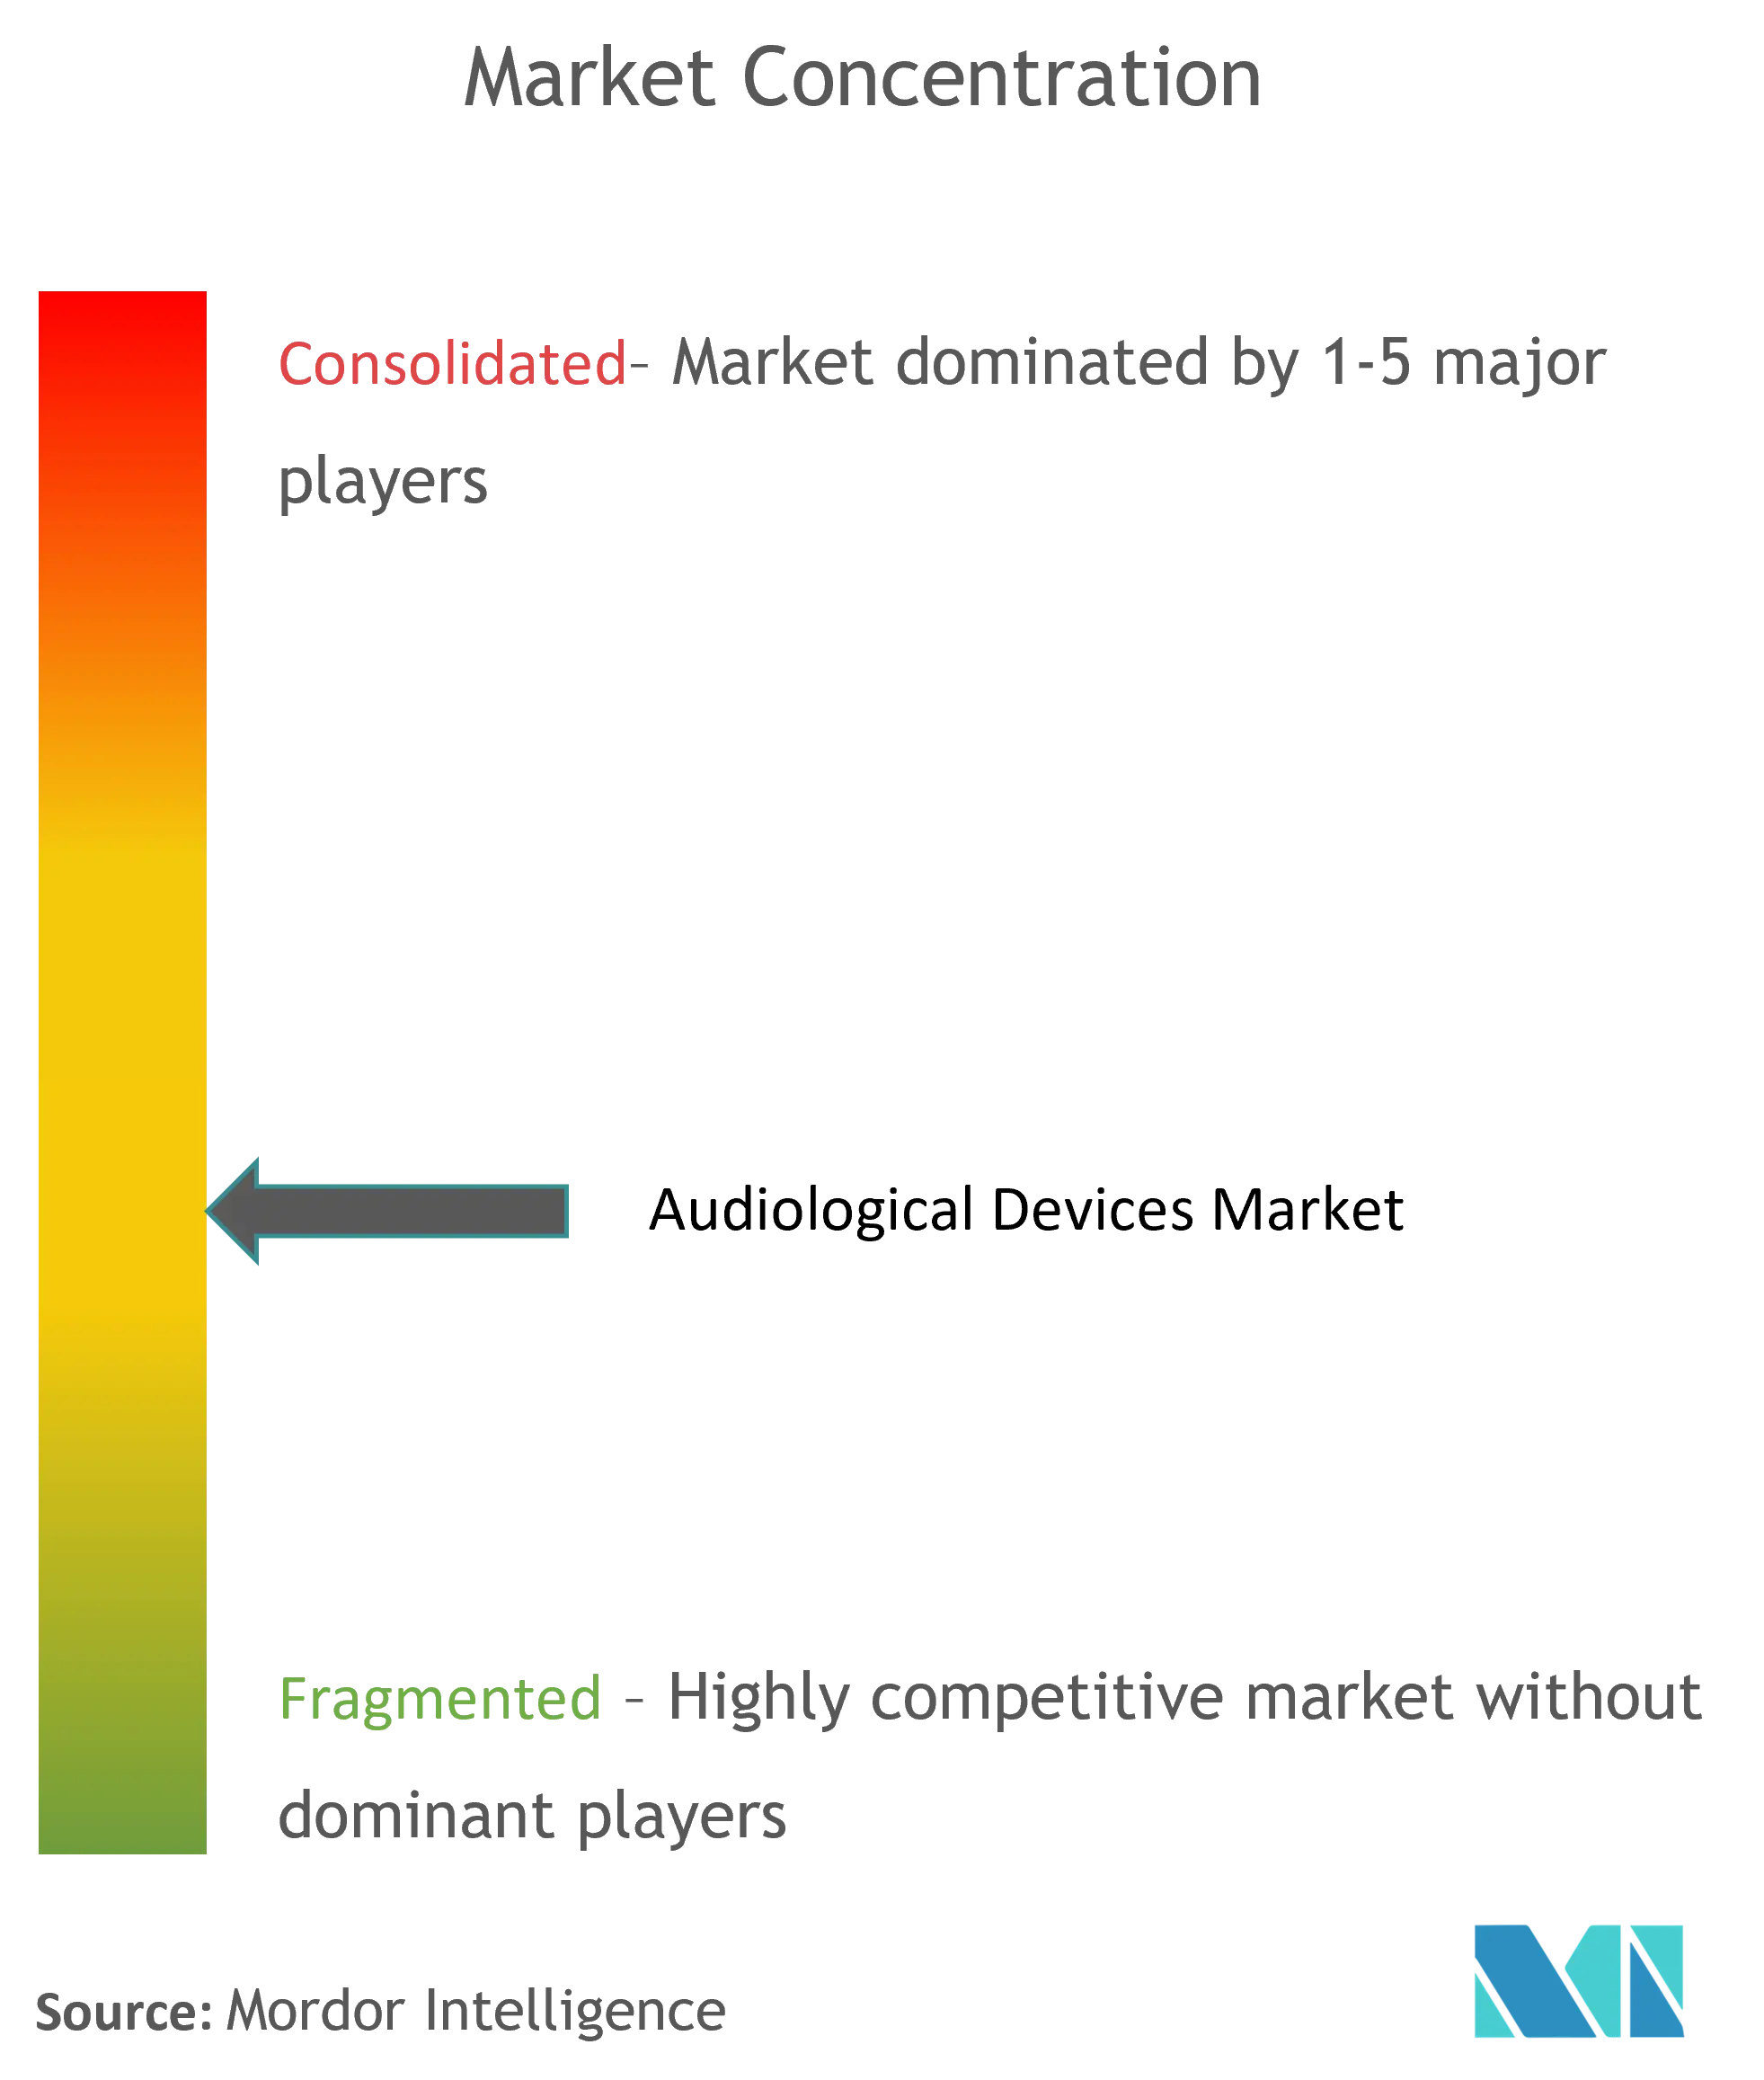
The audiological devices market displays moderate consolidation as leading groups pursue scale to fund R&D while new entrants leverage consumer-electronics know-how. Cochlear’s USD 30 million acquisition of Oticon Medical’s implant unit expanded its portfolio and client base. WS Audiology secured EUR 590 million from ATHOS KG to accelerate growth and possible public listing.
Technology differentiation hinges on AI and connectivity. Phonak’s dedicated AI processor supports speech enhancement, while GN Hearing’s Vivia platform uses Bluetooth LE Audio for multi-stream media access. Consumer players such as Apple integrate hearing assistance into earbuds, intensifying competition and pushing incumbents toward ecosystem partnerships.
Vertical integration and flexible sourcing respond to semiconductor volatility. Manufacturers diversify suppliers and design modular boards to accommodate multiple chipsets, mitigating production risk. Marketing focuses on retail experience: multi-brand clinics, remote service portals, and subscription models aim to lower upfront costs and raise lifetime value.
Audiological Devices Industry Leaders
Audina Hearing Instruments, Inc.
Cochlear Ltd.
GN Hearing A/S
Amplifon SpA
Horentek Hearing Diagnostic
- *Disclaimer: Major Players sorted in no particular order
Audiological Devices Market Companies Covered in this Report
- Sonova
- Demant
- GN Hearing
- WS Audiology
- Cochlear
- Starkey Laboratories
- Amplifon
- Audina Hearing Instruments
- MED-EL
- Natus Medical
- INVENTIS
- Horentek Hearing Diagnostic
- Beltone (GN subsidiary)
- Rion Co. Ltd.
- Eargo
- Elkon Pvt. Ltd.
- Oticon Medical
- Sivantos (Signia)
- Resound
- Interacoustics

Market Opportunities and Future Outlook
The OTC hearing aid framework in the US creates room for differentiated offerings that still meet medical-device expectations, including devices and software designed for safe self-selection, setup, and ongoing monitoring. The opportunity extends into tinnitus-adjacent solutions after the FDA’s June 10, 2026 classification of combined acoustic and electrical external stimulation devices as Class II, which supports more standardized commercialization for products that blend sound therapy and stimulation with conventional hearing-care portfolios.
Care delivery is also evolving. Tele-audiology and remote fitting reduce access barriers in rural and underserved populations and can improve follow-up performance, as reflected in tele-enabled screening pilots such as the North STAR trial in rural Alaska. On the product side, AI-enabled signal processing together with Bluetooth LE Audio and Auracast connectivity is moving expectations across medical and consumer channels, strengthening demand for diagnostic instruments and software that combine screening, fitting, and longitudinal outcome tracking.
Recent Industry Developments in Audiological Devices Market
- July 2026: Cochlear Ltd FDA clearance for Osia 3 Sound Processor (fully rechargeable, first in its class). The approval reinforces Cochlear's leadership in premium implantable solutions and supports faster adoption of the Osia platform.
- March 2026: Amplifon SpA Definitive agreement to acquire GN Store Nord A/S Hearing business for ~DKK 17.0 billion. The deal consolidates global audiology distribution and R&D capabilities, expanding Amplifon's market reach. Vertical integration with GN’s portfolio also improves Amplifon's retail reach and product breadth.
- March 2026: Cochlear Ltd Launched Nucleus Nexa System in India. The launch extends the advanced cochlear implant platform into a large growth market. It broadens geographic footprint and reinforces Cochlear’s position in high-end hearing solutions.


Audiological Devices Market Report Scope and Research Methodology
Market Definition and Coverage
For this study, the audiological devices market means the revenue generated from devices used to test, treat, and support hearing loss, counted at the point where products are sold into clinical, retail, or institutional channels.
Scope exclusions: We do not count routine service fees (fittings, follow-ups, warranties sold as standalone services) unless they are bundled within the device or packaged software sale.
Segments Covered in This Report
- By Product Type
- Hearing Aids
- Behind-the-Ear (BTE)
- Receiver-in-the-Ear (RITE)
- In-the-Ear (ITE)
- Canal Hearing Aids (CHA)
- Bone-Anchored Hearing Aids
- Cochlear Implants
- Diagnostic Devices
- Audiometers
- Tympanometers
- Otoscopes
- Software & Accessories
- Hearing Aids
- By Disease Type
- Otosclerosis
- Meniere’s Disease
- Acoustic Neuroma
- Otitis Media
- Others
- By Patient Age-Group
- Pediatric
- Adults
- By End User
- Hospitals
- ENT Clinics
- Home Healthcare
- Ambulatory Surgery Centers
- Other End Users
- By Geography
- North America
- United States
- Canada
- Mexico
- Europe
- Germany
- United Kingdom
- France
- Italy
- Spain
- Rest of Europe
- Asia-Pacific
- China
- Japan
- India
- Australia
- South Korea
- Rest of Asia-Pacific
- Middle East and Africa
- GCC
- South Africa
- Rest of Middle East and Africa
- South America
- Brazil
- Argentina
- Rest of South America
- North America
Data Sources, Market Sizing, and Validation
Desk Research
Desk research starts with mapping the demand pool and care pathways, then linking them to device categories and selling channels. We typically use public health and demographic sources such as the World Health Organization, the US CDC, the US National Institutes of Health, and national statistics agencies to understand hearing loss prevalence by age, and to estimate the likely diagnosed share.
To connect demand to device spending, we use regulatory and market access signals and the pace of product change. This includes US FDA materials (including updates around OTC hearing aids), customs and trade statistics portals for import-export direction, and peer-reviewed audiology and otology journals for clinical utilization patterns. We also review company filings, investor presentations, association pages, and reputable press to ground product mix and geographic exposure, and we selectively use paid subscriptions for company financials, patent screening, and shipment-level trade checks. The sources mentioned here are illustrative, and many other public and paid references were used to collect data, validate assumptions, and clarify open questions.
Primary Interviews and Surveys
Primary work is used to pressure-test what desk research cannot show clearly, such as the current device mix shifts, realistic price bands, and channel markups that vary by country and end user. We spoke with a balanced set of stakeholders, including audiology clinic operators, hospital buyers, device distributors, and professionals involved in diagnostics, across the main demand regions so the model reflects how purchasing typically happens.
These inputs helped us confirm adoption rates for OTC and prescription pathways, typical replacement cycles, and how inflation or reimbursement changes pass through to average selling prices before the final totals were approved.
Distribution of primary research fieldwork respondents
| Company type | Respondent position | Region |
|---|---|---|
| Top tier: 38% | CXOs: 12% | APAC: 46% |
| Mid tier: 45% | Functional/Unit leaders: 35% | EMEA: 36% |
| Smaller Players: 17% | Managers: 53% | Americas: 18% |
Market-Sizing & Forecasting
Sizing begins with a top-down build where prevalence and diagnosis rates are translated into a treated and tested pool, then converted into device demand through fitting rates, procedure volumes, and replacement timing. For this market, the key inputs include age-group population trends, the share of adults screened or diagnosed, hearing aid replacement intervals, cochlear implant and bone-anchored procedure volumes, and the shift toward rechargeable and connected models that affects pricing.
After the macro build is complete, we corroborate totals with selective bottom-up approximations, such as rolling up a sample of supplier revenues by region, checking distributor channel splits, and validating typical ASP bands for hearing aids and implants against what interviews report. Where a country has limited public detail, we handle gaps by using proxy ratios from similar markets (income level, penetration, and care access), then re-checking with expert feedback.
For forecasting, we mainly apply scenario analysis supported by short trend models, because policy changes like OTC availability and reimbursement updates can move adoption faster than simple straight-line growth. The scenarios are tied to the outlook for penetration rates, product mix, and price progression, then refined based on what practitioners expect for near-term fitting volumes and diagnostic activity.
Data Validation & Update Cycle
Validation is done through several checkpoints to ensure the outputs do not drift away from observable market signals. We compare results against independent indicators like procedure activity, trade direction for key device categories, public health screening emphasis, and the implied per-patient spending, then investigate large variances before conclusions are finalized.
A second analyst review is completed after the first model build, and follow-up calls are triggered when interview feedback shows mismatches on pricing, adoption, or channel behavior. Reports are refreshed annually, and interim updates are made when material events occur, such as major regulatory changes or sharp currency moves. Before delivery, an analyst performs a fresh pass across the model and assumptions so clients receive an updated view.
Mordor Intelligence's Audiological Devices Market Size Measured Against Other Published Estimates
It is common to see different market sizes for audiological devices, even when the topic name looks the same. The differences usually come from what is included as a device, which year is used as the base, and how pricing is converted into a single USD value across regions.
In this study, the refresh cadence and currency timing are treated as active inputs, and ASP progression is recalculated when mix shifts toward rechargeable and connected models change the weighted average price. We then validate this through channel checks and expert confirmation before the number is finalized, a step kept current in the latest update by Mordor Intelligence.
Benchmark comparison
| Source | Market Size | Gaps in Research Methodology |
|---|---|---|
| Mordor Intelligence | USD 14.81 B (2026) | |
| Regional Consultancy A | USD 10.64 B (2024) | Uses an earlier base year and a narrower revenue pool in practice, where diagnostic software and accessories can be treated lightly, and pricing is often carried forward with limited mix-based ASP recalculation. |
| Industry Publication B | USD 5.44 B (2023) | Reports growth over a defined window with a 2023 base, which can understate the current-year level when currency conversion timing, channel expansion effects, and recent price movement are not revalidated each cycle. |
The spread in the table is largely explained by base-year choice and how fully the model refreshes pricing and scope when channels and product mixes change. By keeping assumptions traceable to demand signals and by re-checking FX timing and ASP bands during updates, the approach produces a practical number that can be repeated and challenged with clear inputs.


Key Questions Answered in the Report
What is the current value of the audiological devices market?
The market stood at USD 14.81 billion in 2026 and is projected to reach USD 19.71 billion by 2031.
Which product category leads the audiological devices market?
Hearing aids dominate with 60.44% 2025 market share, supported by AI and connectivity upgrades.
Why is Asia-Pacific the fastest-growing region?
Rapid ageing, expanding middle-class income, and government implant programmes drive a 7.71% CAGR in Asia-Pacific.
How will OTC regulation influence demand?
The United States OTC rule opens a new retail channel for 49.5 million potential users who previously lacked access to prescription devices.
Which end-user segment is growing quickest?
ENT clinics show the highest CAGR at 7.28%, benefitting from specialised services and efficient workflows.
What technology trends shape future product design?
Real-time AI processing, Bluetooth LE Audio, and fully implantable cochlear implants are setting new performance and cosmetic benchmarks.
Page last updated on:


 Your data is secure and never sold or shared.


