
Attention Deficit Hyperactivity Disorder Market Size and Share
Market Overview
| Study Period | 2020 - 2031 |
|---|---|
| Market Size (2026) | USD 18.51 Billion |
| Market Size (2031) | USD 23.78 Billion |
| Growth Rate (2026 - 2031) | 5.15 % |
| Fastest Growing Market | North America |
| Largest Market | Asia-Pacific |
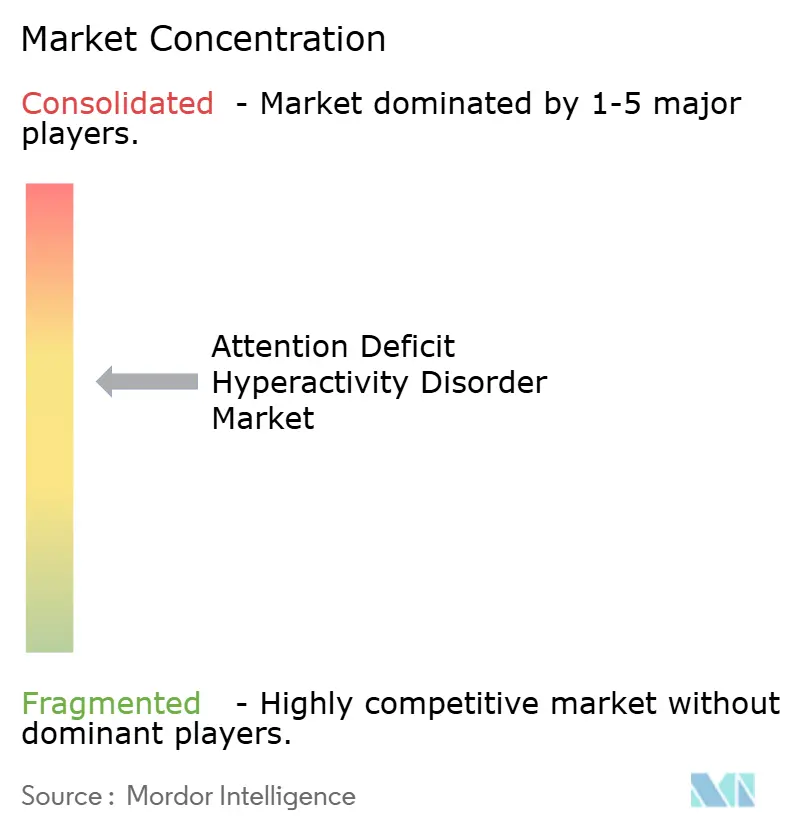
| Market Concentration | Medium |
Major Players *Disclaimer: Major Players sorted in no particular order Image © Mordor Intelligence. Reuse requires attribution under CC BY 4.0. | |
Attention Deficit Hyperactivity Disorder Market Analysis by Mordor Intelligence
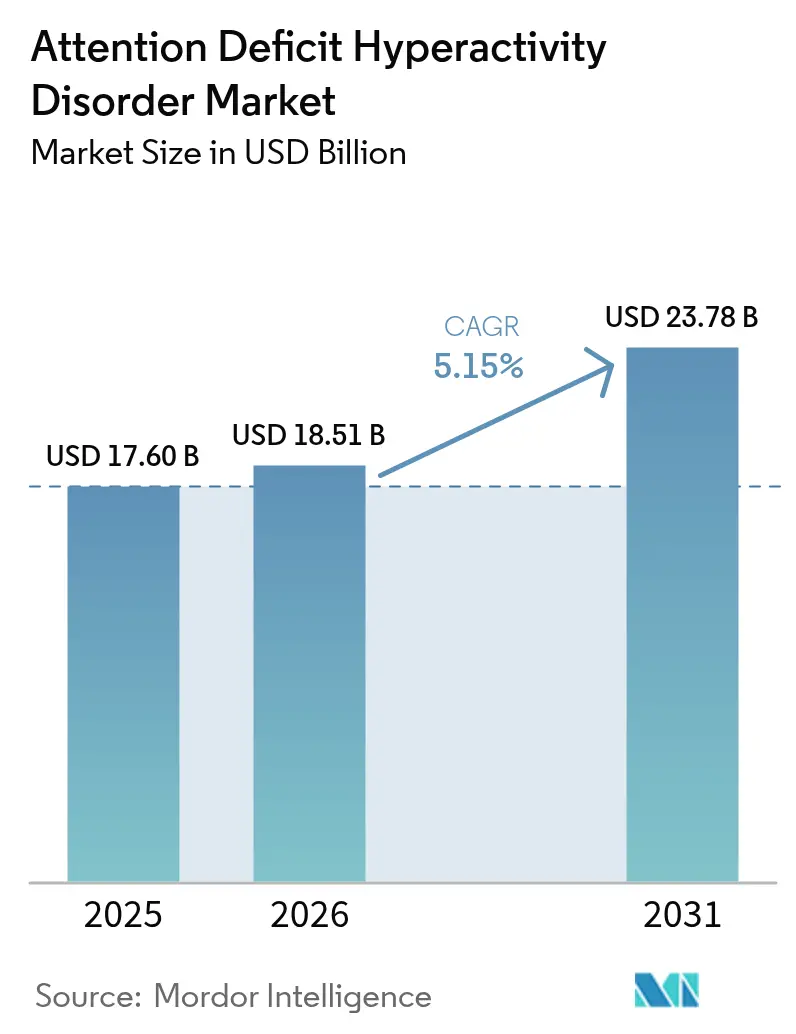
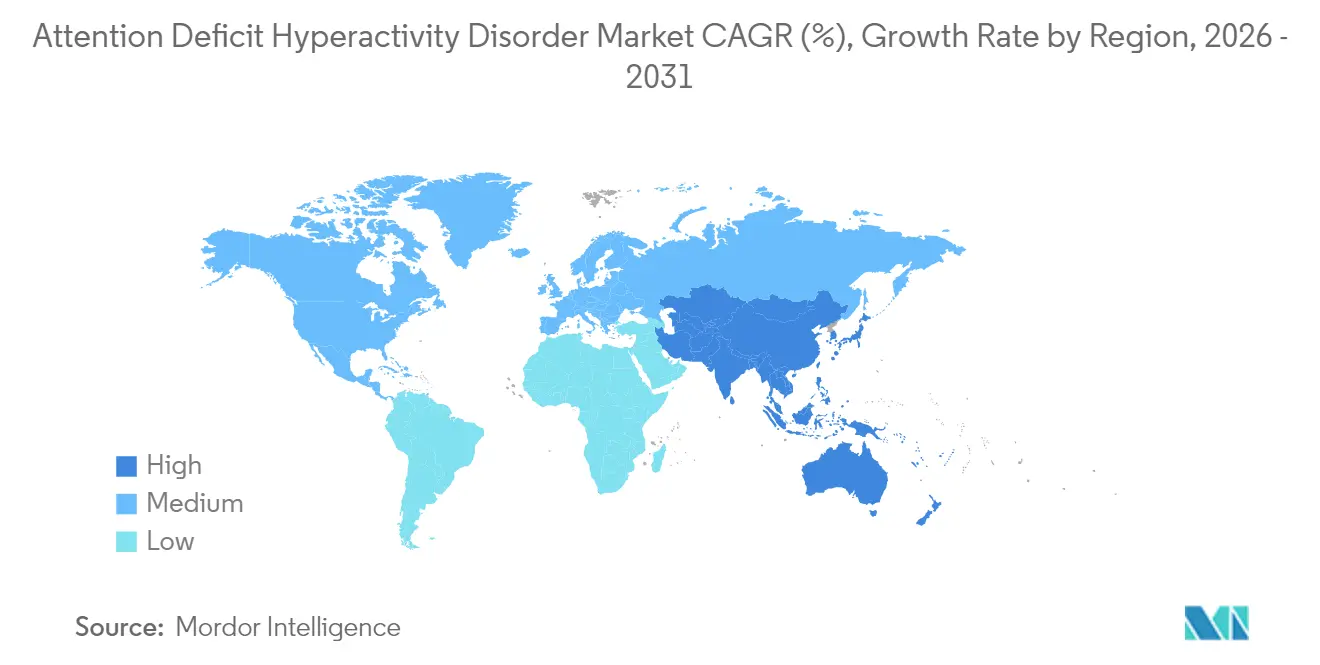
The attention deficit hyperactivity disorder market size was valued at USD 17.60 billion in 2025 and estimated to grow from USD 18.51 billion in 2026 to reach USD 23.78 billion by 2031, at a CAGR of 5.15% during the forecast period (2026-2031). Higher diagnostic vigilance, broader adult recognition, and steady innovation in both stimulant and non-stimulant regimens are expanding treatment volumes. Stimulants still anchor most prescriptions, yet non-stimulants gain momentum as physicians seek options with lower abuse potential. Telehealth services now link specialists to underserved communities, compressing wait times for evaluation and prescription fulfilment. North America holds a 42.45% revenue lead thanks to mature reimbursement systems, whereas Asia-Pacific posts the quickest regional climb at 6.54% CAGR, reflecting rising awareness and policy reform.
Key Report Takeaways
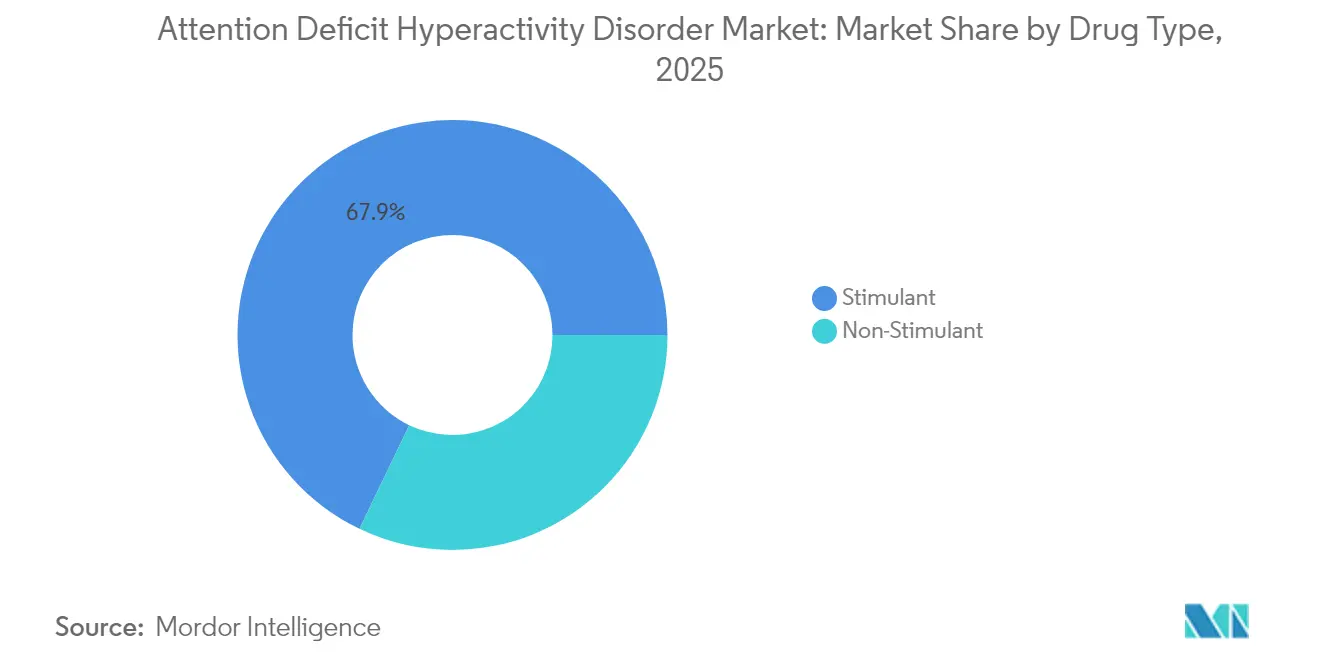
- By drug type, stimulants led with 67.88% of Attention Deficit Hyperactivity Disorder market share in 2025, while non-stimulants are projected to register a 7.32% CAGR to 2031.
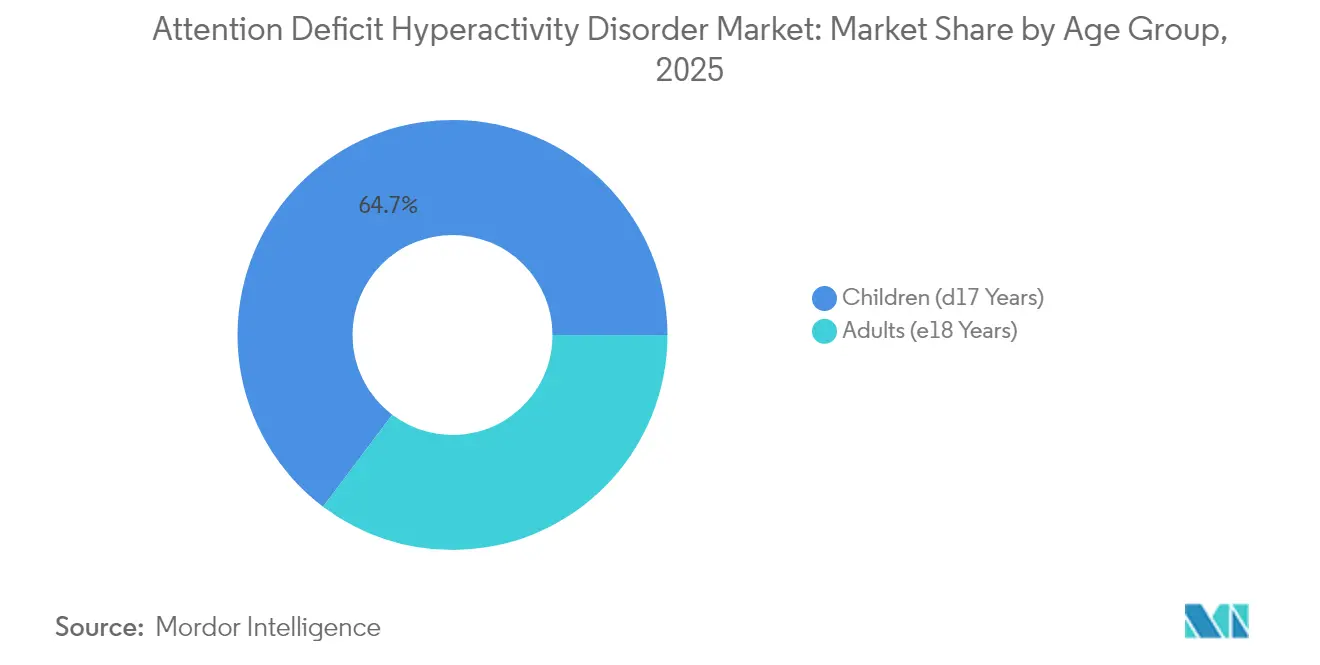
- By age group, the pediatric cohort captured 64.72% revenue in 2025; the adult segment is set to expand at an 8.09% CAGR through 2031.
- By distribution channel, retail pharmacies held 54.12% of the Attention Deficit Hyperactivity Disorder market size in 2025; online pharmacies are forecast to grow at an 8.48% CAGR to 2031.
- By region, North America accounted for 42.02% of 2025 revenue; Asia-Pacific is poised for the fastest 6.42% CAGR by 2031.
Note: Market size and forecast figures in this report are generated using Mordor Intelligence’s proprietary estimation framework, updated with the latest available data and insights as of 2026.
Global Attention Deficit Hyperactivity Disorder Market Trends and Insights
Drivers Impact Analysis*
| Driver | % Impact on CAGR Forecast | Geographic Relevance | Impact Timeline |
|---|---|---|---|
| Rising ADHD Prevalence Worldwide | +1.2% | Global, with highest impact in North America & Europe | Medium term (2-4 years) |
| Growing Awareness And Screening Initiatives | +0.8% | Global, particularly strong in Asia-Pacific | Short term (≤ 2 years) |
| Advancements In Pharmacotherapy And Formulations | +1.0% | North America & EU, expanding to APAC | Long term (≥ 4 years) |
| Supportive Reimbursement And Coverage Policies | +0.7% | North America & Europe | Medium term (2-4 years) |
| Expanding Adult Patient Segment Via Telehealth | +0.9% | Global, led by North America | Short term (≤ 2 years) |
| Integration Of Digital Therapeutics With Medication | +0.6% | North America & EU, early adoption in Japan | Long term (≥ 4 years) |
| Source: Mordor Intelligence | |||
Rising ADHD Prevalence Worldwide
Global prevalence continues climbing: 12.0% of U.S. children aged 3-17 had an ADHD diagnosis in 2023, an uptick that stems from refined diagnostic criteria rather than sudden pathological change[1]Centers for Disease Control and Prevention, “ADHD Data and Statistics,” cdc.gov. Adult diagnoses pass 15.5 million in the United States, half confirmed after age 18, underscoring long-standing underrecognition. China’s school-age prevalence reached 6.4%, with modelling indicating a peak caseload in 2029, signalling sizeable latent demand in emerging economies. Climbing prevalence syncs with prescription volumes; U.S. stimulant scripts rose 57.9% from 2012-2022, sustaining demand across therapeutic classes.
Growing Awareness and Screening Initiatives
Primary-care clinicians increasingly deploy validated screeners, trimming referral delays. The American Professional Society for ADHD and Related Disorders is finalising the first U.S. adult guideline, closing a long-standing gap in standardised assessment pathways. Telehealth broadens access: 46% of diagnosed adults used virtual consultations in 2024 and 30.5% secured prescriptions online. Canadian claims data show a 20% jump in ADHD medication reimbursements during 2024, an indicator of accelerated recognition.
Advancements in Pharmacotherapy and Formulations
Innovation centres on adherence and safety. Tris Pharma earned FDA clearance for Onyda XR, the first liquid non-stimulant enabling bedtime dosing through LiquiXR technology. Cingulate’s CTx-1301 employs timed-release micro-beads to smooth coverage without afternoon boosters, with Phase 3 data supporting once-daily efficacy. Digital therapeutics mature in parallel; EndeavorRx achieved FDA approval for paediatric cognitive training, offering a non-pharmacologic option that sidesteps diversion risk. Axsome’s solriamfetol hit Phase 3 endpoints as the first dopamine-norepinephrine reuptake inhibitor tailored for ADHD.
Expanding Adult Patient Segment via Telehealth
Deferred diagnosis in adults now fuels incremental demand. Professional commitments and stigma formerly limited specialty visits, but synchronous video consults remove geographic and scheduling barriers. Adult women present the fastest-growing sub-segment after historical under-diagnosis, aided by guideline updates that recognise inattentive phenotypes. Tele-prescribing extensions through December 2025 allow controlled substance scripts without initial in-person visits, preserving treatment continuity while rules are finalised. Elevated adult volumes pressure payers to broaden coverage for combined pharmacologic-behavioural programs that mitigate workplace productivity loss.
Restraints Impact Analysis*
| Restraints Impact Analysis | (~) % Impact on CAGR Forecast | Geographic Relevance | Impact Timeline |
|---|---|---|---|
| Diagnostic Challenges And Underrecognition | -0.9% | Global, particularly acute in developing markets | Medium term (2-4 years) |
| High Abuse Liability And Safety Concerns Of Stimulants | -1.1% | Global, strongest impact in North America | Short term (≤ 2 years) |
| Strict Regulatory Controls On Controlled Substances | -0.8% | Global, most restrictive in North America & Europe | Medium term (2-4 years) |
| Cost Containment Pressures From Healthcare Payers | -0.7% | North America & Europe, emerging in APAC | Long term (≥ 4 years) |
| Source: Mordor Intelligence | |||
Diagnostic Challenges and Underrecognition
Subjective symptom scoring and overlap with anxiety or mood disorders complicate clear-cut diagnosis. Absence of a biomarker forces clinicians to rely on multi-informant scales, generating both false negatives and false positives. Research on circulating micro-RNAs such as miR-140-3p advances but is years from routine use. Primary-care providers, especially in resource-limited settings, report low confidence in adult assessment, perpetuating unmet need. Cultural stigma further depresses help-seeking in Asia-Pacific, slowing attention deficit hyperactivity disorder market penetration despite public awareness drives.
High Abuse Liability and Safety Concerns of Stimulants
Federal quotas constrain output of amphetamine and methylphenidate products. DEA 2025 caps increased only marginally despite rising legitimate demand, perpetuating shortages[2]Source: U.S. Federal Register, “Controlled Substances Quotas for 2025,” federalregister.gov. Research from the University of Michigan associates tele-initiated stimulant therapy with higher incident substance-use disorder, intensifying scrutiny. Monthly visit mandates, PDMP checks, and exhaustive documentation erect hurdles that some clinicians avoid. The 2024-2025 Adderall shortfall forced millions into therapeutic switches, spotlighting vulnerabilities in a stimulant-dependent treatment paradigm.
*Our forecasts treat driver/restraint impacts as directional, not additive. The impact forecasts reflect baseline growth, mix effects, and variable interactions.
Segment Analysis
By Drug Type: Non-Stimulants Gain Momentum Despite Stimulant Dominance
Stimulant products generated 67.88% of 2025 revenue, illustrating entrenched efficacy and prescriber familiarity. Yet non-stimulants logged a 7.32% CAGR, exceeding total attention deficit hyperactivity disorder market growth as safety-minded clinicians search for lower diversion risk. Lisdexamfetamine’s patent expiry in 2024 unlocked generic competition; Granules India and Lupin secured FDA approvals, supplying cost-sensitive buyers. DEA production caps pressured amphetamine supply, nudging prescribers toward alternatives such as viloxazine and guanfacine.
Supernus Pharmaceuticals reported Qelbree sales of USD 241.3 million in 2024, a 72% jump year-on-year, signalling robust uptake of novel non-stimulant mechanisms. Atomoxetine use remained steady despite batch recalls elsewhere, underlining persistent need for once-daily options. Liquid clonidine (Onyda XR) now offers paediatric caregivers a nocturnal regimen that circumvents school-time dosing hurdles. Consequently, the attention deficit hyperactivity disorder market size for non-stimulants is forecast to expand faster than any subcategory through 2031.


By Age Group: Adult Recognition Drives Expansion
Paediatric patients accounted for 64.72% of diagnoses in 2025, but adult cases are rising at an 8.09% CAGR. Many adults long mislabelled as “underachieving” now secure formal evaluations, buoyed by professional society guidelines and workplace accommodation policies. Japanese cohort work revealed mood-disorder comorbidity in 60.9% of affected adults, necessitating integrated care. Telehealth proves pivotal: 67.2% of virtual users procured ADHD medications online in 2024, an access vector especially valuable for rural communities.
The attention deficit hyperactivity disorder market size attributable to adult therapies is projected to eclipse USD 10.2 billion by 2031, propelled by format innovations such as CTx-1301 that address eight-hour workdays without midday boosters. Paediatric care is evolving too: behaviour first for under-6s, pharmacotherapy for school-age children when educational performance falters. The CDC counted 2 million untreated U.S. children with ADHD in 2022, highlighting residual opportunity. Holistic family-centred programs now pair parent training with medication, reinforcing adherence and academic gains.
By Distribution Channel: Digital Transformation Accelerates Online Growth
Retail chains remained the prime outlet with 54.12% market share, backed by insurance integration and pharmacist counselling. Still, online pharmacies post the quickest 8.48% CAGR, spurred by same-day delivery and easier shop-around during shortages. Integrated e-prescription systems now auto-route telehealth orders to mail-order fulfilment, shrinking friction. Hospital pharmacies uphold initiation for complex comorbid cases but hold a stable share given outpatient dominance of ADHD treatment.
Specialty pharmacies carve a niche for high-cost or liquid formulations requiring temperature control and adherence coaching. DEA proposals for in-person exams before remote refills loom as a wildcard that could temper online traction. Retail players retaliate by embedding screeners and nurse-led consults in-store, forging a hybrid model. Consequently, the attention deficit hyperactivity disorder market is likely to see blurred channel boundaries rather than a zero-sum shift.
Geography Analysis
North America, with 42.02% 2025 revenue, remains the anchoring geography. In 2023, U.S. pharmacies dispensed 45 million stimulant prescriptions, up from 35.5 million in 2019, indicating pervasive clinical adoption. Canada’s claim volumes climbed 20% in 2024 after provinces widened coverage, reinforcing access. Regional innovation depth is notable: most first-in-class approvals—Onyda XR, solriamfetol, CTx-1301—originated or were trialled here, underscoring a pipeline advantage.
Europe offers a structurally mature but controlled environment. Post-pandemic, prescription volumes ran 16.4% above pre-COVID forecasts by 2022, signalling greater societal comfort with pharmacologic care. The EMA’s green lights for Paxneury and Tuzulby added guanfacine and extended-release methylphenidate choices to paediatric algorithms. Germany spearheads digital therapeutics; EndeavorRx secured CE marking and a reimbursement code, accelerating adoption pathways.
Asia-Pacific delivers the fastest 6.42% CAGR, lifted by policy liberalisation and urbanising populations. Japan’s government-backed biotech incentives catalyse neuroscience start-ups, widening clinical trial capacity. China’s 6.4% paediatric prevalence equates to tens of millions of potential patients as screening scales nationally. India’s manufacturers leverage FDA approvals—such as generic Vyvanse—to supply lower-priced options globally, reinforcing regional affordability. Remaining hurdles include rural service gaps and persisting stigma, but rising digital literacy mitigates some obstacles, suggesting the attention deficit hyperactivity disorder market will experience steady diffusion across megacities first, then into secondary centres.

Regulatory Landscape
Regulatory Landscape: Regulation in ADHD therapeutics continues to center on safety oversight for stimulants and on maintaining supply continuity for non-stimulants across major markets. In the United States, the FDA issued a July 2025 safety communication calling for expanded labeling for extended-release stimulants, including revised Limitation of Use language on pediatric weight-loss risk in children younger than 6 years. This raises sponsor compliance needs and can affect prescribing decisions for early-childhood cohorts.
Across regions, supply management and approvals remain key market inputs. The DEA adjusted Schedule II aggregate production quotas for 2025 after noting that national inventory for substances such as d-amphetamine and methylphenidate was inadequate for patient needs. In parallel, the EMA's shortages framework and the SPOC network monitor shortages of atomoxetine, methylphenidate, and lisdexamfetamine across the EEA. On approvals, the EMA granted marketing authorization in February 2025 for Tuzulby (methylphenidate hydrochloride) for ADHD in children and adolescents (6 to 17 years). In January 2026, the FDA accepted Otsuka's centanafadine NDA for priority review, with a PDUFA target action date of July 24, 2026, reflecting continued regulator engagement across supply-constrained legacy classes and differentiated non-stimulant entrants.
Competitive Landscape
Consolidation meets disruption. Takeda’s Vyvanse patent lapse prompted a USD 900 million restructuring after profit slid 57%, illustrating post-exclusivity pressure. Collegium’s USD 525 million buyout of Ironshore Therapeutics gave it Jornay PM, signalling diversification beyond pain franchises. Supernus’s viloxazine success proves that differentiated non-stimulants can flourish even in a stimulant-heavy arena.
Digital entrants reshape therapeutic hierarchies. EndeavorRx, cleared for paediatric use, obviates controlled-substance protocols and is now reimbursed by multiple U.S. payers. Cingulate’s timed-release approach targets adherence pain points unaddressed by incumbents. Supply volatility also creates openings; companies with robust manufacturing capacity or alternative mechanisms can capture prescriptions when quota-bound competitors run short. Net effect: the attention deficit hyperactivity disorder market exhibits moderate concentration, with roughly 60% of revenue held by the five leading firms, yet ongoing innovation keeps competitive intensity high.
Attention Deficit Hyperactivity Disorder Industry Leaders
Takeda Pharmaceutical Co.
Novartis AG
Johnson & Johnson (Janssen)
Eli Lilly & Co.
Pfizer Inc.
- *Disclaimer: Major Players sorted in no particular order

Market Opportunities and Future Outlook
Market Opportunities and Future Outlook: Near-term whitespace is concentrated in differentiated non-stimulant pharmacotherapy and in regimens designed to improve adherence and caregiver administration. Tris Pharma's Onyda XR received FDA approval in May 2024 as a liquid, extended-release non-stimulant, creating a practical pathway for pediatric-friendly dosing formats that can reduce school-time administration barriers. Supernus's Qelbree (viloxazine ER) commercialization has also been supported by label updates from January 2025 that further articulate mechanism-related data.
Access and channel evolution is another opportunity area where policy decisions influence demand capture across adult diagnosis and follow-up care. The DEA extended telemedicine flexibilities for prescribing controlled substances through December 31, 2026, which supports care continuity for patients managed via virtual psychiatry and primary care, especially in underserved geographies. At the same time, ongoing quota administration and shortage monitoring in the United States and EEA point to operational space for manufacturers that can ensure reliable supply or reduce exposure to Schedule II constraints through non-controlled alternatives. This aligns with late-stage pipeline activity such as Otsuka's centanafadine program, which is under a priority-review NDA with a July 24, 2026 PDUFA date and a Phase 3 study addressing adult ADHD with comorbid anxiety, targeting differentiation around comorbidity-driven treatment selection.
Recent Industry Developments
- June 2026: Otsuka announced positive topline results from a Phase 3b study (NCT06973577) of centanafadine in adults with ADHD and comorbid anxiety, meeting its primary endpoint. The readout supports differentiation around comorbidity management, an increasingly visible need in adult ADHD care pathways, and backs continued momentum toward non-stimulant mechanisms.
- May 2025: Cingulate completed Phase 3 safety testing for CTx-1301 and scheduled an NDA submission for mid-2025. Advancing a once-daily, timed-release formulation aligns with demand for longer coverage without afternoon boosters and increases competitive pressure in the stimulant-heavy segment through formulation-driven differentiation.
- May 2024: Tris Pharma's Onyda XR received FDA approval as a liquid, extended-release non-stimulant for ADHD in children. The approval expands pediatric-friendly dosing formats and supports adherence improvements in school settings.


Research Methodology Framework and Report Scope
Market Definition and Coverage
For this study, the ADHD market is defined as the revenues generated from pharmacological treatments used for managing ADHD symptoms, tracked across key age groups and major pharmacy dispensing channels, and sized at a global level in USD.
Scope exclusions: This sizing excludes non-drug care such as psychotherapy, coaching, school-based services, and digital therapeutics.
Segmentation Overview
- By Drug Type
- Stimulant
- Amphetamine
- Methylphenidate
- Dextroamphetamine
- Dexmethylphenidate
- Lisdexamfetamine Dimesylate
- Non-Stimulant
- Atomoxetine
- Bupropion
- Guanfacine
- Clonidine
- Stimulant
- By Age Group
- Children (<17 Years)
- Adults (>18 Years)
- By Distribution Channel
- Retail Pharmacy
- Hospital Pharmacy
- Online Pharmacy
- Geography
- North America
- United States
- Canada
- Mexico
- Europe
- Germany
- United Kingdom
- France
- Italy
- Spain
- Rest of Europe
- Asia-Pacific
- China
- Japan
- India
- Australia
- South Korea
- Rest of Asia-Pacific
- Middle East & Africa
- GCC
- South Africa
- Rest of Middle East & Africa
- South America
- Brazil
- Argentina
- Rest of South America
- North America
Data Sources, Market Sizing, and Validation
Desk Research
We start by mapping the clinical and access context, and then we translate it into measurable demand and supply indicators. Public sources such as the US CDC, the US FDA, the NIH, and the WHO help with prevalence references, diagnosis guidance, and treatment pathway context that affects prescription uptake. We also use peer-reviewed journals to capture changes in adult ADHD recognition, persistence rates, and typical treatment duration patterns that influence annualized demand.
On the market side, we review company filings, earnings decks, and reputable press coverage to understand portfolio mix and pricing commentary, and we check pharmacy channel dynamics through public payer and health system publications. Patent databases are used selectively to track key molecule lifecycle events that can impact generic entry and price direction. Where needed, we complement this with paid subscriptions for company financials and intelligence, news and financials, and patent records to reduce gaps in product coverage and timing. These desk research sources are illustrative, and many other references were also used for data collection, validation, and research clarification.
Primary Interviews and Surveys
Next, we validate assumptions through expert interviews and structured surveys with clinicians, hospital and retail pharmacy stakeholders, payers and reimbursement specialists, and supply-side executives involved in ADHD drug portfolios. Since the market is global, our conversations are spread across major regions so local diagnosis rates, prescribing habits, and channel markups do not get generalized too quickly. Respondent input is used to close data gaps from public sources and to test adoption and pricing assumptions before finalizing the model.
Distribution of primary research fieldwork respondents
| Company type | Respondent position | Region |
|---|---|---|
| Top tier: 28% | CXOs: 13% | APAC: 51% |
| Mid tier: 56% | Functional/Unit leaders: 39% | EMEA: 29% |
| Smaller Players: 16% | Managers: 48% | Americas: 20% |
Market-Sizing & Forecasting
Market sizing is built using a top-down and bottom-up mix, where the main build starts from the treated patient pool and prescription intensity, and then gets converted into value using average therapy costs across channels. In practice, we reconstruct demand by linking ADHD prevalence and diagnosis visibility to treatment rates, split by children and adults, and then apply typical persistence and switching patterns to annualize volumes.
A few inputs do most of the heavy lifting, including age-specific treated share, stimulant versus non-stimulant mix, average daily dose and treatment duration, list-to-net price movement, and retail versus hospital versus online pharmacy dispensing share. To keep the totals realistic, the output is corroborated with selective bottom-up checks such as sampled product volume and pricing benchmarks from channel feedback, plus supplier revenue cues where disclosure allows it, and then the model is adjusted when a clear mismatch shows up. When product-level disclosure is limited, gaps are handled by using class-level averages validated by interviews, followed by sensitivity checks around mix and price.
For forecasting, we use scenario analysis supported by a simple multivariate relationship between treated population growth, access conditions, and expected pricing trends. Assumptions are aligned to what interviewees expect for diagnosis momentum, genericization timing, and channel shifts over the forecast window, and then rolled up to regional and global totals.
Data Validation & Update Cycle
We validate the final numbers through several passes that compare model outputs against independent signals, such as prescription trend direction, policy changes that affect coverage, and known lifecycle events for major drug classes. Outliers are flagged and reviewed, and if the variance cannot be explained by a traceable input, we revisit the assumptions and re-check with additional expert touchpoints.
Before sign-off, the work is reviewed across analysts so calculations, units, and currency handling are consistent and replicable. Reports are refreshed annually, and interim updates are added when material events occur, such as a major regulatory action, a meaningful pricing shift, or a change in access rules. Right before delivery, we run a final update sweep so clients receive the most current view supported by the latest available inputs.
Mordor Intelligence's Attention Deficit Hyperactivity Disorder Market Size Versus Other Published Estimates
Published ADHD market values can look far apart because the counted revenue streams are not always the same, and the year choices and currency timing differ across publishers. Some estimates also lean more on forward assumptions for adult diagnosis growth and pricing, which can pull the number up or down quickly.
Digital therapeutics and non-drug behavioral programs sit outside Mordor Intelligence's scope, which is why figures that bundle these services can land above the drug-only total. Differences also come from whether retail, hospital, and online pharmacy markups are treated consistently, and from how fast generic entry is assumed to compress prices for stimulants and non-stimulants. When update timing is uneven, the same market can be reported with older price points or outdated patient uptake assumptions, which then widens the spread further.
Benchmark comparison
| Source | Market Size | Gaps in Research Methodology |
|---|---|---|
| Mordor Intelligence | USD 18.51 B (2026) | |
| Trade Journal A | USD 16.23 B (2024) | Uses an earlier base year and may apply conservative treated-rate assumptions, so recent diagnosis expansion and channel mix shifts are not fully reflected in the value build. |
| Industry Newsletter B | USD 18.30 B (2025) | Appears to mix therapy types and rely on headline growth expectations without consistently separating drug class mix effects and pharmacy channel pricing layers across regions. |
Looking at the three numbers together, most of the spread is explained by what gets counted beyond prescription drugs, plus the base year and how pricing layers are applied. By keeping the build tied to treated patients, class mix, and channel economics, the estimate stays traceable to inputs that can be checked and re-run as conditions change.


Key Questions Answered in the Report
What is the projected size of the Attention Deficit Hyperactivity Disorder market by 2031?
The Attention Deficit Hyperactivity Disorder market is expected to reach USD 23.78 billion by 2031, expanding at a 5.15% CAGR.
Which drug class dominates current sales?
Stimulant medications held 67.88% of the Attention Deficit Hyperactivity Disorder market share in 2025, supported by long-standing efficacy data.
Why are non-stimulants gaining popularity?
Prescribers and patients seek alternatives with lower abuse risk, and new agents like viloxazine show strong efficacy and growth, posting a 7.32% CAGR forecast.
How fast is the adult segment growing?
Adult diagnoses are rising at an 8.09% CAGR as telehealth makes specialist evaluation more accessible and guidelines formalise adult screening.
Which region offers the highest growth potential?
Asia-Pacific leads with a 6.42% forecast CAGR thanks to improving awareness, favourable policy shifts, and expanding healthcare infrastructure.
How are digital therapeutics impacting treatment?
FDA-cleared platforms such as EndeavorRx provide non-pharmacologic options, alleviating supply constraints and safety concerns tied to controlled stimulants.
Page last updated on:


 Your data is secure and never sold or shared.


