
Athleisure Market Size and Share
Market Overview
| Study Period | 2021 - 2031 |
|---|---|
| Market Size (2026) | USD 415.28 Billion |
| Market Size (2031) | USD 647.21 Billion |
| Growth Rate (2026 - 2031) | 9.28 % |
| Fastest Growing Market | Asia Pacific |
| Largest Market | North America |
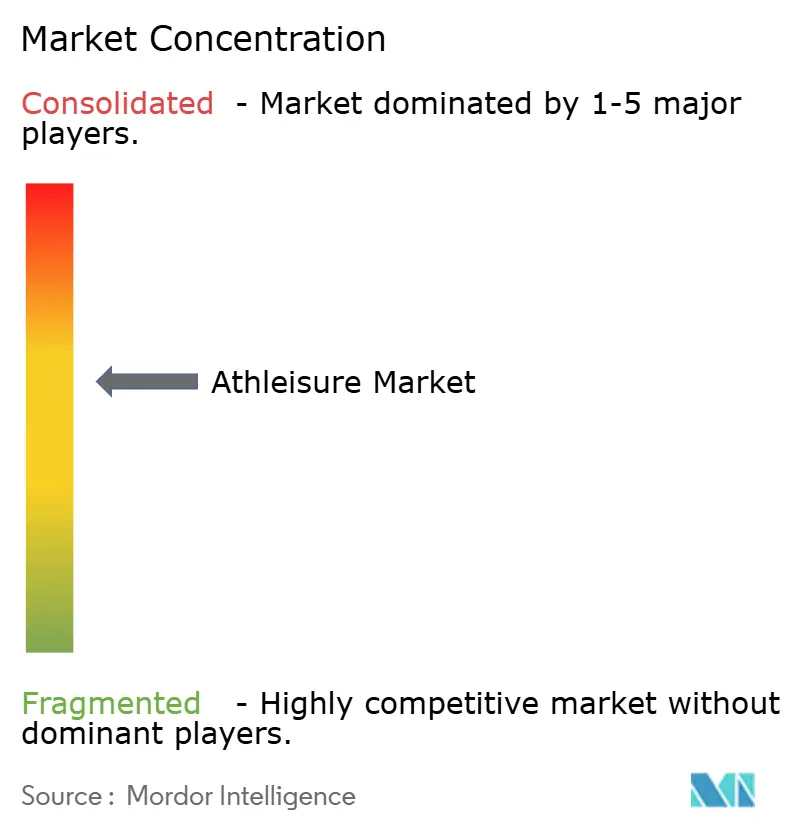
| Market Concentration | Medium |
Major Players
*Disclaimer: Major Players sorted in no particular order Image © Mordor Intelligence. Reuse requires attribution under CC BY 4.0. |
|
Athleisure Market Analysis by Mordor Intelligence
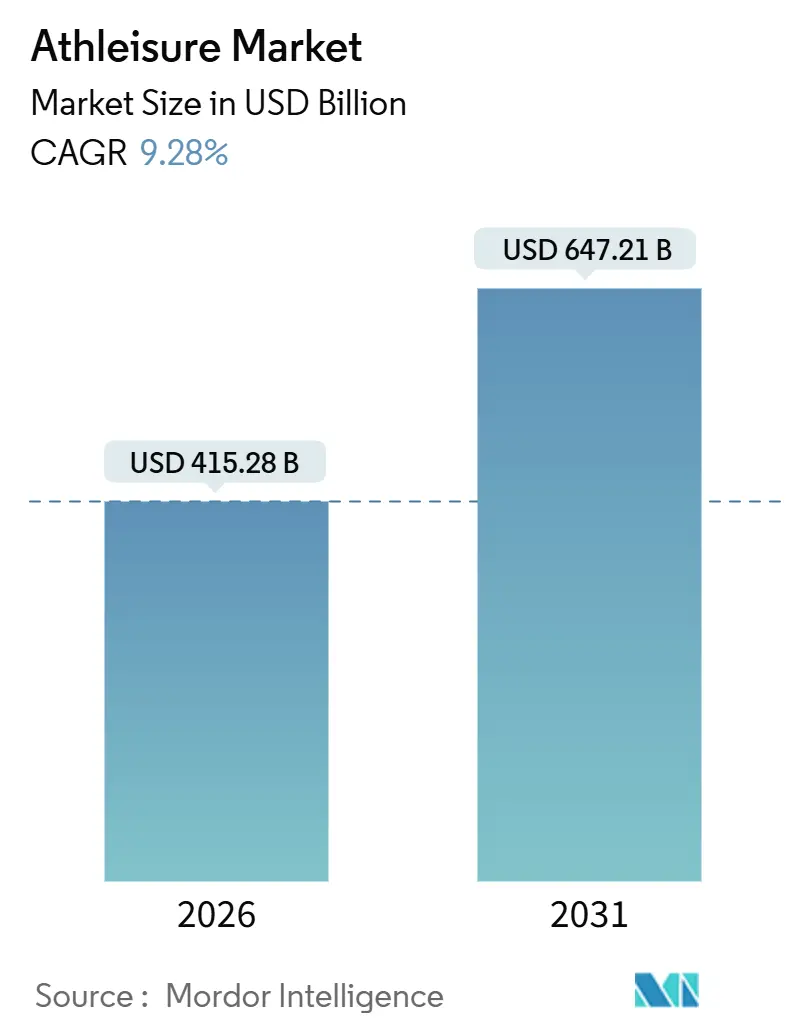
The global athleisure market size stood at USD 415.28 billion in 2026 and is set to reach USD 647.21 billion by 2031, translating into a 9.28% CAGR over the forecast window. This growth is driven by a notable consumer shift from traditional, purpose-specific sportswear to versatile apparel designed with performance fabrics. These advancements have enabled technical clothing and footwear to transition seamlessly into various environments, including gyms, workplaces, educational institutions, and social gatherings. While clothing continues to dominate as the primary revenue contributor, it faces increasing pressure from commoditization. On the other hand, the footwear segment is experiencing substantial growth, fueled by innovations such as carbon-plate midsoles, advanced cushioning technologies, and weather-resistant membranes, which justify higher price points. Additionally, governments across the Asia-Pacific region are making significant investments in grassroots sports initiatives, creating new opportunities for athleisure consumption. Sustainability has evolved from being a mere marketing strategy to becoming a critical business requirement. This shift is evident in the rising adoption of recycled polyester and the growing popularity of circular services, such as resale platforms, which are gaining support from both regulatory bodies and environmentally conscious consumers.
Key Report Takeaways
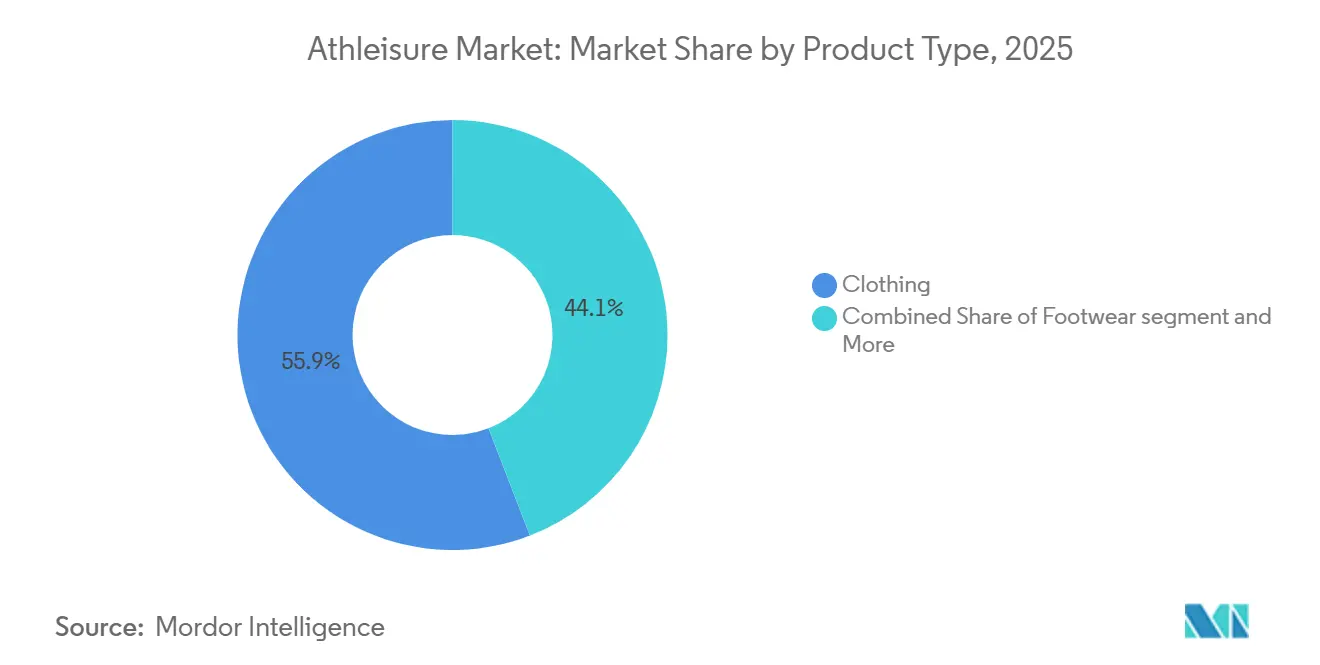
- By product type, clothing led with 55.86% of the athleisure market share in 2025, while footwear is projected to grow at a 9.57% CAGR through 2031.
- By end user, adults accounted for 91.82% of 2025 revenue, whereas the kids and children segment is forecast to expand at an 11.82% CAGR between 2026 and 2031.
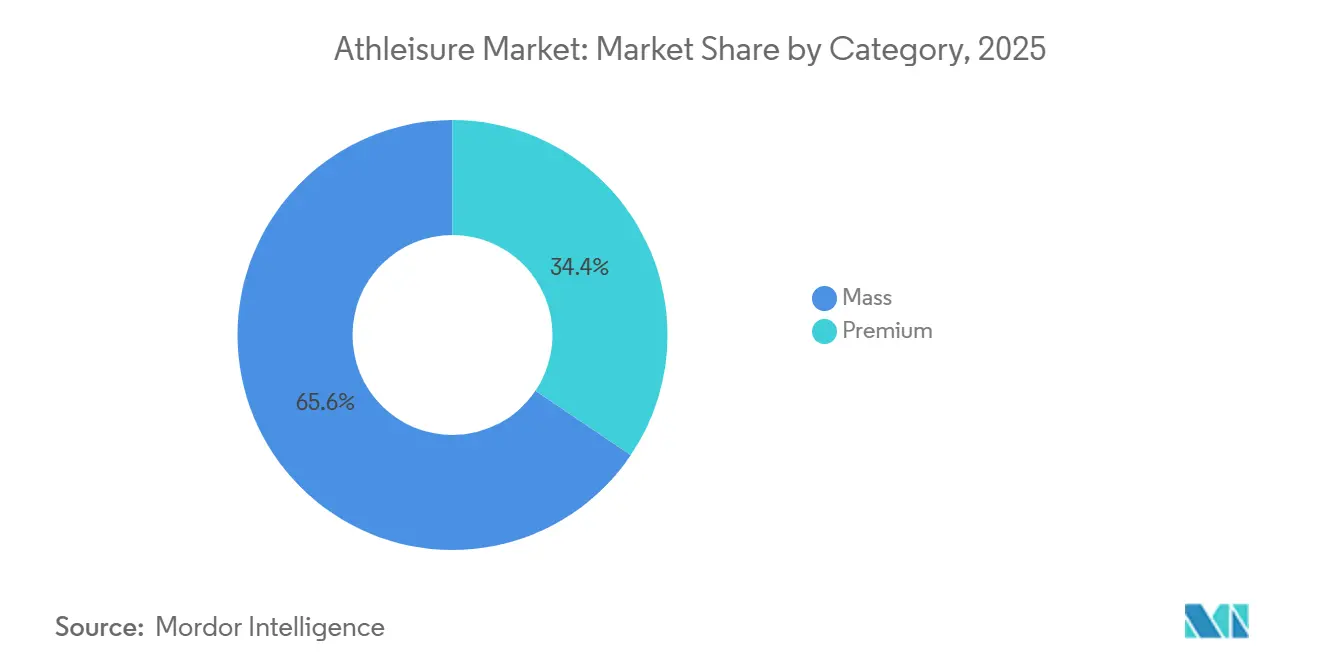
- By category, mass-market lines captured 65.57% of 2025 revenue, yet the premium segment is set to post a 10.45% CAGR to 2031.
- By distribution channel, sports and athletic goods stores held 39.68% of 2025 sales, but online retail stores are advancing at an 11.36% CAGR through 2031.
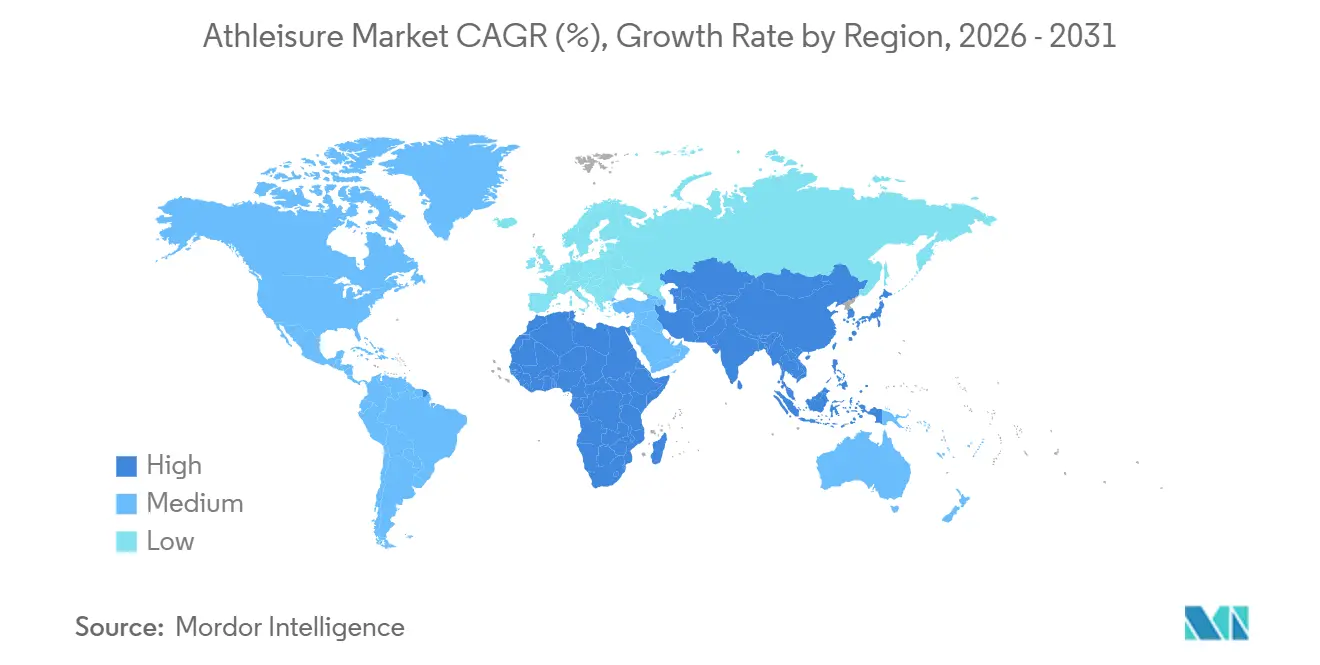
- By geography, North America commanded 38.95% of 2025 revenue, while Asia-Pacific is on track for a 10.21% CAGR to 2031.
Note: Market size and forecast figures in this report are generated using Mordor Intelligence’s proprietary estimation framework, updated with the latest available data and insights as of January 2026.
Market Trends and Insights
Drivers Impact Analysis of Athleisure Market*
| Driver | (~) % Impact on CAGR Forecast | Geographic Relevance | Impact Timeline |
|---|---|---|---|
| Growing enthusiasm for sports and outdoor activities | +1.8% | Global, with pronounced gains in Asia-Pacific (China, India) and North America | Medium term (2-4 years) |
| Influence of social media, celebrity endorsements, and fitness influencers | +1.5% | Global, particularly North America, Europe, and urban Asia-Pacific markets | Short term (≤ 2 years) |
| Sustained growth in women-led fitness and yoga apparel | +1.2% | North America, Europe, and emerging Asia-Pacific urban centers | Medium term (2-4 years) |
| Innovation in fabric and product design | +1.4% | Global, with research and development concentrated in North America, Europe, and Japan | Long term (≥ 4 years) |
| Government initiatives and investments in sports participation | +1.0% | Asia-Pacific (China, India), Middle East (United Arab Emirates, Saudi Arabia), select European nations | Long term (≥ 4 years) |
| Sustainability trends and eco-friendly product offerings | +1.3% | Europe (European Union regulations), North America, and premium segments in Asia-Pacific | Medium term (2-4 years) |
| Source: Mordor Intelligence | |||
Growing enthusiasm for sports and outdoor activities
Participation in organized athletics and recreational fitness is growing across various demographics, driving the adoption of athleisure. The National Federation of State High School Associations (NFHS) reported that the United States high school athletic participation increased by over 200,000 during the 2024-25 academic year [1]Source: National Federation of State High School Associations (NFHS), "Participation in High School Sports Hits Record High with Sizable Increase in 2024-25", nfhs.org. In China, rising disposable incomes in tier-2 and tier-3 cities are fueling demand for performance apparel. In India, the Fit India Movement and Khelo India Scheme have allocated INR 3,165 crore (approximately USD 380 million) from 2021 to 2026 to enhance grassroots sports infrastructure and boost youth participation, paving the way for a new generation of athleisure consumers. Post-pandemic, outdoor activities such as trail running, hiking, and cycling have gained significant traction. In response, brands have developed hybrid products that seamlessly transition from trails to urban environments. According to the Bureau of Labor Statistics, 21.5% of the United States population engaged in sports, exercise, and recreation daily in 2024 [2]Source: Bureau of Labor Statistics, "American Time Use Survey", bls.gov. This trend reflects a shift from focusing solely on elite athleticism to incorporating physical activity into daily routines, thereby broadening the market beyond traditional sportswear buyers.
Influence of social media, celebrity endorsements, and fitness influencers
Digital platforms have reshaped how consumers discover, evaluate, and purchase athleisure. Influencer marketing has demonstrated measurable returns, surpassing the effectiveness of traditional advertising. With increasing global internet penetration, social media is becoming more accepted and accessible. In 2025, approximately 6 billion people, or about three-quarters of the global population, are using the internet, up from a revised 5.8 billion in 2024, according to the International Telecommunication Union [3]Source: International Telecommunication Union, "Global number of Internet users increases", itu.int. Fitness influencer endorsements have been shown to drive significantly higher purchase intent for activewear compared to celebrity endorsements, primarily due to their perceived authenticity and relatable fitness journeys. Gymshark, which operates exclusively on a direct-to-consumer model, reached a valuation of USD 1.45 billion by leveraging micro-influencer collaborations and community-driven content, bypassing traditional retail and advertising channels. While celebrity-backed lines, such as Dwayne Johnson's Project Rock collection with Under Armour, may generate short-term sales spikes, they often lack the sustained engagement achieved by influencer-led campaigns. The growing preference for user-generated content and peer recommendations is reducing the impact of traditional brand messaging. This shift is prompting established brands to reallocate their marketing budgets toward creator partnerships and social commerce integrations.
Innovation in fabric and product design
Technical advancements in textile engineering are equipping athleisure garments with performance features such as moisture management, thermoregulation, and odor resistance. These innovations not only support premium pricing but also expand the garments' applications beyond traditional activewear. Biomimetic nanofiber membranes, inspired by spider silk, now achieve moisture-vapor transmission rates while maintaining waterproofing, resolving the long-standing challenge of balancing breathability with weather protection. The North Face's FutureLight fabric, which uses nanospinning to create porous membranes, has been integrated into both alpine mountaineering gear and urban commuter lines, demonstrating the migration of high-performance materials into everyday use. Carbon-fiber plates embedded in running shoe midsoles, first introduced by Nike's ZoomX Vaporfly and later adopted by Adidas, Hoka, and On, have become a standard in the performance footwear segment. Academic studies confirm these plates improve running economy by 4-5%. Additionally, researchers at Zhejiang University have developed infrared-transparent nylon, enabling garments to reflect visible light for cooling while transmitting infrared radiation, offering passive thermoregulation without electronic components. These advancements are not merely incremental; they reshape consumer expectations and create significant barriers to entry for brands lacking research and development capabilities or access to advanced materials.
Sustained growth in women-led fitness and yoga apparel
Women's athleisure has grown from a niche category into a key market segment. This growth is driven by brands focusing on fit, function, and community, moving beyond traditional sportswear aesthetics. Alo Yoga has successfully positioned athleisure as a lifestyle choice rather than just functional apparel by leveraging influencer partnerships and creating experiential retail stores in high-traffic urban areas. Similarly, Sweaty Betty, in partnership with Wolverine Worldwide, has demonstrated that premium women's activewear can sustain double-digit growth in mature markets by prioritizing inclusive sizing and community-focused events. Demographically, women now account for the majority of gym memberships and yoga practitioners in North America and Europe. Additionally, there is increasing cultural acceptance of athleisure as suitable attire for non-athletic settings. Brands that overlook women-specific design, sizing, and marketing risk losing market share to specialists who understand that women's activewear purchasing decisions are driven by versatility, comfort, and social signaling rather than solely by performance metrics.
Restraints Impact Analysis of Athleisure Market*
| Restraint | (~) % Impact on CAGR Forecast | Geographic Relevance | Impact Timeline |
|---|---|---|---|
| Proliferation of counterfeit products | -0.8% | Global, with highest volumes in Asia-Pacific, Middle East, and e-commerce platforms | Short term (≤ 2 years) |
| Polyester price volatility linked to recycled-PET supply swings | -0.6% | Global, particularly impacting brands with high recycled-content commitments | Medium term (2-4 years) |
| Tariff increases and trade barriers | -0.9% | North America (United States imports from Asia), Europe (post-Brexit adjustments), select South American markets | Short term (≤ 2 years) |
| High cost associated with the product | -0.7% | Emerging markets in Asia-Pacific, South America, Middle East, and Africa; price-sensitive segments in developed markets | Medium term (2-4 years) |
| Source: Mordor Intelligence | |||
Proliferation of counterfeit products
Counterfeit athleisure damages brand equity, weakens consumer trust, and redirects revenue away from legitimate manufacturers. Enforcement actions highlight the extent of this issue. In 2025, during Super Bowl LIX, Immigration and Customs Enforcement's Operation Team Player seized counterfeit goods, including replica jerseys and athletic footwear, showcasing how major sporting events attract counterfeit distributors. E-commerce platforms and social media marketplaces have simplified counterfeit distribution, enabling sellers to access global audiences with minimal investment. In some categories, counterfeit products have achieved quality levels close to authentic items, making visual identification challenging for consumers. This has driven brands to implement advanced authentication technologies, such as blockchain-based tracking and near-field communication tags. Premium brands face significant risks, as counterfeits erode exclusivity and increase consumer doubts about pricing. Regulatory frameworks for counterfeiting vary widely across regions. In many emerging markets, enforcement efforts lag behind counterfeit production, hindering revenue capture and compromising brand integrity.
Tariff increases and trade barriers
Rising tariffs on apparel and footwear imports are squeezing margins and compelling brands to overhaul their supply chains, with limited short-term alternatives to Asian manufacturing hubs. The United States has imposed tariffs on goods from Vietnam, Indonesia, Cambodia, and China, significantly affecting athleisure brands that rely heavily on these countries for production. Nike, which manufactures around 50% of its footwear in Vietnam, warned investors that sustained tariff exposure could reduce fiscal 2025 earnings by USD 1 billion. Similarly, Adidas and Puma raised concerns about the impact on their Southeast Asian supply chains. Moving production to other regions, such as Bangladesh, Sri Lanka, or nearshore locations like Mexico and Central America, is not an immediate solution. It requires years for factory certifications, workforce development, and logistics adjustments. Brands are now faced with a strategic challenge: absorb tariff costs and endure margin compression, pass the costs to consumers and risk a decline in sales volume, or focus on premiumization to justify higher prices. Additionally, the tariff environment is fragmenting global supply chains. Brands are adopting separate sourcing strategies for North American, European, and Asian markets to minimize duty exposure, which increases complexity and reduces economies of scale.
*Our forecasts treat driver/restraint impacts as directional, not additive. The impact forecasts reflect baseline growth, mix effects, and variable interactions.
Athleisure Market Segment Analysis
By Product Type:
Footwear Innovation Outpaces ApparelFootwear is expected to grow at a 9.57% CAGR from 2026 to 2031, surpassing the overall market growth. This trend persists even as clothing is anticipated to dominate, contributing 55.86% of 2025's revenue. Advances in cushioning, propulsion, and materials are enhancing footwear's appeal, attracting a broader audience beyond professional athletes. Carbon-fiber plates, initially designed for elite marathon racing midsoles, have now been incorporated into training shoes, trail runners, and lifestyle sneakers. Brands such as Nike, Adidas, Hoka, and On are utilizing this technology to deliver noticeable performance improvements. Nike's ZoomX foam, which combines lightweight EVA with supercritical nitrogen infusion, and Adidas's Lightstrike cushioning platform highlight how material innovation is helping brands stand out in a competitive market. Although clothing remains the leading category, it faces commoditization challenges in basic segments like T-shirts and shorts, where private-label and fast-fashion brands offer lower-priced alternatives. Meanwhile, the "other product types" segment, including accessories like bags, hats, and wearable technology, is a smaller but growing category as brands aim to capture a larger share of consumer spending on athletic products.
Footwear's faster growth trajectory reflects a shift in consumer preferences toward products that provide clear performance benefits and justify higher prices. Running shoes with advanced cushioning and propulsion systems are priced higher than basic training shoes, enabling brands to increase revenue without a proportional rise in sales volume. The popularity of maximalist cushioning, introduced by Hoka and adopted by established brands, appeals to recreational runners and walkers who prioritize comfort over speed. This trend has expanded the market beyond competitive athletes. Trail running and hiking footwear, which combine technical performance with outdoor-inspired aesthetics, are gaining market share as consumers seek versatile products that transition seamlessly from trails to urban environments. In comparison, clothing struggles to achieve similar price premiums, except in specialized categories like waterproof jackets or compression garments, limiting its growth potential relative to footwear.


By End User:
Kids and Children Segment AcceleratesL29: In 2025, adults made up 91.82% of athleisure demand. However, the kids and children segment is expected to grow at an 11.82% CAGR from 2026 to 2031. This growth is primarily driven by Gen Alpha embracing athleisure as their default attire and parents increasingly prioritizing durable, versatile clothing. Adidas has expanded its kids' product range by incorporating sustainable materials and inclusive sizing, targeting eco-conscious parents. Similarly, Lululemon introduced its "Like New" resale program to address the rapid outgrowth cycle typical of children's apparel. Gymshark, traditionally focused on adult fitness enthusiasts, launched youth lines in 2024 to attract Gen Alpha consumers who associate athleisure with casual wear. The segment's growth is influenced not only by demographic factors - for example, millennials and Gen Z parents are more likely to purchase athleisure for their children than previous generations - but also by a cultural shift where athletic wear has become mainstream, extending beyond sports contexts.
Despite its potential, the kids segment faces unique challenges. Brands must address shorter product lifecycles due to rapid growth, cater to budget-conscious parents, and ensure products are durable enough for active play. Successful brands in this segment focus on comfort, easy maintenance, and designs that appeal to both children and their parents. The growing acceptance of athleisure in school dress codes has further expanded the market, as parents seek clothing that complies with institutional requirements while offering flexibility for after-school activities. Although adults remain the dominant segment, developed markets are nearing saturation, with many adult wardrobes already stocked with athleisure pieces. This limits repurchase frequency to seasonal updates or product failures. In contrast, the kids segment benefits from mandatory replacement cycles and the opportunity to build brand loyalty early, positioning it as a strategic priority for long-term growth.
By Category:
Premium Segment Commands Growth PremiumIn 2025, mass-market athleisure captured a significant 65.57% share of revenue, driven by its accessibility through supermarkets, hypermarkets, and discount retailers. However, the premium segment is projected to grow at a strong 10.45% CAGR from 2026 to 2031. Brands are leveraging direct-to-consumer channels, building community connections, and emphasizing technical innovation to support higher price points. Vuori, for example, targets affluent consumers with versatile apparel that transitions seamlessly from workouts to social occasions, focusing on quality and fit rather than logo-centric branding. Similarly, Alo Yoga blends technical performance with stylish designs, positioning athleisure as a lifestyle choice rather than solely functional clothing. Premium brands also benefit from increased customer lifetime value, as direct-to-consumer models enable data collection, personalized marketing, and repeat purchases without relying on wholesale markdowns.
Mass-market athleisure appeals to price-sensitive consumers and benefits from extensive distribution networks but faces margin challenges due to competition from private-label brands and limited pricing flexibility. Retailers like Decathlon and Uniqlo offer functional activewear at affordable price points, attracting consumers who value cost-effectiveness over brand prestige. The faster growth of the premium segment highlights a divergence in consumer preferences. However, premium brands must navigate the challenge of maintaining exclusivity and perceived value while expanding distribution to meet growth objectives, a balance that has proven difficult for brands that scaled too quickly into wholesale channels.
By Distribution Channel:
E-Commerce Reshapes Retail LandscapeIn 2025, sports and athletic goods stores accounted for 39.68% of the distribution share, highlighting their importance as key destinations for performance-oriented consumers. However, online retail stores are expected to grow at a CAGR of 11.36% from 2026 to 2031, driven by brands' investments in direct-to-consumer platforms and consumers' preference for convenience and variety. Lululemon's e-commerce growth has been propelled by improvements to its mobile app and virtual shopping tools designed to replicate in-store experiences. Similarly, Vuori focuses on online sales, using its physical stores primarily as brand-building showrooms rather than transaction centers. Supermarkets, hypermarkets, and other channels, including department stores and specialty boutiques, are losing market share as consumers increasingly turn to online platforms offering broader selections, customer reviews, and hassle-free returns. While the pandemic accelerated this shift, the trend continues as brands enhance their digital experiences and consumers grow more comfortable purchasing apparel online without trying it on.
Sports and athletic goods stores maintain an edge in categories where fit and expert advice are critical, such as running shoes. However, these retailers are also adopting omnichannel strategies that integrate online browsing with in-store pickups and returns. The rise of social commerce, where consumers discover and purchase products directly through platforms like Instagram and TikTok, is further diversifying distribution channels and reducing reliance on traditional retail intermediaries. Brands that operate their own e-commerce platforms benefit from higher margins and access to customer data but must also invest in logistics, customer service, and digital marketing to remain competitive.
Geography Analysis
North America Athleisure Market
In 2025, North America represented 38.95% of athleisure revenue, highlighting its deeply rooted activewear culture and high per-capita spending. However, the region's growth is decelerating as wardrobes reach saturation, prompting consumers to focus on replacements rather than expanding their collections. The United States remains the largest market, driven by widespread gym memberships, youth sports participation, and the integration of athleisure into professional and social settings. Canada and Mexico contribute smaller but steady shares, with Mexico benefiting from nearshore manufacturing investments that help brands mitigate tariff risks. This mature market environment favors premium brands that generate revenue through higher price points instead of volume growth, as demonstrated by Lululemon's continued double-digit growth despite market saturation.
APAC Athleisure Market
Asia-Pacific is the fastest-growing region, with a 10.21% CAGR projected from 2026 to 2031. This growth is fueled by government fitness initiatives, increasing disposable incomes, and urbanization trends that promote active lifestyles. China's "Healthy China 2030" plan aims to have 530 million regular exercisers by 2030. The General Administration of Sport is implementing policies to enhance sports infrastructure and participation, creating a structural boost for athleisure demand. Local brands like Anta and Li-Ning are gaining market share from international competitors by offering competitively priced products tailored to Chinese consumers, with Anta already reporting revenue growth in 2024. Japan, South Korea, Australia, and New Zealand are mature markets with high per-capita spending, while Southeast Asian countries such as Thailand, Indonesia, and Singapore are emerging as growth hubs due to their young, urban populations.
EMEA and South America Athleisure Market
Europe, South America, and the Middle East and Africa, while smaller markets, are strategically important and exhibit distinct dynamics. In Europe, health consciousness and sustainability are driving athleisure adoption. Brands are increasingly focusing on recycled materials and transparent supply chains to comply with European Union regulations and meet consumer expectations. The United Kingdom, Germany, France, Italy, and Spain are the largest markets, while Eastern Europe, including Poland and Russia, offers growth potential as incomes rise. In South America, the athleisure market is concentrated in Brazil, Argentina, Colombia, and Chile, where urbanization and a growing middle class are driving demand, although economic volatility and currency fluctuations pose risks. The Middle East and Africa are emerging markets with significant growth potential, particularly in the United Arab Emirates, Saudi Arabia, and South Africa, where government investments in sports infrastructure and major sporting events are increasing athleisure awareness. Turkey and Egypt have large populations and expanding fitness cultures, while Nigeria and Morocco are becoming promising markets as retail infrastructure develops.

Regulatory Landscape
Athleisure brands are operating under a tightening mix of sustainability and trade rules that increasingly shape apparel and footwear design, sourcing, and inventory practices. In the European Union, circularity requirements are moving from policy to implementation, anchored by the Ecodesign for Sustainable Products Regulation (ESPR). Under ESPR, the ban on the destruction of unsold clothes, clothing accessories, and footwear entered application for large companies on 19 July 2026. Alongside product rules, chemical compliance remains material for performance fabrics and finishes, with the European Commission maintaining REACH as the core framework while continuing work on PFAS restriction proposals (as communicated in April 2026).
Cross-border cost and compliance volatility also persists. In the United States, a Presidential Proclamation under Section 122 of the Trade Act of 1974 imposed a temporary 10% ad valorem surcharge on imports from any country, effective 24 February 2026 through 24 July 2026. This adds short-cycle duty uncertainty for athleisure brands sourcing globally. In Latin America, chemical-management convergence is emerging, with Peru publishing an April 2026 decree that implements a REACH-inspired, life-cycle and risk-based framework for chemical substance management. For brands selling across multiple jurisdictions, this adds documentation and increases supplier controls.
Competitive Landscape
The athleisure market is moderately fragmented, with Nike Inc., Adidas AG, and Lululemon Athletica Inc. holding significant shares while facing growing competition from digitally native brands and regional players. Adidas revised its 2024 outlook upward after a strong third-quarter performance driven by its Boost and Lightstrike cushioning platforms but cautioned that prolonged tariff exposure could pressure margins. Emerging brands like Gymshark, Vuori, Alo Yoga, and On Holding are gaining market share by utilizing influencer marketing, fostering community engagement, and adopting direct-to-consumer models that avoid traditional retail markdowns.
Major market players include Lululemon Athletica Inc., Nike Inc., Puma SE, Adidas AG, and Under Armour Inc. The competitive landscape favors brands that prioritize sustainability, technological innovation, and community-focused strategies. These approaches appeal to health-conscious consumers seeking meaningful brand interactions beyond product functionality. For example, in March 2024, Nike introduced the Air Max Dn shoe, featuring advanced cushioning technology designed to enhance heel-to-toe transitions, highlighting the industry's emphasis on product innovation.
Opportunities exist in underserved segments such as adaptive athleisure for consumers with disabilities, extended sizing options, and technical apparel for niche sports like pickleball and padel tennis. Technology adoption remains a critical differentiator, with brands investing in fabric innovation, data analytics for personalized recommendations, and augmented reality for virtual try-ons. Sustainability commitments are also shaping the competitive landscape, with brands striving to incorporate recycled materials, reduce carbon footprints, and achieve certifications like Bluesign and Fair Trade. However, these initiatives add complexity and cost volatility to supply chains. Additionally, the rise of resale platforms such as Lululemon's "Like New" and third-party marketplaces like Poshmark and Depop is creating a secondary market that extends product lifecycles but may cannibalize new sales.
Athleisure Industry Leaders
-
Nike Inc.
-
Adidas AG
-
Puma SE
-
Under Armour Inc.
-
Lululemon Athletica Inc.
- *Disclaimer: Major Players sorted in no particular order
Athleisure Market Companies Covered in this Report
- Nike Inc.
- Adidas AG
- Lululemon Athletica Inc.
- Puma SE
- Under Armour Inc.
- VF Corporation
- Columbia Sportswear Company
- New Balance Athletics Inc.
- ASICS Corporation
- Wolverine Worldwide Inc.
- Alo Yoga
- Gymshark Ltd.
- Fabletics LLC
- Vuori Inc.
- Anta Sports Products Ltd.
- Li-Ning Company Ltd.
- Decathlon SA
- HanesBrands Inc.
- Skechers USA Inc.
- Aritzia Inc.
- On Holding AG
- Sweaty Betty Ltd.

Market Opportunities and Future Outlook
Recent investments and operational upgrades point to specific whitespace around faster fulfillment, more localized supply, and lower-impact materials, especially as athleisure demand continues to shift online and as footwear innovation supports premium pricing. In June 2026, Lululemon brought a 980,000-square-foot automated distribution center in Brampton, Ontario, to full operations using an AutoStore system (525 robots and 292,000 bins). The upgrade is aimed at supporting high-volume e-commerce and omnichannel service levels in North America. On the manufacturing side, adidas broke ground in July 2026 on the Evervan Kothari footwear plant in Karur, Tamil Nadu, structured as a joint venture and designed for 40 million pairs of annual capacity. This signals ongoing build-out of India as both a demand and sourcing market for athletic footwear and adjacent athleisure categories.
Materials substitution is also creating product and supplier opportunities in categories that have historically depended on petrochemical inputs such as spandex and EVA foam. In May 2026, Hyosung TNC began production at a new bio-based spandex facility in Vietnam, part of a USD 1 billion investment centered on sugarcane-based feedstocks, supporting brand programs that target lower-footprint stretch components without sacrificing performance. In footwear, Infinium partnered with On in July 2026 to supply CO2-derived eNaphtha for commercial production of EVA midsoles in the Cloud X 5 shoe (scaled to over one million pairs). Together, these moves support opportunities for brands and component suppliers looking to industrialize circular and bio-based inputs, pair them with verifiable product data, and integrate them into scalable footwear and apparel platforms.
Recent Industry Developments in Athleisure Market
- July 2026: Adidas announced the groundbreaking of a new footwear plant in Karur, Tamil Nadu, India, via a joint venture with Evervan Group and Kothari Industrial Corporation, designed for an annual capacity of 40 million pairs. The project reinforces India as a manufacturing base for athletic footwear, which is a fast-growing revenue pool within athleisure. It also supports supply diversification away from over-reliance on a narrow set of Southeast Asian sourcing hubs.
- June 2026: Nike launched its N7 Collection with soccer-inspired apparel and footwear supporting Indigenous communities. The release extends Nike's product pipeline in performance-lifestyle crossover items that sit at the center of athleisure wardrobes. It also reinforces brand-community positioning that can influence consumer preference in premium and direct-to-consumer channels.
- July 2024: On introduced LightSpray, a robotic manufacturing process that produces a running-shoe upper in a single step. The approach targets faster, less labor-intensive production for performance footwear, a segment where innovation supports higher price points. It also signals manufacturing-process differentiation as a competitive lever alongside materials and cushioning technologies.


Athleisure Market Report Scope and Research Methodology
Market Definition and Coverage
In this report, we define the athleisure market as revenue earned from garments and footwear designed to be worn for light fitness and everyday casual use, where comfort and sporty styling are both expected by the buyer.
Scope exclusions: We exclude pure performance uniforms made only for organized team sports and similar professional or scholastic use cases.
Segments Covered in This Report
-
By Product Type
- Clothing
- Footwear
- Other Product Types
-
By End User
- Adults
- Kids / Children
-
By Category
- Premium
- Mass
-
By Distribution Channel
- Supermarkets / Hypermarkets
- Sports and Atheletic Good Stores
- Online Retail Stores
- Other Distribution Channels
-
By Geography
-
North America
- United States
- Canada
- Mexico
- Rest of North America
-
South America
- Brazil
- Argentina
- Colombia
- Chile
- Rest of South America
-
Europe
- United Kingdom
- Germany
- France
- Italy
- Spain
- Russia
- Sweden
- Belgium
- Poland
- Netherlands
- Rest of Europe
-
Asia-Pacific
- China
- Japan
- India
- Thailand
- Singapore
- Indonesia
- South Korea
- Australia
- New Zealand
- Rest of Asia-Pacific
-
Middle East and Africa
- United Arab Emirates
- South Africa
- Saudi Arabia
- Nigeria
- Egypt
- Morocco
- Turkey
- Rest of Middle East and Africa
-
North America
Data Sources, Market Sizing, and Validation
Desk Research
Desk research was used to set the market boundary, map the value chain, and build the starting dataset for demand and pricing. We reviewed public sources such as US Census Bureau retail trade releases, US Bureau of Labor Statistics CPI series for apparel, UN Comtrade trade flows for apparel and footwear categories, and World Bank macro indicators that help explain discretionary spending shifts.
To keep the model grounded in what brands are actually selling and where growth is showing up, we also used annual reports, earnings transcripts, investor decks, and credible press coverage on category launches, channel mix, and promotional intensity. In a few cases, our internal paid subscriptions for company financials and news helped fill gaps on privately held players and track major M&A or expansion announcements. These desk sources are illustrative only, and many additional public materials were referenced to collect data, validate assumptions, and clarify details.
Primary Interviews and Surveys
Primary work was used to pressure-test the desk model, especially where public data does not separate athleisure cleanly from broader sportswear. We spoke with a mix of brand teams, distributors, retailers, and materials or manufacturing-side experts to confirm what products get tagged as athleisure, how pricing moves through the year, and how online versus offline sales are trending across regions.
Distribution of primary research fieldwork respondents
| Company type | Respondent position | Region |
|---|---|---|
| Top tier: 32% | CXOs: 13% | APAC: 37% |
| Mid tier: 47% | Functional/Unit leaders: 42% | EMEA: 37% |
| Smaller Players: 21% | Managers: 45% | Americas: 26% |
Market-Sizing & Forecasting
Sizing starts from a top-down build where country level apparel and footwear demand is reconstructed using retail sales signals, import-export direction, and macro spend capacity, which are then filtered to the athleisure share using category mix insights from interviews and public brand disclosures. The totals are then cross-checked with selective bottom-up approximations, such as sampled average selling price (ASP) by product group multiplied by estimated unit volumes in key channels, before adjustments are applied.
Key inputs used in the model include athleisure penetration within sportswear and casualwear purchases, the channel mix split between online and store-led sales, ASP bands by mass versus premium positioning, seasonality effects tied to promotional calendars, and regional growth indicators such as urbanization and fitness participation trends. Where volume or price data is missing for smaller markets, proxies are used from comparable countries and then normalized using income levels and trade intensity so the gap does not inflate the final number.
Forecasting is mainly done using scenario analysis, because shifts in consumer discretionary spend and promotion intensity can move the category faster than long-run averages. Assumptions on unit growth, price progression, and channel mix are reviewed with primary respondents, and then rolled into the final forecast path for 2026 to 2031.
Data Validation & Update Cycle
Validation is done by checking the modeled market totals against independent signals, including category growth commentary from brand disclosures, apparel and footwear trade movements, and inflation-adjusted spending trends. When a country output shows an unusual jump, we re-check drivers for currency conversion timing, channel mix shifts, or one-off events, and then revise or confirm the assumption through follow-up outreach.
Before sign-off, the model goes through multi-step analyst reviews where calculations, inputs, and scope logic are re-tested for consistency across regions and years. The report is refreshed annually, and interim updates are made when material events occur, such as major trade disruptions or sharp pricing changes. Right before delivery, a final pass is completed so clients receive the latest updated view of the market.
Mordor Intelligence's Athleisure Market Size Versus Other Published Estimates
Published athleisure market values can vary a lot, even when they seem to talk about the same topic, because the category line is not defined the same way by everyone. Differences usually come from what product groups are counted, whether accessories are included, how channels are treated, and what year and currency timing is used.
Performance team uniforms are treated as outside Mordor Intelligence's scope, and that single exclusion can move totals when other estimates bundle them into broader sports apparel revenue. The other big gap drivers we see are whether footwear is fully counted or only partially included, how fast ASP is assumed to rise in premium categories, and whether the publisher refreshes assumptions after major promotion cycles and demand slowdowns.
Benchmark comparison
| Source | Market Size | Gaps in Research Methodology |
|---|---|---|
| Mordor Intelligence | USD 415.28 B (2026) | |
| Global Consultancy A | USD 414.43 B (2025) | Uses a different base year and often blends athleisure with adjacent activewear definitions, so footwear and casual crossover items can be counted under a broader basket than a light-fitness-and-lifestyle filter. |
| Industry Research Group B | USD 411.02 B (2025) | Anchors the estimate to a 2025 base with a longer forecast window, and the scope appears to use wider segmentation labels that can pull in team-sport or performance-led apparel lines, which raises or shifts totals by category. |
The table shows that the spread is not only about growth rates, it is also about what is counted and the timing of the base year. By tying the size to clear inclusion rules, practical demand indicators, and repeatable price and mix checks, our estimate stays easier to reconcile with real retail and trade signals.


Key Questions Answered in the Report
What is the projected value of the global athleisure market by 2031?
It is expected to reach USD 647.21 billion on a 9.28% CAGR trajectory.
Which region is growing fastest in athleisure?
Asia-Pacific is set for a 10.21% CAGR through 2031, outpacing all other regions.
Why is footwear outperforming apparel within athleisure?
Carbon-plate propulsion, maximalist cushioning, and recycled materials deliver clear performance benefits that support higher prices and faster volume growth.
How large is the kids athleisure opportunity?
The kids segment is expanding at 11.82% CAGR and is positioned to more than double its current value by 2031 as Gen Alpha adopts athleisure as default wear.
Page last updated on:


 Your data is secure and never sold or shared.


