
Asset Performance Management (APM) Market Size and Share
Market Overview
| Study Period | 2020 - 2031 |
|---|---|
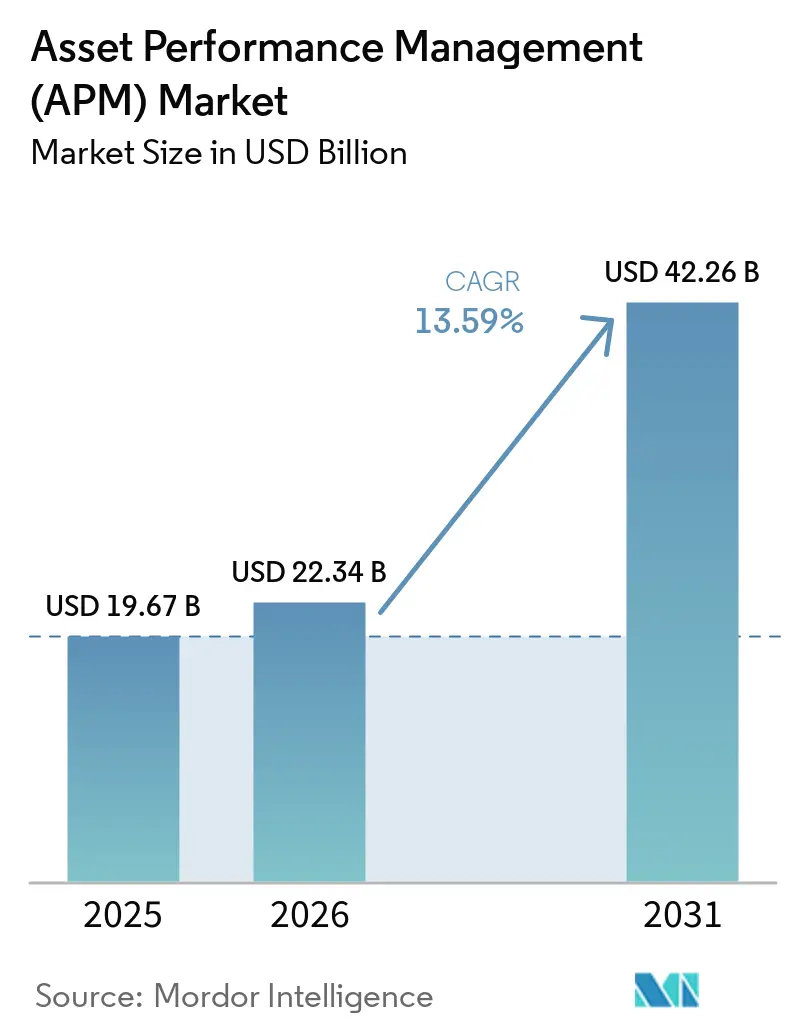
| Market Size (2026) | USD 22.34 Billion |
| Market Size (2031) | USD 42.26 Billion |
| Growth Rate (2026 - 2031) | 13.59 % |
| Fastest Growing Market | Asia-Pacific |
| Largest Market | North America |
| Market Concentration | Medium |
Major Players *Disclaimer: Major Players sorted in no particular order Image © Mordor Intelligence. Reuse requires attribution under CC BY 4.0. | |
Asset Performance Management (APM) Market Analysis by Mordor Intelligence
The asset performance management market size is expected to grow from USD 19.67 billion in 2025 to USD 22.34 billion in 2026 and is forecast to reach USD 42.26 billion by 2031 at 13.59% CAGR over 2026-2031. Demand accelerates as organizations link predictive analytics with industrial IoT to curb unplanned downtime, improve safety, and cut maintenance budgets. Cloud-native platforms widen access for small and medium enterprises while hybrid architectures satisfy data sovereignty and cybersecurity mandates. Prescriptive analytics expands quickly because AI engines now recommend specific maintenance actions that lift overall equipment effectiveness. Competitive focus shifts from basic condition monitoring toward embedded digital twins, autonomous workflows, and integrated ESG reporting. Technology partnerships and domain-specific solutions reshape vendor strategies, particularly in fast-growing Asia-Pacific, where industrial digitalization is surging.
Key Report Takeaways
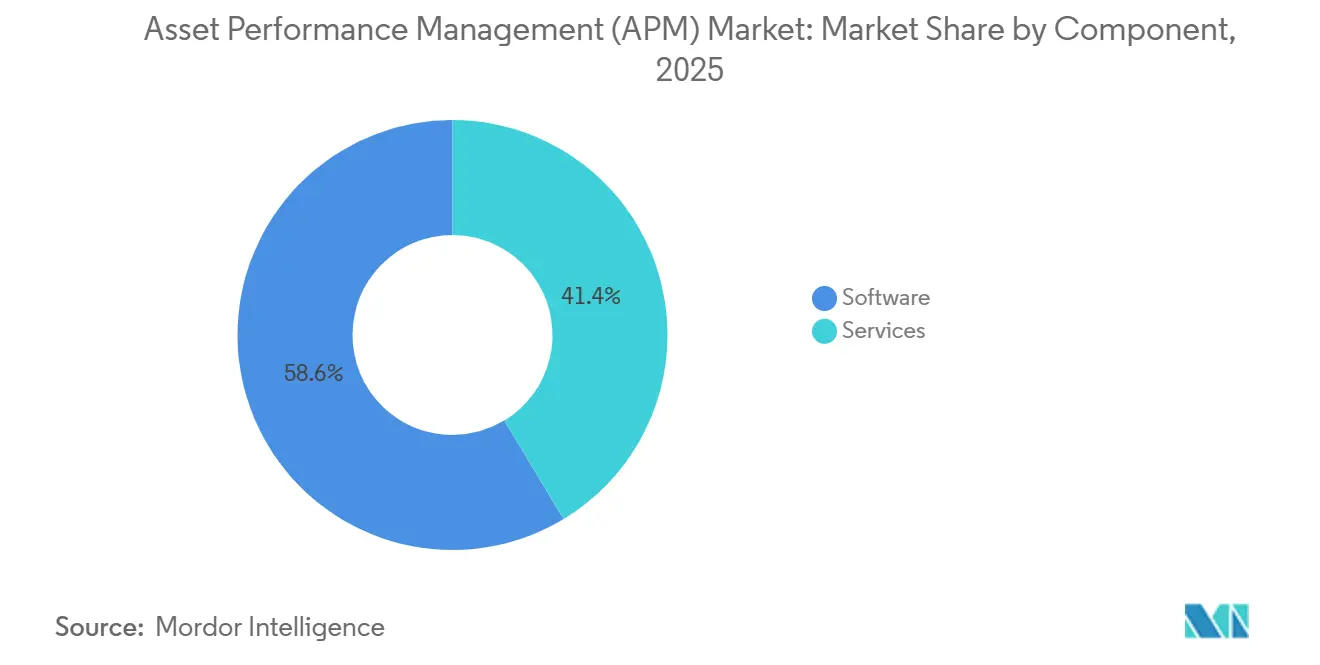
- By component, software captured 58.64% of the Asset Performance Management market share in 2025, whereas services are forecast to post the fastest 14.97% CAGR through 2031.
- By type, predictive asset management led with 59.85% revenue share in 2025; prescriptive analytics is projected to advance at a 18.63% CAGR to 2031.
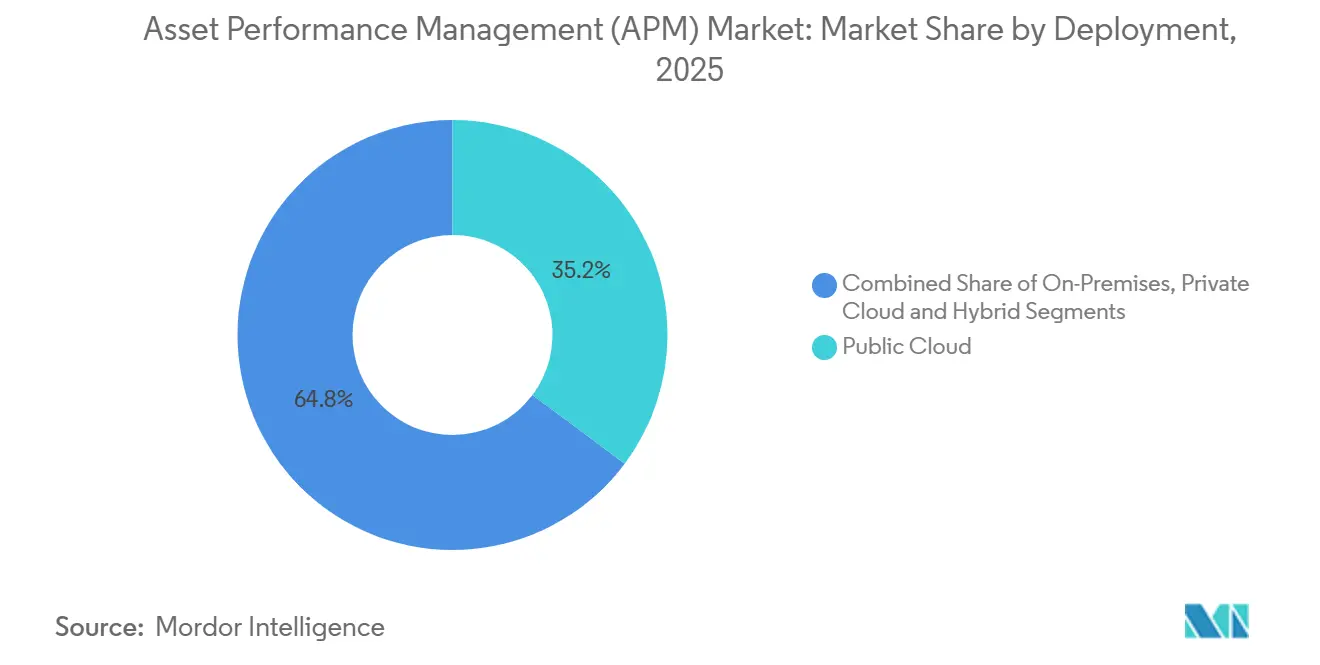
- By deployment model, public cloud accounted for 35.22% of the Asset Performance Management market size in 2025, while hybrid cloud is set to climb at a 21.85% CAGR between 2026 and 2031.
- By end-user industry, oil and gas held a 22.35% share of the Asset Performance Management market size in 2025; chemicals and pharmaceuticals will expand at a 14.62% CAGR through 2031.
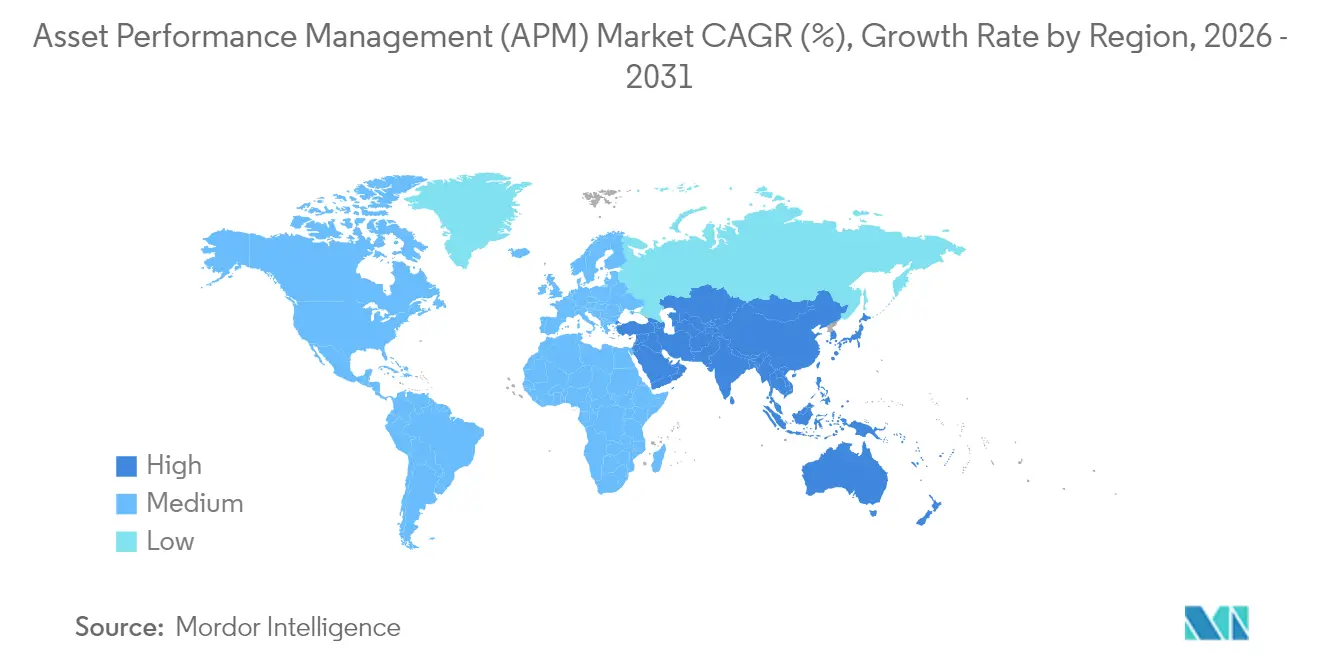
- By geography, North America led with a 32.58% share in 2025, whereas Asia-Pacific is advancing at a 13.74% CAGR to 2031.
Note: Market size and forecast figures in this report are generated using Mordor Intelligence’s proprietary estimation framework, updated with the latest available data and insights as of 2026.
Market Trends and Insights
Drivers Impact Analysis of Asset Performance Management (APM) Market*
| Driver | (~) % Impact on CAGR Forecast | Geographic Relevance | Impact Timeline |
|---|---|---|---|
| Industry 4.0-linked APM adoption | +2.8% | Germany, Japan, South Korea | Medium term (2-4 years) |
| Surge in demand for predictive maintenance | +3.2% | North America and EU, spill-over to APAC | Short term (≤ 2 years) |
| Cloud-native APM uptake by SMEs | +2.1% | Core APAC, expanding to Latin America | Medium term (2-4 years) |
| AI-enabled physics-based digital twins | +2.5% | Global, concentrated in process industries | Long term (≥ 4 years) |
| ESG-driven asset-health investments | +1.9% | EU leadership, North America following | Long term (≥ 4 years) |
| Insurance incentives for real-time analytics | +1.4% | North America, expanding to developed markets | Medium term (2-4 years) |
| Source: Mordor Intelligence | |||
Growing Industry 4.0-linked APM adoption
Enterprises integrate APM within broader Industry 4.0 architectures to synchronize predictive maintenance with real-time production analytics. Automotive plants in Germany trimmed unplanned downtime by 25% after connecting APM and MES platforms. Japanese electronics factories recorded a 15% upturn in overall equipment effectiveness from similar convergence. Falling IIoT sensor prices and maturing edge compute hardware accelerate rollouts, while ISO 55000 guidelines reinforce disciplined asset-lifecycle governance across global supply chains. Vendors now bundle APM with quality management and supply-chain visibility modules, allowing management teams to optimize throughput and asset health in a single pane.
Surge in demand for predictive maintenance
Predictive maintenance transitioned from a cost-cutting tactic to a critical reliability strategy. Energy majors applying AI-based models achieved 40% downtime elimination and 30% maintenance cost savings[1]. One oil supermajor saved USD 10 million annually after hitting 75% failure-prediction accuracy nine days ahead of incidents. The United States predictive maintenance segment is forecast to rise from USD 3.6 billion in 2024 to USD 15.2 billion by 2029 at a 32.8% CAGR. Vibration analytics dominates mechanical asset monitoring, while machine-learning algorithms refine anomaly detection across compressors, turbines, and rolling stock.
Cloud-native APM uptake by SMEs
Small and medium manufacturers embrace cloud APM to bypass capital-heavy on-premises deployments. Subscription models remove hardware upkeep and patching burdens, letting teams focus on process improvements. Manufacturing SMEs leveraging cloud recorded quick productivity bumps, supported by scalable IoT data ingestion and template-driven analytics[2]. Enhanced cloud security frameworks and regional data centers alleviate privacy concerns, encouraging adoption in Asia and Latin America, where budgets remain tight. SaaS vendors pair low-code dashboards with preset machine-learning models so non-technical staff can act on alerts without deep data-science skills.
AI-enabled physics-based digital twins
Digital twin adoption grows as platforms merge real-time telemetry with physics simulations to forecast asset behavior under stress. Hydropower operators cut unscheduled downtime by 20% using turbine digital twins that simulate fluid dynamics. Chemical plants applying twin models on centrifugal pumps achieved 15% maintenance cost reduction through optimized service intervals. Combining data-driven and physics-based approaches elevates model accuracy, especially for complex rotating equipment where pure statistical methods struggle. Continuous calibration with edge analytics keeps twins aligned with actual wear patterns, improving prescriptive guidance on replacement parts and operating set points.
Restraints Impact Analysis of Asset Performance Management (APM) Market*
| Restraint | (~) % Impact on CAGR Forecast | Geographic Relevance | Impact Timeline |
|---|---|---|---|
| Data-security and privacy risks | –2.3% | Global, acute in regulated sectors | Short term (≤ 2 years) |
| High integration cost with legacy OT | –1.8% | Mature industrial markets with legacy infrastructure | Medium term (2-4 years) |
| Scarcity of asset-data scientists | –1.5% | Global, pronounced in emerging markets | Long term (≥ 4 years) |
| AI-liability regulatory ambiguity | –1.2% | EU and North America, emerging globally | Medium term (2-4 years) |
| Source: Mordor Intelligence | |||
Data-security and privacy risks
Connecting operational technology to enterprise networks exposes critical assets to cyberattacks. The expected USD 36.6 billion IoT cybersecurity market illustrates rising spend to mitigate this threat. Manufacturers fear loss of proprietary process data and potential production shutdowns. Regulatory gaps complicate cross-border data flows, especially in the energy and chemical sectors that intersect national security. Hybrid deployments with edge-first processing and cloud burst capacity offer a compromise, reducing cloud exposure while retaining advanced analytics. Vendors incorporate zero-trust frameworks and encryption-at-rest mandates to retain customer confidence.
High integration cost with legacy OT
Decades-old control systems require protocol converters, retrofitted sensors, and extensive validation before joining modern APM stacks. Integration outlays can double initial budgets, particularly in process plants governed by strict safety certifications[3]. Skilled engineers fluent in both OT and AI remain scarce, elongating project timelines. However, documented case studies report 3× return on investment within five months once systems stabilize, supported by lower overtime, spare-parts spend, and failure-related environmental penalties. This payoff encourages phased rollouts, beginning with critical assets that yield rapid benefits before expanding plant-wide.
*Our forecasts treat driver/restraint impacts as directional, not additive. The impact forecasts reflect baseline growth, mix effects, and variable interactions.
Asset Performance Management (APM) Market Segment Analysis
By Component:
Platform Consolidation Centers on SoftwareSoftware applications accounted for 58.64% of the Asset Performance Management market in 2025, reflecting enterprise demand for integrated analytics rather than isolated monitoring tools. Services registered the swiftest 14.97% CAGR because companies need data-science expertise, change-management support, and continuous optimization to unlock full platform value. Historical investment patterns show an accelerating shift toward SaaS delivery that reduces deployment time and ongoing support overhead.
Professional services cover data pipeline construction, algorithm tuning, and ISO 55000 documentation, while managed services handle 24/7 analytics and system health checks. Vendor success hinges on packaged accelerators that lower integration hurdles and predefined AI models that speed value realization. As clients scale from pilot to enterprise rollout, recurring service revenue stabilizes earnings for vendors and ensures continuous improvement for customers.
By Type:
Prescriptive Analytics Becomes the Growth EnginePredictive asset management retained a 59.85% share of the Asset Performance Management market in 2025, yet prescriptive analytics is on course for a 18.63% CAGR through 2031. Predictive models flag impending failures, whereas prescriptive engines recommend specific operational or maintenance actions, creating higher business impact.
Oil and gas operators using prescriptive algorithms extended engine overhaul cycles by 20% and cut maintenance budgets by 25%, translating to three-month paybacks. Asset strategy management modules integrate cost, risk, and performance variables, guiding capital replacement decisions that balance short-term OPEX and long-term CAPEX. Regulatory bodies in hazardous-process industries increasingly view prescriptive maintenance as best practice for preventing safety incidents, embedding it into audit protocols.
By Deployment Model:
Hybrid Architectures Gain GroundPublic cloud represented a 35.22% share of the Asset Performance Management market in 2025, delivering elasticity and low upfront cost. Hybrid cloud is expected to climb 21.85% CAGR as firms combine on-premises data sovereignty with cloud analytics scale. GE Vernova already processes over 1 million daily analytics actions across 1,000-plus power plants via cloud monitors.
Private cloud installations persist in defense, nuclear, and pharmaceutical settings where compliance requires dedicated infrastructure. Edge computing nodes now execute first-level analytics near machines, minimizing latency for safety-critical responses while funneling summary insights to centralized models. Technology roadmaps emphasize modular architectures so that workloads can fluidly migrate among edge, core, and cloud based on security policy and cost considerations.

By End-user Enterprise Size:
SMEs Accelerate Through SaaSLarge enterprises dominate absolute spending due to sprawling asset fleets, yet SMEs register the fastest take-up thanks to cloud delivery that removes hardware ownership and specialized staffing barriers. SaaS subscriptions allow monthly budgeting aligned with production cycles, appealing to midsize plants with thin margins.
SME adoption often begins with vibration monitoring on a few bottleneck machines and expands to plant-wide digital twins as savings accumulate. Vendors pre-package templates for common equipment classes and deliver mobile apps for frontline maintenance crews, removing the need for advanced analytics teams. ISO 55000 guidelines are filtering down supply chains, pushing SMEs to formalize asset governance to retain contracts with multinational customers.
Geography Analysis
North America Asset Performance Management (APM) Market
North America commanded 32.58% of the Asset Performance Management market in 2025, buoyed by mature infrastructure, strict OSHA and EPA mandates, and deep collaboration between industrial operators and software leaders. U.S. predictive maintenance spending alone is projected to quadruple by 2029, reinforcing the region’s innovation leadership. Canadian utilities scale AI-based APM to extend equipment lifespans and postpone costly capital projects, contributing additional momentum.
APAC Asset Performance Management (APM) Market
Asia-Pacific posts the fastest 13.74% CAGR as governments promote Industry 4.0 roadmaps and manufacturers modernize to stay competitive. China’s process industries deploy digital twins for energy efficiency, while Japan’s aging asset base triggers predictive maintenance investments to maintain uptime without extensive capital outlays. India’s Asset Performance Management market should climb from USD 66.7 million in 2022 to USD 213 million by 2032 as public-sector steel and rail operators digitize maintenance. Cross-border alliances like AssetWatch-Mitsui speed technology transfer and localization.
Europe Asset Performance Management (APM) Market
Europe advances steadily on the back of stringent ESG frameworks and advanced engineering sectors. Automotive and chemical plants integrate APM with carbon-tracking dashboards to align asset reliability with emissions goals. The forthcoming Corporate Sustainability Reporting Directive encourages enterprises to document maintenance-linked energy savings, spurring demand for platforms that merge performance analytics with sustainability metrics. Uptake in Central and Eastern Europe accelerates as multinationals retrofit acquired plants with standardized digital maintenance stacks.
Regulatory Landscape
Asset Performance Management deployments sit at the intersection of asset management system standards, sector safety rules, and data governance. The ISO 55000 family is a key global anchor for APM programs. ISO 55001:2024 updates requirements for asset management systems and places more emphasis on decision-making, data management, and predictive actions, which raises the bar for documented workflows, auditability, and evidence trails from analytics to maintenance actions.
Data and industry guidance also shape implementation practices. ISO 55013:2024 adds guidance for managing data assets, aligning with APM platform needs for governed telemetry, models, and master data. ISO 55011:2024 provides guidance relevant to public policy development for asset management in infrastructure-heavy sectors. In regulated verticals such as pharmaceuticals, bodies such as ISPE reference the ISO 55000 series in guidance used for quality management system alignment, reinforcing traceability and controlled change practices when APM insights feed maintenance planning and validation-controlled environments.
Value Chain Analysis
The APM value chain covers instrumentation and connectivity (IIoT sensors, historians, edge gateways), data and model engineering (OT data contextualization, feature stores, reliability libraries), and application layers that deliver predictive and prescriptive workflows. A shift toward cloud-native architectures is notable, as they decouple ingest, digital twin, machine-learning, and action planes on Kubernetes-based stacks. This helps support hybrid deployments for data sovereignty while allowing independent scaling and faster model iteration.
Downstream value capture concentrates in the action plane, where APM drives execution through integrations with EAM and service systems. Interoperability with platforms such as SAP S/4HANA (asset maintenance), IBM Maximo Application Suite, and ServiceNow is central to turning alerts into work orders, spares decisions, and risk-based inspection plans. This role elevates system integrators and managed service providers in implementation and operations. In utilities and other infrastructure segments, industry bodies such as CIGRE help standardize business requirements for evaluating APM platforms, pushing vendors to demonstrate cost-risk-performance alignment, cyber-resilient architectures, and consistent KPI reporting across asset fleets.
Competitive Landscape
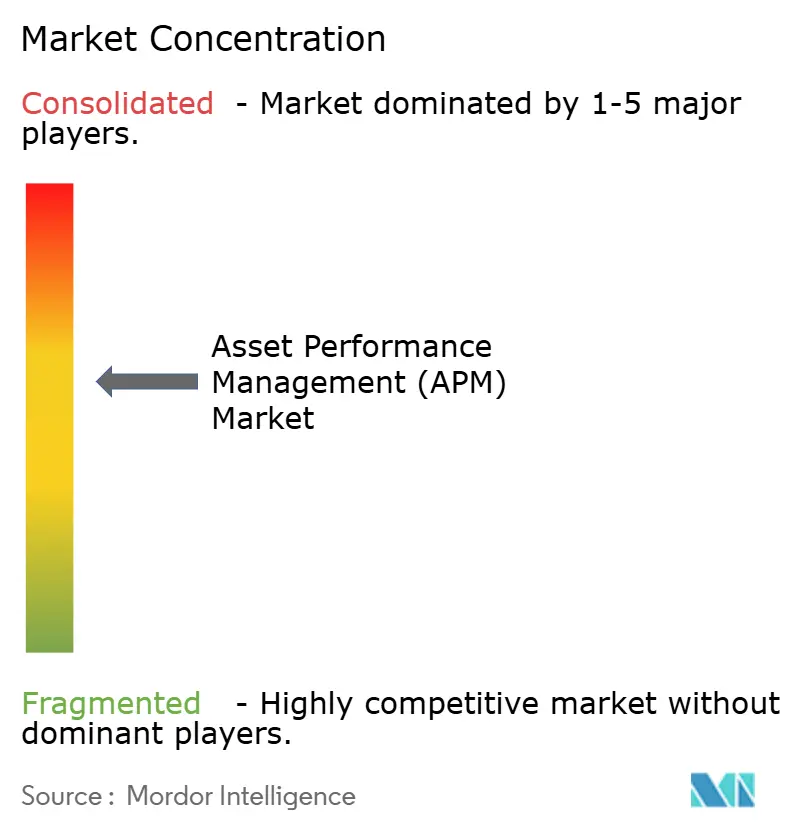
Competitive intensity is moderate, with diversified industrial software giants and focused AI specialists sharing the Asset Performance Management market. GE Vernova, IBM, Siemens, and ABB leverage broad portfolios of hardware, software, and services to secure multi-year enterprise agreements [4]. Their advantage lies in installed sensor networks and decades of process know-how that underpin robust anomaly libraries.
Emerging players such as UptimeAI, AssetWatch, and MaxGrip position themselves around cloud-native architectures and pretrained AI models that can be deployed within weeks. These challengers often partner with system integrators to reach regulated industries. Differentiation turns on the depth of domain content, the ease of integration with existing OT systems, and transparent ROI dashboards that resonate with finance teams.
Strategic mergers and funding rounds shape market evolution. Siemens acquired an Altair division to blend simulation and real-time analytics, while Baker Hughes bought ARMS Reliability to deepen energy-sector offerings. Yokogawa’s investment in UptimeAI illustrates incumbent appetite for best-of-breed AI. Vendors also stress open API ecosystems to embed APM outputs into ERP, CMMS, and risk-management suites, enabling enterprise-wide decision support.
Asset Performance Management (APM) Industry Leaders
-
ABB Ltd.
-
AVEVA Group plc
-
IBM Corporation
-
SAP SE
-
GE Digital
- *Disclaimer: Major Players sorted in no particular order
Asset Performance Management (APM) Market Companies Covered in this Report
- ABB Ltd.
- AVEVA Group plc
- International Business Machines Corporation
- SAP SE
- General Electric Company (GE Digital)
- Aspen Technology, Inc.
- DNV AS
- Siemens AG
- ABS Group of Companies, Inc.
- Uptake Technologies, Inc.
- SAS Institute Inc.
- Emerson Electric Co.
- Honeywell International Inc.
- Schneider Electric SE
- Rockwell Automation, Inc.
- Bentley Systems, Incorporated
- Oracle Corporation
- Hexagon AB
- Yokogawa Electric Corporation
- IFS AB
- Hitachi, Ltd. (Hitachi Energy)
- PTC Inc.
Read Analysis of Asset Performance Management (APM) Companies
Market Opportunities and Future Outlook
A key opportunity is the expansion of digital-twin-enabled APM from monitoring into operations-ready decision support. In April 2026, ABB integrated its Genix Industrial IoT and AI Suite with NVIDIA Omniverse and Microsoft Azure to advance industrial digital twins with immersive 3D visualization. This points to a vendor focus on higher-fidelity asset context and faster cross-functional collaboration (engineering, operations, and maintenance) around a shared asset model, rather than siloed dashboards.
Another whitespace is unifying operational intelligence with enterprise execution and capital planning, so APM outputs directly inform maintenance, production, and investment decisions. In May 2026, AVEVA and IFS announced a partnership around AI-powered Continuous Asset Decision Intelligence to connect operational, execution, and capital data, while AVEVA also highlighted new capabilities to embed AI across industrial organizations and data infrastructure, including PI Audit Reporter. Together, these moves reflect buyer demand for governed and auditable analytics that feed EAM and CMMS workflows (for example, SAP, IBM Maximo, and ServiceNow), along with cloud collaborations that scale industrial intelligence. The resulting demand creates openings for vendors to package connectors, domain libraries, and compliance-ready reporting into repeatable deployments across process industries, utilities, transportation, and regulated manufacturing.
Recent Industry Developments in Asset Performance Management (APM) Market
- July 2026: ABB announced a strategic minority investment in Gridcog to accelerate advanced energy modelling and microgrid deployment. The investment expands ABB's grid analytics capabilities for APM deployments and energy projects. This move reinforces ABB's position in grid modelling for energy transition and supports broader asset performance initiatives.
- July 2026: ABB and Tata Consultancy Services expanded their 20-year partnership with a multi-year agreement to manage ABB global network operations via an AI-driven network-as-a-service model. The alliance scales ABB's asset performance offerings through AI-enabled managed services. It broadens ABB's capacity to deliver integrated OT IT network optimization for APM across its installations.
- June 2026: Assystem and AVEVA formalized a strategic partnership focused on the digital transformation of critical infrastructure in France, the UK, and the Netherlands. The collaboration strengthens AVEVA’s position in asset decision intelligence and integrates with Assystem’s engineering domain. It accelerates digital modernization of critical infrastructure assets in Europe through enhanced asset intelligence.
Asset Performance Management (APM) Market Report Scope and Research Methodology
Market Definition and Coverage
For this methodology, the asset performance management (APM) market covers software and related services used to monitor asset health, predict failures, and optimize maintenance decisions for physical, industrial assets across asset-intensive industries.
Scope exclusions: pure enterprise asset management suites, one-time hardware sensor sales, and general IT infrastructure monitoring tools are excluded unless they are directly sold as APM use cases.
Segments Covered in This Report
- By Component
- Software
- Services
- By Type
- Predictive Asset Management
- Asset Reliability Management
- Asset Strategy Management
- Prescriptive Asset Management
- By Deployment Model
- On-premises
- Public cloud
- Private cloud
- Hybrid
- By End-user Enterprise Size
- Large Enterprises
- SMEs
- By End-user Vertical
- Oil and Gas
- Metals and Mining
- Manufacturing
- Energy and Utilities
- Transportation and Logistics
- Government and Public Sector
- Chemicals and Pharmaceuticals
- Other Verticals
- By Geography
- North America
- United States
- Canada
- Mexico
- Europe
- Germany
- United Kingdom
- France
- Russia
- Rest of Europe
- Asia-Pacific
- China
- Japan
- India
- South Korea
- Australia
- Rest of Asia-Pacific
- Middle East and Africa
- Middle East
- Saudi Arabia
- United Arab Emirates
- Rest of Middle East
- Africa
- South Africa
- Egypt
- Rest of Africa
- Middle East
- South America
- Brazil
- Argentina
- Rest of South America
- North America
Data Sources, Market Sizing, and Validation
Desk Research
Desk research started by reviewing how asset-intensive industries report reliability and maintenance outcomes, then mapping those outcomes to APM spend. For industry context, we referenced public sources such as the U.S. Energy Information Administration for energy infrastructure, the U.S. Bureau of Labor Statistics for maintenance labor and productivity signals, and NIST for foundational guidance on industrial systems and cybersecurity expectations.
To ground adoption and use-case language, we also reviewed ISO and IEC publications that define maintenance and asset management practices, along with peer-reviewed journals on predictive maintenance and condition monitoring. Company filings, earnings call transcripts, and investor presentations were used to confirm product positioning, typical deployment models, and customer priorities. In parallel, we used paid subscriptions for company financials and intelligence, patent databases, and a global contracts and tenders view to spot where APM-related projects were being funded. These desk sources are illustrative, and we relied on additional public and paid references to collect inputs, cross-check assumptions, and clarify gaps.
Primary Interviews and Surveys
Primary interviews and surveys focused on validating what is actually counted as APM spending inside maintenance and operations budgets, and how often platforms are bundled with adjacent tools. We spoke with asset reliability leaders, plant and maintenance managers, and solution owners across major regions so that inputs on adoption timing, pricing logic, and implementation scope could be corrected where desk signals were thin.
Distribution of primary research fieldwork respondents
| Company type | Respondent position | Region |
|---|---|---|
| Top tier: 28% | CXOs: 16% | APAC: 46% |
| Mid tier: 54% | Functional/Unit leaders: 37% | EMEA: 29% |
| Smaller Players: 18% | Managers: 47% | Americas: 25% |
Market-Sizing & Forecasting
Sizing was built using a top-down model where asset base intensity and digital maintenance adoption patterns were used to reconstruct APM addressable spend by industry and region, then converted into revenue using a typical subscription plus services mix. To keep the totals realistic, we corroborated the outputs with selective bottom-up checks such as sampled vendor revenue splits, channel feedback on average deal sizes, and a simple volume times ASP sanity check for common plant-level deployments.
Key inputs included industrial output and capacity investment cycles, the share of maintenance shifting toward condition-based and predictive programs, cloud versus on-premises preference for operational data, typical contract lengths for APM subscriptions, and services attach rates for integration and ongoing optimization. Where primary inputs were inconsistent by industry, we used conservative ranges, then tightened them through follow-up calls and cross-checks against public project announcements.
Forecasting used scenario analysis supported by expert consensus on how fast reliability programs scale after pilots, followed by trend-based smoothing of adoption rates across regions. This supports step-changes (for example, faster upgrades after cybersecurity or safety events) without forcing a straight-line curve that does not match buying behavior.
Data Validation & Update Cycle
Validation is done through multiple checks before final sign-off. Model outputs are compared against independent signals such as large-project award activity, reported digital operations spending trends in asset-heavy industries, and implied spend per site for common APM rollouts.
Outliers are reviewed at the assumption level, and we re-contact sources when pricing, deployment scope, or adoption timing appears inconsistent across geographies. A second analyst review is used to confirm that definitions, currency treatment, and year cutoffs were applied consistently. Reports are refreshed annually, with interim updates when material changes affect adoption or pricing, and a final pre-delivery pass is completed so clients receive the latest updated view.
Mordor Intelligence's Asset Performance Management Market Estimate Compared With Other Published Estimates
Published APM market estimates can differ widely because firms do not always count the same revenue streams, and they also apply different base years, currency timing, and enterprise scope. Differences also show up when one study focuses mainly on software, while another includes broader operational analytics and long-term services.
By tracking deal scope and subscription plus services mix through primary checks, Mordor Intelligence keeps the estimate tied to APM-specific usage within maintenance and reliability teams, which reduces inflation from adjacent categories that sit outside day-to-day asset performance programs.
Benchmark comparison
| Source | Market Size | Gaps in Research Methodology |
|---|---|---|
| Mordor Intelligence | USD 19.67 B (2025) | |
| Global Consultancy A | USD 4.80 B (2025) | This estimate appears closer to an APM software-only boundary, with narrower inclusion of implementation, integration, and ongoing optimization services, which can materially reduce the total value. |
| Industry Press Release B | USD 1.91 B (2024) | This number is anchored to a smaller base-year scope and tends to emphasize packaged platform revenue, which can exclude plant-level services and hybrid deployments that are common in early APM rollouts. |
The spread in values mainly comes down to what gets counted as APM and whether services tied to deployment and value realization are included. Our approach stays repeatable by using clear scope rules, a demand-linked adoption curve by industry, and simple revenue conversion assumptions that can be rechecked as new project and pricing signals emerge.
Key Questions Answered in the Report
What is the current value of the Asset Performance Management market?
The asset performance management market size is expected to grow from USD 19.67 billion in 2025 to USD 22.34 billion in 2026 and is forecast to reach USD 42.26 billion by 2031 at 13.59% CAGR over 2026-2031.
Which segment is expanding fastest within Asset Performance Management?
Prescriptive analytics posts the quickest 18.63% CAGR as enterprises move beyond failure prediction toward autonomous decision guidance.
Why are hybrid cloud models gaining ground in Asset Performance Management deployments?
Hybrid architectures balance data-sovereignty and cybersecurity needs with the scalability of public cloud analytics, driving a 21.85% CAGR through 2031.
How does Asset Performance Management support ESG goals?
By minimizing unplanned outages and optimizing asset lifecycles, platforms reduce energy waste and emissions, aligning maintenance programs with sustainability targets.
Which region leads spend on Asset Performance Management solutions?
North America currently leads with 32.58% share, yet Asia-Pacific is the fastest-growing region due to aggressive industrial digitalization initiatives.