
Aspartic Acid Market Size and Share
Market Overview
| Study Period | 2021 - 2031 |
|---|---|
| Market Size (2026) | USD 129.51 Million |
| Market Size (2031) | USD 177.69 Million |
| Growth Rate (2026 - 2031) | 6.52 % |
| Fastest Growing Market | North America |
| Largest Market | Asia Pacific |
| Market Concentration | Low |
Major Players *Disclaimer: Major Players sorted in no particular order Image © Mordor Intelligence. Reuse requires attribution under CC BY 4.0. | |
Aspartic Acid Market Analysis by Mordor Intelligence
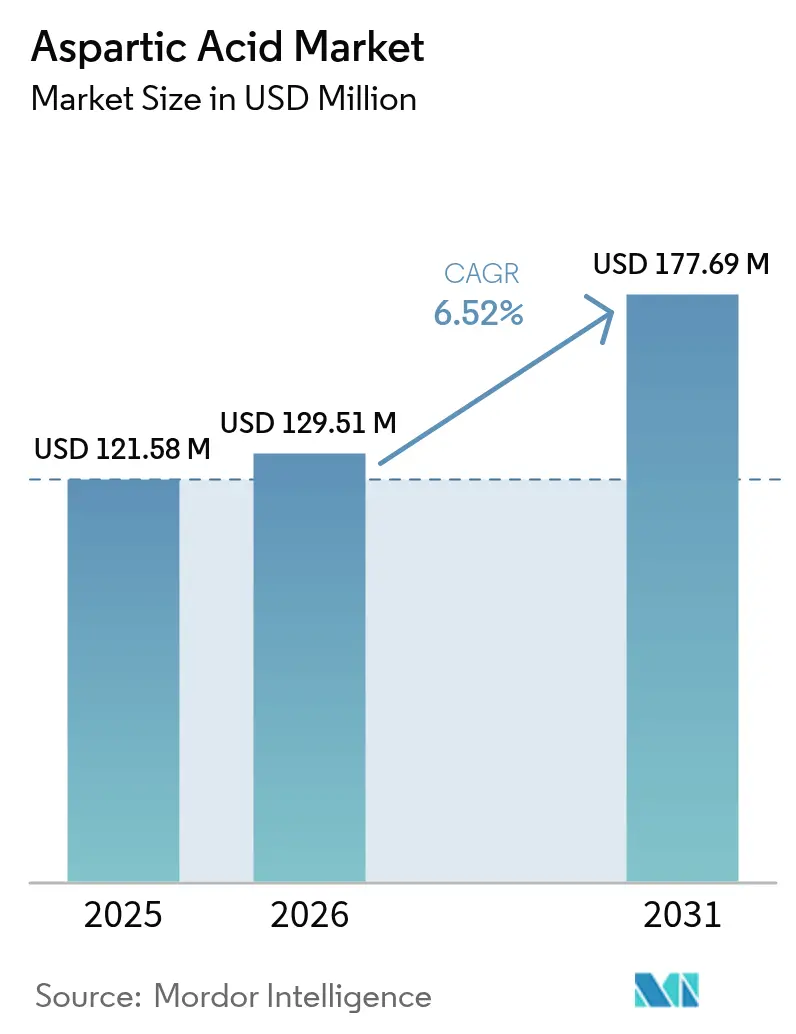
The Aspartic Acid market size is expected to grow from USD 121.58 million in 2025 to USD 129.51 million in 2026 and is forecast to reach USD 177.69 million by 2031 at 6.52% CAGR over 2026-2031. The market demonstrates consistent growth due to its essential applications across multiple industries. Aspartic Acid serves as a key component in food and beverage manufacturing, particularly in the production of artificial sweeteners like aspartame, which enables the development of sugar-free and low-calorie products aligned with consumer preferences. In pharmaceuticals, aspartic acid plays a vital role in medication and supplement formulations, supporting both therapeutic and nutritional needs. The market growth is also driven by its applications in sustainable industrial processes, including biodegradable polymers and phosphate-free detergents, which align with current environmental regulations. The increasing demand for performance nutrition and dietary supplements has enhanced aspartic acid usage in sports and wellness products. The expanding application range, coupled with improvements in bio-fermentation production techniques, establishes aspartic acid as an essential component in health-focused and sustainable solutions.
Key Report Takeaways
- By type, L-aspartic acid commanded 70.48% of the aspartic acid market share in 2025, while D-aspartic acid is projected to grow at a 7.79% CAGR to 2031.
- By production method, bio-fermentation captured 58.82% revenue share in 2025; the segment is forecast to expand at an 8.18% CAGR through 2031.
- By purity grade, food-grade held 45.77% of the aspartic acid market size in 2025, whereas pharmaceutical-grade is advancing at an 8.32% CAGR during 2026-2031.
- By application, food and beverage accounted for 40.69% of the aspartic acid market share in 2025, while nutraceuticals and dietary supplements are forecast to expand at an 8.02% CAGR through 2031.
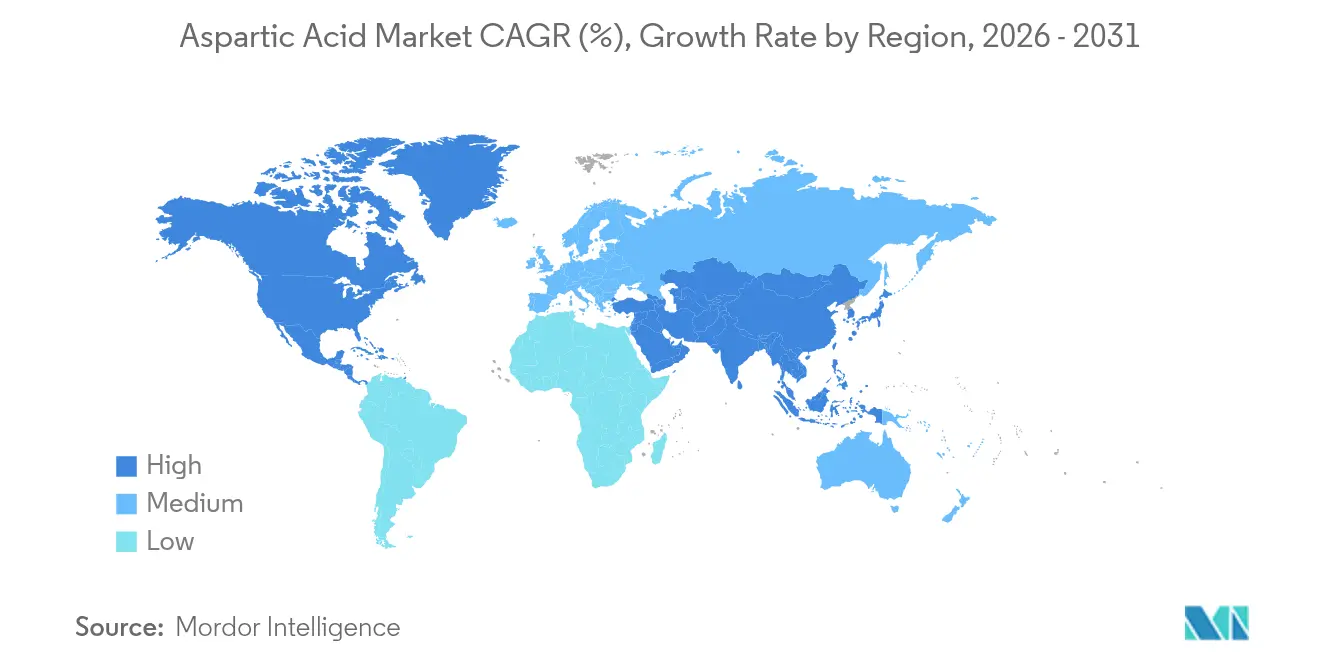
- By geography, Asia-Pacific led with 43.21% market share in 2025, while North America exhibits the fastest regional CAGR of 8.77% for 2026-2031.
Note: Market size and forecast figures in this report are generated using Mordor Intelligence’s proprietary estimation framework, updated with the latest available data and insights as of 2026.
Market Trends and Insights
Drivers Impact Analysis of Aspartic Acid Market*
| Driver | (~) % Impact on CAGR Forecast | Geographic Relevance | Impact Timeline |
|---|---|---|---|
| Increasing demand for aspartic acid in asian detergent additives | +1.2% | Asia-Pacific core, spill-over to Middle-East and Africa | Medium term (2-4 years) |
| Growing demand for D-aspartic acid in male-fertility sports nutrition | +0.8% | North America and European Union, expanding to Asia-Pacific | Short term (≤ 2 years) |
| Rise in subsidies for green amino-acid manufacturing | +1.1% | Global, with concentration in the United States, the European Union, China | Long term (≥ 4 years) |
| Increase in the adoption of biodegradable polyaspartate super-absorbents in agriculture | +0.9% | Global, early gains in North America, the European Union | Medium term (2-4 years) |
| Growing demand for aspartic-based chelating agents owing to phosphate ban in EU | +1.3% | EU core, regulatory spill-over globally | Short term (≤ 2 years) |
| Increasing industrialization and disposable income in developing countries | +1.0% | Asia-Pacific, Latin America, Middle-East and Africa | Long term (≥ 4 years) |
| Source: Mordor Intelligence | |||
Increasing demand for Aspartic acid in Asian Detergent Additives
The aspartic acid market is experiencing substantial growth, primarily driven by its increasing incorporation in Asian detergent additives. This expansion is fundamentally shaped by evolving consumer preferences, stringent regulatory frameworks, and continuous product innovations across the region. In the Asia-Pacific region, heightened environmental awareness has significantly influenced consumer purchasing patterns toward eco-friendly laundry detergents. This trend is evidenced by data from the Ministry of Internal Affairs and Communications, which reported that Japanese households allocated an average of 4.5 thousand yen to laundry detergents in 2023 [1]. In response to this market evolution, detergent manufacturers have strategically reformulated their product portfolios to include biodegradable and non-toxic components. Aspartic acid-derived polymers have emerged as a crucial ingredient in these formulations, offering dual benefits of environmental sustainability and superior performance as scale and halite inhibitors. This shift toward sustainable detergent additives in the Asian market continues to strengthen the global demand for aspartic acid, establishing a robust growth trajectory for the market.
Growing Demand for D-Aspartic Acid in Male-Fertility Sports Nutrition
The escalating demand for D-aspartic acid (DAA) in male fertility and sports nutrition is a key growth driver for the aspartic acid market, strongly supported by both demographic trends and market innovation. According to the Central Intelligence Agency (CIA) data for 2024, Taiwan and South Korea reported fertility rates of 1.11 and 1.12 children per woman, respectively, the lowest worldwide, highlighting a significant fertility challenge in East Asia. This demographic situation has intensified consumer and government attention on reproductive health solutions. The scientific validation of D-aspartic acid's role in enhancing sperm production and motility has increased its adoption in fertility supplements. Companies are introducing new products incorporating D-Aspartic Acid with complementary fertility-enhancing ingredients to address male reproductive health needs. These supplements target both fertility-focused consumers and sports nutrition users, marketed for their benefits in sperm quality improvement, hormonal regulation, and athletic performance enhancement. The convergence of fertility concerns and sports nutrition requirements continues to strengthen the market position of D-Aspartic Acid, indicating sustained growth potential in the aspartic acid market.
Rise in Subsidies for Green Amino-Acid Manufacturing
The rise in subsidies for green amino acid manufacturing is a significant driver for the aspartic acid market, as government incentives and fiscal support are actively reducing production costs and enabling large-scale adoption of sustainable manufacturing practices. Governments, especially in Asia and India, offer grants, loan subsidies, and production-linked incentive (PLI) schemes to biotechnology and food processing industries, supporting the transition to renewable and plant-based amino acid production. The Indian Department of Biotechnology and the Ministry of Food Processing Industries provide fiscal support to manufacturers, reducing capital expenditure and promoting the development of fermentation-based amino acid facilities. This supportive policy environment has led to increased investments and capacity expansions across the industry. The market growth is further strengthened by increasing consumer demand for plant-based diets and functional foods, prompting manufacturers to develop products that meet both regulatory standards and market demand for natural amino acids. As a result, the combination of government subsidies, supportive regulatory frameworks, and industry innovation is accelerating the adoption of green amino acid manufacturing globally, positioning aspartic acid as a key ingredient in the transition toward more sustainable and environmentally responsible health and nutrition markets.
Increase in the Adoption of Biodegradable Polyaspartic Super-Absorbents in Agriculture
Agricultural applications of biodegradable polyaspartate polymers continue to grow as farmers adopt sustainable alternatives to synthetic super-absorbents. Bio-based hydrogels demonstrate improved water retention and nutrient release capabilities. Starch-based hydrogels with aspartic acid derivatives increase fertilizer efficiency and crop yields while reducing environmental impact. The agricultural sector's transition toward precision farming and sustainable practices drives demand for these materials, especially in regions with water scarcity and irrigation challenges. Government regulations supporting biodegradable agricultural inputs and farmer incentives for sustainable practices increase the adoption of these materials over traditional synthetic options. According to the International Federation of Organic Agriculture Movements (IFOAM), in 2023, Australia led global organic farming with 53 million hectares of organic agricultural land. India followed with 4.48 million hectares, and Argentina with 4.05 million hectares [2]. This widespread adoption of organic farming practices in these countries indicates the expanding market potential for biodegradable polyaspartate polymers in sustainable agriculture.
Restraints Impact Analysis of Aspartic Acid Market*
| Restraint | (~) % Impact on CAGR Forecast | Geographic Relevance | Impact Timeline |
|---|---|---|---|
| Stringent labeling rules on long-term D-aspartate supplementation | -0.7% | Global, stricter in the European Union and North America | Short term (≤ 2 years) |
| Shelf-life instability of aspartic-based chelators in High-pH systems | -0.5% | Global, particularly industrial applications | Medium term (2-4 years) |
| Competition from alternative amino acids and sweeteners in various applications | -0.9% | Global, intense in food and beverage sector | Long term (≥ 4 years) |
| Price volatility of key raw materials impacts manufacturing costs and market stability | -0.8% | Global, acute in Asia-Pacific production hubs | Short term (≤ 2 years) |
| Source: Mordor Intelligence | |||
Stringent Labeling Rules on Long-Term D-Aspartate Supplementation
Regulatory requirements for D-aspartic acid (DAA) supplementation labeling constrain the aspartic acid market by affecting product formulation, marketing, and consumer acceptance. Health Canada and the Food and Drug Administration (FDA) enforce comprehensive labeling requirements for dietary supplements, including cautionary statements, dosage limits, and health claim restrictions. The Food and Drug Administration (FDA)'s February 2025 aspartame review indicates increased scrutiny of amino acid supplements and their health claims. While these regulations protect consumers, they create challenges for manufacturers of high-dose or long-term D-aspartic acid supplements through compliance costs and reduced market potential. The requirement for scientific validation of safety and efficacy for new dietary ingredients like D-aspartic acid further complicates and delays product approvals. These regulatory requirements limit market expansion by creating obstacles for product development, marketing, and consumer confidence in D-aspartic acid supplements.
Shelf-Life Instability of Aspartic-Based Chelators in High-pH Systems
Raw material price volatility significantly constrains the aspartic acid market. Fluctuations in essential input costs, including acetic acid, ammonia, and fumaric acid, directly affect manufacturing expenses and market stability. These materials experience price variations due to agricultural yield changes, energy price movements, and geopolitical events that impact trade routes and tariffs. The implementation of new United States tariffs in 2025 increased duties on key precursor chemicals, resulting in higher input costs for aspartic acid manufacturers and causing margin pressure across industrial segments. While manufacturers attempt to adapt through alternative sourcing strategies and pass-through agreements, these measures only partially address the cost uncertainties. Although production technology improvements and increased scale may help stabilize prices over time, short-term volatility persists. This price instability affects planning for both producers and buyers, potentially limiting investment and market growth, particularly in competitive sectors like food, pharmaceuticals, and biodegradable polymers, where cost management directly influences profitability and market position.
*Our forecasts treat driver/restraint impacts as directional, not additive. The impact forecasts reflect baseline growth, mix effects, and variable interactions.
Aspartic Acid Market Segment Analysis
By Product Type:
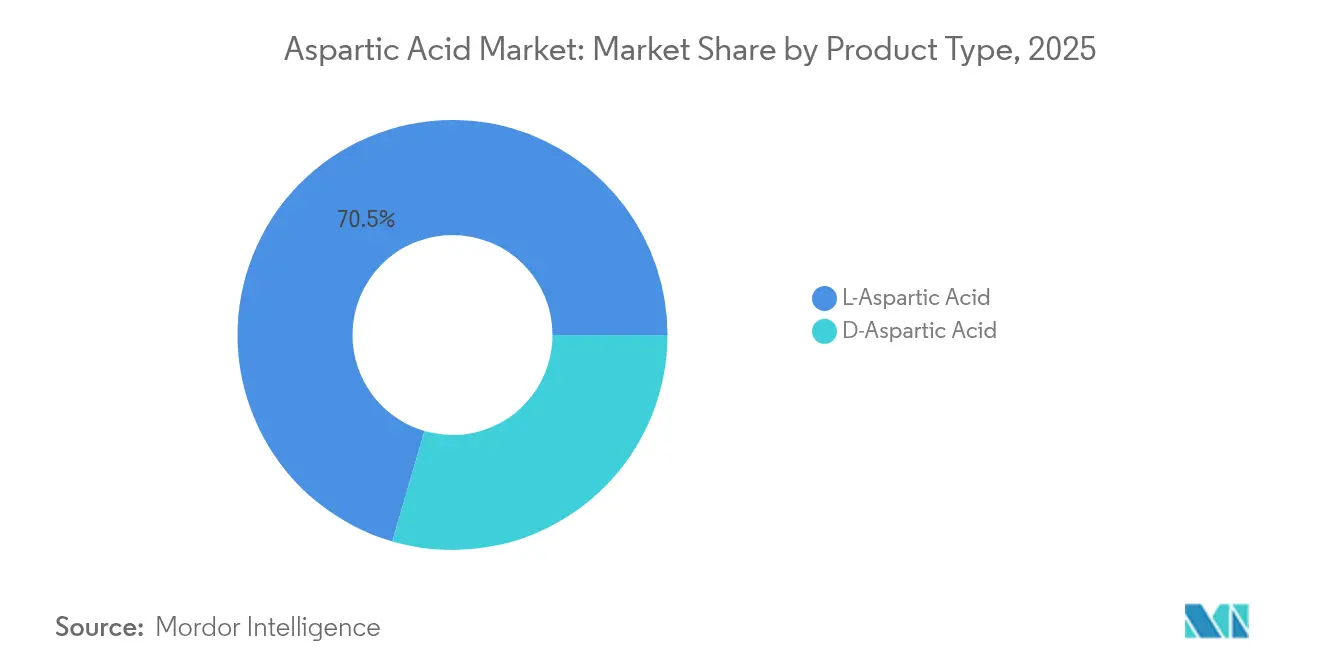
L-Aspartic Dominates While D-Aspartic AcceleratesL-Aspartic Acid dominates the market with a 70.48% share in 2025. This significant market position stems from its essential role across multiple industries. In the food sector, L-Aspartic Acid is essential for aspartame synthesis, a common artificial sweetener in food and beverage manufacturing, meeting the increasing demand for low-calorie and sugar-free products. The compound is also vital in pharmaceutical formulations as a component for drugs and supplements, and in industrial detergent manufacturing as a chelating agent that improves cleaning performance. The established production infrastructure and broad industrial applications of L-Aspartic Acid strengthen its market position.
D-Aspartic Acid represents the market's fastest-growing segment, with a projected CAGR of 7.79% from 2026 to 2031. This growth results from its increased use in performance nutrition and reproductive health supplements. The compound has gained recognition for supporting hormonal balance, particularly testosterone levels, making it valuable in sports nutrition products for athletes and fitness enthusiasts. Its role in male reproductive health has also increased its presence in fertility supplements. The combination of growing consumer interest in fitness, athletic performance, and reproductive health, along with research supporting D-Aspartic Acid's effectiveness, drives its market expansion in specialized health and nutrition products.

By Production Method:
Bio-fermentation Revolutionizes ManufacturingBio-fermentation has established itself as the predominant production methodology for aspartic acid, commanding 58.82% of the market share in 2025 and exhibiting substantial growth potential with an 8.18% CAGR through 2031. This market dominance is attributed to its operational cost-effectiveness, production scalability, and environmental sustainability characteristics, rendering it particularly advantageous for large-scale industrial applications. The methodology employs specific microorganisms for the conversion of raw materials into aspartic acid, consequently minimizing environmental impact while addressing increasing market requirements for sustainable manufacturing protocols. The bio-fermentation process has gained significant traction in the food and beverage industry, where it serves as an essential component in the large-scale production of aspartic acid, particularly for sweetener applications such as aspartame, where production volume and quality consistency are paramount considerations.
Chemical synthesis methodologies maintain a substantial market presence in the aspartic acid industry, particularly in applications necessitating expedited processing capabilities, precise yield control, and consistent product specifications. The methodology encompasses the transformation of maleic anhydride or fumaric acid through established processes of ammonolysis or reductive amination, providing manufacturers with predictable cost structures and well-established industrial supply chain networks. This production approach remains particularly viable in geographical regions characterized by developed petrochemical infrastructure or areas experiencing limitations in fermentation feedstock availability. Furthermore, chemical synthesis facilitates the production of multiple aspartic acid variants, including L-aspartic acid and D-aspartic acid, thereby addressing increasing demand requirements within pharmaceutical and nutraceutical manufacturing applications.
By Purity Grade:
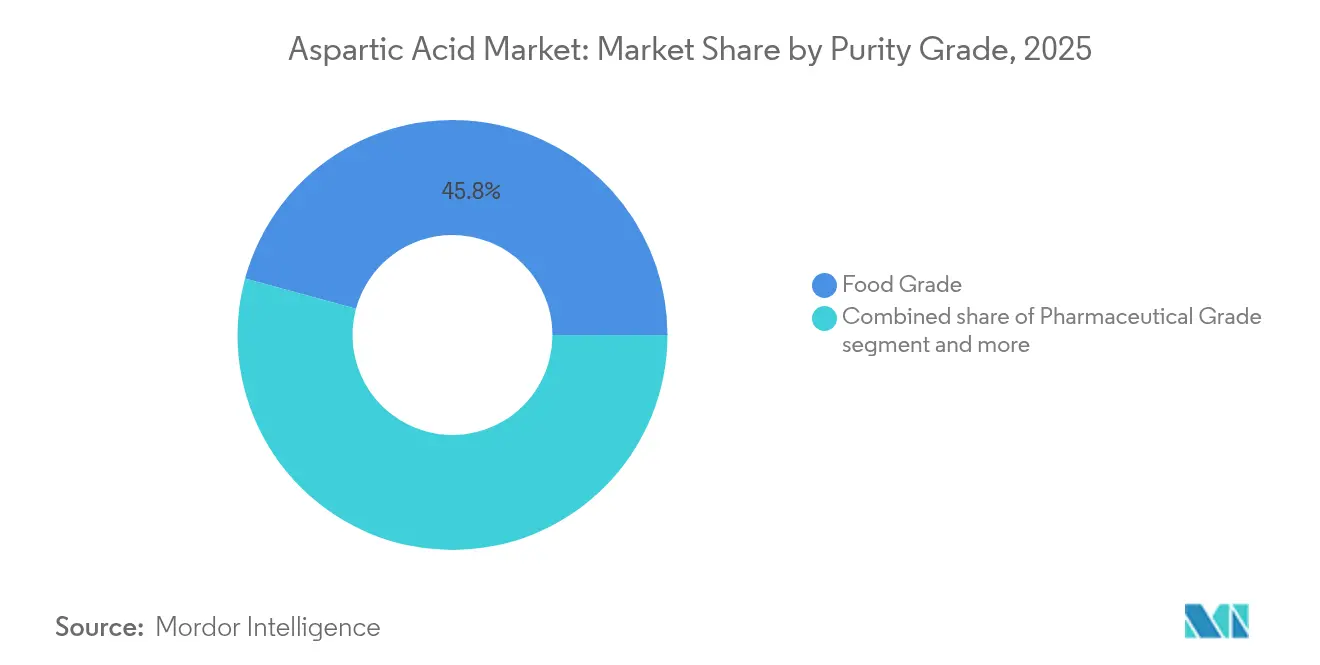
Pharmaceutical Applications Drive Premium SegmentFood-grade aspartic acid maintains market dominance, accounting for 45.77% market share in 2025, attributed to its substantial utilization in food additives, beverage formulations, and nutritional supplement manufacturing. The Pharmaceutical Grade segment demonstrates significant market advancement with a projected CAGR of 8.32% during 2026-2031, primarily attributed to its integration in advanced drug delivery systems and biopharmaceutical applications. The expansion of the peptide-based pharmaceutical market, with substantial presence in North America and accelerated growth in the Asia-Pacific region, has intensified the demand for pharmaceutical-grade aspartic acid in specialized peptide synthesis and pharmaceutical formulations.
Industrial grade aspartic acid maintains a consistent market presence through its established applications in detergent manufacturing, water treatment processes, and agricultural product development. The differentiation in purity grades and their corresponding industrial applications significantly contributes to market expansion, as each grade demonstrates specific functionality and performance characteristics in meeting stringent industrial requirements and technical specifications. The strategic importance of varying purity grades in industrial processes underscores the compound's versatility across multiple manufacturing sectors.
By Application:
Nutraceuticals Outpace Traditional Food UsesThe Food and Beverage sector maintains market leadership in aspartic acid applications, commanding 40.69% of the market share in 2025. This market dominance is attributed to aspartic acid's fundamental role in flavor enhancement, specifically as a crucial component in aspartame synthesis, an artificial sweetener utilized extensively in low-calorie and sugar-free product formulations worldwide. The compound demonstrates significant utility in food preservation, shelf-life extension, and nutritional fortification across international processed food, beverage, and functional product markets. The sector's established global manufacturing infrastructure and persistent international consumer demand for nutritious, fortified convenience foods maintain the compound's substantial market presence.
The Nutraceuticals and Dietary Supplements segment exhibits substantial growth potential, with projections indicating a CAGR of 8.02% from 2026 to 2031, establishing it as the fastest-expanding application segment internationally. This growth trajectory corresponds to heightened global consumer awareness regarding health optimization and preventive nutrition, generating increased international demand for supplements that enhance energy metabolism, muscle recovery, and comprehensive health maintenance. Aspartic acid has established significant market presence in international amino acid formulations, performance nutrition products, and reproductive health supplements. The global expansion of personalized nutrition solutions and increasing international focus on proactive health management continue to drive aspartic acid incorporation in supplement formulations across markets worldwide.
Geography Analysis
APAC Aspartic Acid Market
Asia-Pacific commands 43.21% of the aspartic acid market, supported by its manufacturing infrastructure, feedstock availability, and increasing domestic demand across end-use sectors. China leads the regional production capacity through government and private sector investments in amino acid manufacturing facilities. The country's agricultural strength provides a significant advantage; the United States Department of Agriculture (USDA)'s Grain and Feed Update reports China's corn production reached 294.9 million metric tons in MY 2024/25, a 2% increase from the previous year . This corn production growth increases the availability of fermentation feedstocks, including glucose and starch derivatives, essential for L- and D-aspartic acid production through bio-fermentation. The region maintains its market leadership through an integrated production-to-consumption system, driven by urbanization, increasing incomes, and changing health preferences.
North America Aspartic Acid Market
North America demonstrates the highest regional growth rate, with a projected CAGR of 8.77% from 2026 to 2031. This growth stems from increased demand in pharmaceutical and nutraceutical sectors, where aspartic acid is essential for amino acid therapies, dietary supplements, and hormone-regulating compounds. The United States and Canada excel in commercializing functional ingredients, backed by robust research and development infrastructure and a regulated market environment that supports innovation. The region's focus on sports nutrition, clinical nutrition, and clean-label formulations drives advanced applications of aspartic acid and its derivatives. The growth of contract manufacturers and biotechnology companies enables rapid production scaling to meet emerging health trends.
Europe Aspartic Acid Market
Europe maintains its market position through regulatory requirements and sustainability initiatives. The European Union's phosphate ban has increased the use of aspartic acid derivatives in detergents and water treatment applications as alternatives to phosphate-based chelating agents. The region's commitment to biodegradable solutions has increased the adoption of aspartic acid-based polymers in agricultural applications for water retention and nutrient delivery systems. The United Kingdom market demonstrates growth potential due to consumer preference for sugar-free alternatives and government support for environmentally friendly materials. Europe's pharmaceutical industry utilizes aspartic acid in drug formulations, contributing to the region's diverse application range and market stability.
Regulatory Landscape
Aspartic acid used in food applications is governed by additive and ingredient frameworks that define permitted uses, identity, and labeling. In the United States, L-aspartic acid is listed under the FDA framework as Generally Recognized as Safe (GRAS) for use consistent with good manufacturing practice (21 CFR 582.5017), supporting broad use as a flavoring agent/adjuvant and nutrient supplement, while placing responsibility on manufacturers for GMP compliance and appropriate claims.
In the European Union, additives and their conditions of use are managed through the EU positive list and the common authorization procedure, anchored in Regulation (EC) No 1333/2008 and Regulation (EC) No 1331/2008, with safety evaluations and re-evaluations conducted by EFSA. Because aspartic acid is a key upstream input for aspartame (E 951), ongoing EFSA scrutiny of sweeteners, along with EU requirements to label additives by name or E-number, shapes documentation, specifications, and labeling practices for downstream food and beverage formulations.
Competitive Landscape
The aspartic acid market exhibits fragmentation, with market share distributed between local, regional, and international players. Ajinomoto Co. Inc., Evonik Industries AG, Kirin Holdings Company, and Merck KGaA occupy prominent market positions. These companies maintain their market presence through vertical integration and advanced technological capabilities. Chinese manufacturers have emerged as strong competitors by leveraging cost advantages and expanding their production capacities. The market demonstrates a distinct segmentation between companies focused on high-volume production and those targeting pharmaceutical and nutraceutical applications.
Bio-fermentation technology advancement has emerged as a key competitive differentiator. Ajinomoto Group's 2024 Sustainability Report outlines the company's commitment to improving food nutritional value through amino acids while targeting to reduce environmental impact by 50%. The pharmaceutical sector offers expansion opportunities, encouraging partnerships between amino acid manufacturers and pharmaceutical companies.
The competitive landscape is influenced by increasing demand for aspartic acid in food additives, pharmaceuticals, and feed additives. Companies are investing in research and development to enhance production efficiency and develop new applications. Additionally, regulatory compliance and quality certifications have become essential factors in maintaining market competitiveness, particularly in pharmaceutical and food-grade applications.
Aspartic Acid Industry Leaders
-
Ajinomoto Co. Inc.
-
Evonik Industries AG
-
Kirin Holdings Company
-
CJ CheilJedang Corp.
-
Merck KGaA
- *Disclaimer: Major Players sorted in no particular order

Aspartic Acid Market Companies Covered in this Report
- Ajinomoto Co. Inc.
- Evonik Industries AG
- Kirin Holdings Company
- CJ CheilJedang Corp.
- Merck KGaA
- DIC Corporation
- Alpspure Lifesciences Private Limited
- Iris Biotech GmbH
- Fengchen Group Co.,Ltd
- AnaSpec Inc.
- Simson Pharma Limited
- Bio-Techne Corporation
- Alpha Chemika
- Zhangjiagang Huachang Pharmaceutical Co.,Ltd.
- CDH Fine Chemical
- Kishida Chemical Co.,Ltd. Manufacturer
- Tokyo Chemical Industry Co.
- Anmol Chemicals Pvt.Ltd
- Aditya Chemicals Limited
- AvansChem Speciality Chemicals
Market Opportunities and Future Outlook
Opportunities center on sustainability-driven reformulation and higher-specification end uses that favor reliable, GMP-aligned supply. EU phosphate restrictions that steer formulators toward alternative chelating agents keep detergents and water-treatment applications relevant for aspartic acid derivatives, and the market shift toward bio-fermentation (58.82% share in 2025) corresponds with subsidy programs cited for green amino-acid manufacturing, alongside customer requirements to reduce process waste and carbon intensity.
Capacity actions and technology changes create actionable space for suppliers that can secure feedstocks, maintain quality systems, and respond regionally. Asia-Pacific already leads with 43.21% share in 2025, and China and Thailand have been focal points for amino-acid manufacturing investments by established producers, which raises the bar for food-grade supply on cost and scale. In parallel, emerging green-process routes for L-aspartic acid that reduce reliance on traditional precipitation pathways, while improving extraction yields and purity, support a premium pathway for pharmaceutical-grade and nutraceutical applications where brand owners and contract manufacturers place weight on documentation, consistency, and impurity control.
Recent Industry Developments in Aspartic Acid Market
- April 2026: No major, verifiable in-scope company-level event meeting the inclusion thresholds was identified from the provided evidence set for 2026. Market participants continued to operate under existing FDA and EU additive frameworks that govern aspartic acid use in foods and influence downstream demand through sweetener and labeling compliance.
- February 2025: The US FDA reaffirmed heightened scrutiny on sweeteners through its aspartame review, reinforcing the compliance environment around claims and labeling for products connected to aspartame supply chains. This increased attention influences how ingredient suppliers and brand owners substantiate safety narratives and manage regulatory documentation for amino-acid-derived formulations.
- November 2024: MeiHua Holdings Group Co., Ltd. acquired the amino acid and Human Milk Oligosaccharide businesses from Kyowa Hakko Bio Co., Ltd. for USD 68.8 million. With Kyowa Hakko Bio involved in pharmaceutical-grade amino acids, the deal reshaped ownership of capabilities relevant to high-purity aspartic acid and strengthened MeiHua's platform in specialty amino-acid portfolios.
Aspartic Acid Market Report Scope and Research Methodology
Market Definition and Coverage
This market covers the value of aspartic acid sold for downstream use across food, dietary supplement, pharmaceutical, cosmetic, and industrial applications, counted at the point where the material is commercially traded and priced in USD.
Scope exclusions: It excludes captive internal transfers inside integrated plants and it excludes downstream finished products where aspartic acid is only one ingredient.
Segments Covered in This Report
- By Product Type
- L-Aspartic Acid
- D-Aspartic Acid
- By Production Method
- Bio-fermentation
- Chemical Synthesis
- By Purity Grade
- Food Grade
- Pharmaceutical Grade
- Industrial Grade
- By Application
- Food and Beverages
- Nutraceuticals and Dietary Supplements
- Pharmaceuticals
- Cosmetics and Personal Care
- Others
- Geography
- North America
- United States
- Canada
- Mexico
- Rest of North America
- Europe
- Germany
- United Kingdom
- Italy
- France
- Spain
- Rest of Europe
- Asia-Pacific
- China
- India
- Japan
- Australia
- Rest of Asia-Pacific
- South America
- Brazil
- Argentina
- Rest of South America
- Middle East and Africa
- South Africa
- United Arab Emirates
- Rest of Middle East and Africa
- North America
Data Sources, Market Sizing, and Validation
Desk Research
Desk work starts by mapping the global supply chain for amino acids and then narrowing it to aspartic acid by production routes and end-use demand signals. We mainly use public, non-paywalled sources such as USITC and UN Comtrade trade statistics, the US FDA and EFSA regulatory references for food and supplement usage, USP and other pharmacopeia standards for purity requirements, and World Bank and national statistical offices for macro indicators tied to chemicals output.
To convert those signals into usable inputs, we also review company annual reports, investor presentations, product brochures, and credible press coverage that discusses capacity changes and pricing movement. Where available, paid subscriptions are used for company financials and news screening, as well as patent databases to track process activity and application spillovers. The sources listed here are illustrative only, and many other public materials were also used for data collection, validation, and clarification.
Primary Interviews and Surveys
Primary validation is done through expert calls and structured questionnaires with manufacturers, distributors, and high-use customers, so we can confirm utilization levels, product mix by purity grade, and typical price bands by region. For this global chemical, we also check that application splits and trade flows are consistent across APAC, EMEA, and the Americas before finalizing model assumptions.
Distribution of primary research fieldwork respondents
| Company type | Respondent position | Region |
|---|---|---|
| Top tier: 39% | CXOs: 13% | APAC: 48% |
| Mid tier: 47% | Functional/Unit leaders: 34% | EMEA: 31% |
| Smaller Players: 14% | Managers: 53% | Americas: 21% |
Market-Sizing & Forecasting
Sizing starts with a top-down build that reconstructs demand from application-level consumption indicators and trade-backed supply availability, which are then reconciled to region-level production footprints. We translate this into value using a blended price logic that reflects purity grade mix, production method mix, and the typical spread between contract and spot transactions.
To keep the model practical, we corroborate totals with selective bottom-up approximations, such as a sampled supplier roll-up, channel checks on quoted prices, and volume-times-average-selling-price calculations for a short list of high-visibility flows. Inputs that tend to matter most include fermentative versus synthetic output share, changes in purity requirements in food and pharma uses, import dependence by region, and observed pricing movement tied to feedstock and utilities.
For forecasting, we rely on scenario analysis supported by trend smoothing, since demand is influenced by application growth rates and cost swings rather than a single stable driver. Where bottom-up visibility is limited (for example, small regional traders), gaps are handled through trade-to-consumption ratios and then verified through interview feedback before being locked.
Data Validation & Update Cycle
Outputs are checked in several steps so one unusual assumption does not drift into the final number. We compare modeled consumption and pricing against independent signals like trade values, capacity announcements, and purity-grade standards, and then we re-check any large region-to-region variance before sign-off.
An internal analyst review is done for logic consistency, unit handling, and currency conversion timing, and experts are re-contacted when a key input changes materially. Reports are refreshed annually, and interim updates are triggered by events such as major plant start-ups, shutdowns, or sharp raw material price shifts. Before delivery, we do a final pass so the published view reflects the latest available information.
Mordor Intelligence's Aspartic Acid Market Size Versus Other Published Estimates
Published numbers for aspartic acid often do not match because the year used for sizing is different, the currency conversion date varies, and pricing is sometimes taken from a single-grade proxy instead of a blended realization. Differences also come from whether demand is built from application consumption versus reported production, which can distort markets with active cross-border trade.
A practical gap driver is how often assumptions are refreshed, since contract price resets and purity-grade mix can shift within a year. When the validation loop leans more on trade checks and interview reconfirmations, the estimate tends to track the real transacted market more closely, which is the refresh-led approach used by Mordor Intelligence.
Benchmark comparison
| Source | Market Size | Gaps in Research Methodology |
|---|---|---|
| Mordor Intelligence | USD 129.51 M (2026) | |
| Global Consultancy A | USD 114.10 M (2024) | Uses an earlier sizing year and a different base year, so the price deck and grade mix reflect older conditions, and the result is not directly comparable without re-basing to 2026 USD. |
| Industry Research Group B | USD 93.15 M (2021) | Anchored on a 2021 base with a longer forecast window, which can understate later-period pricing and application growth, especially if currency timing and purity-grade uplift are not updated frequently. |
Looking across the table, the spread is mainly explained by the sizing year chosen and the price logic used to convert volumes into value. By holding the scope steady and aligning currency timing with a current-year price realization, the final figure becomes easier to trace back to clear variables and repeatable steps.
Key Questions Answered in the Report
What is the current size of the aspartic acid market?
The aspartic acid market stands at USD 129.51 million in 2026 and is projected to reach USD 177.69 million by 2031, reflecting a 6.52% CAGR.
Which region leads the aspartic acid market?
Asia-Pacific holds the leading position with 43.21% market share in 2025, supported by large-scale fermentation capacity and robust detergent demand.
Which segment shows the fastest growth?
D-aspartic acid is the fastest-growing type, expanding at a 7.79% CAGR thanks to its sports nutrition and male fertility applications.
Why is bio-fermentation gaining share over chemical synthesis?
Bio-fermentation offers lower carbon footprints, utilizes renewable feedstocks and increasingly benefits from government subsidies that improve operating economics.