Market Overview
| Study Period | 2020 - 2030 |
|---|---|
| Base Year For Estimation | 2024 |
| Forecast Data Period | 2025 - 2030 |
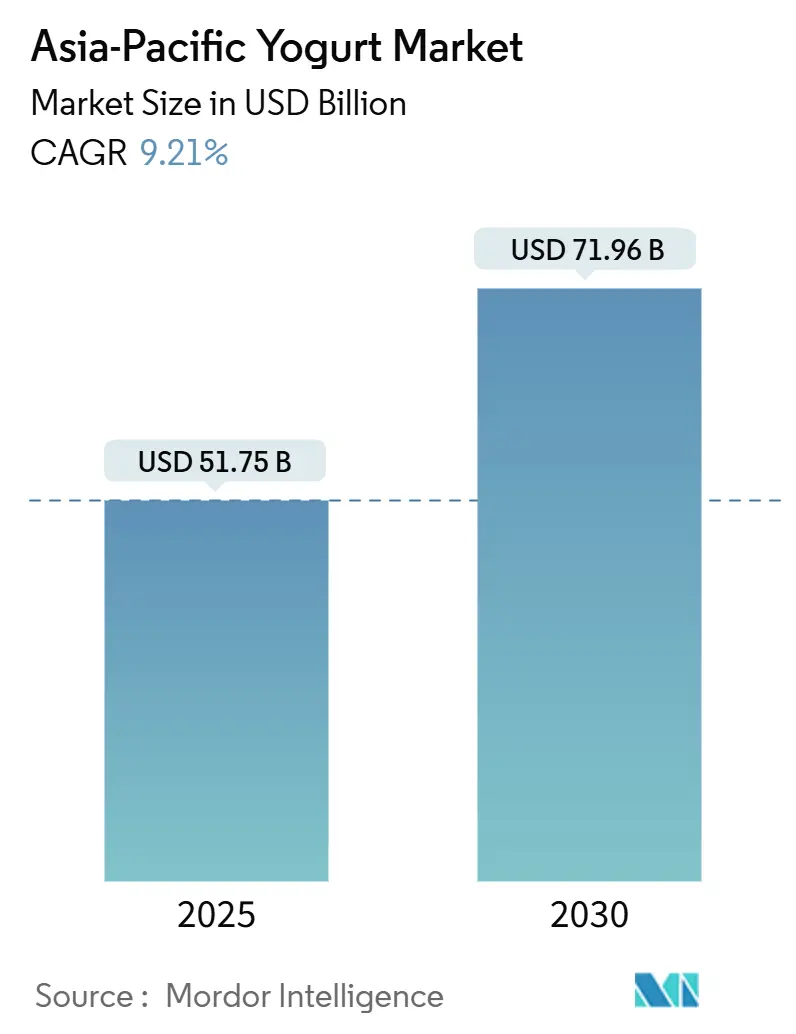
| Market Size (2025) | USD 51.75 Billion |
| Market Size (2030) | USD 71.96 Billion |
| Growth Rate (2025 - 2030) | 9.21% CAGR |
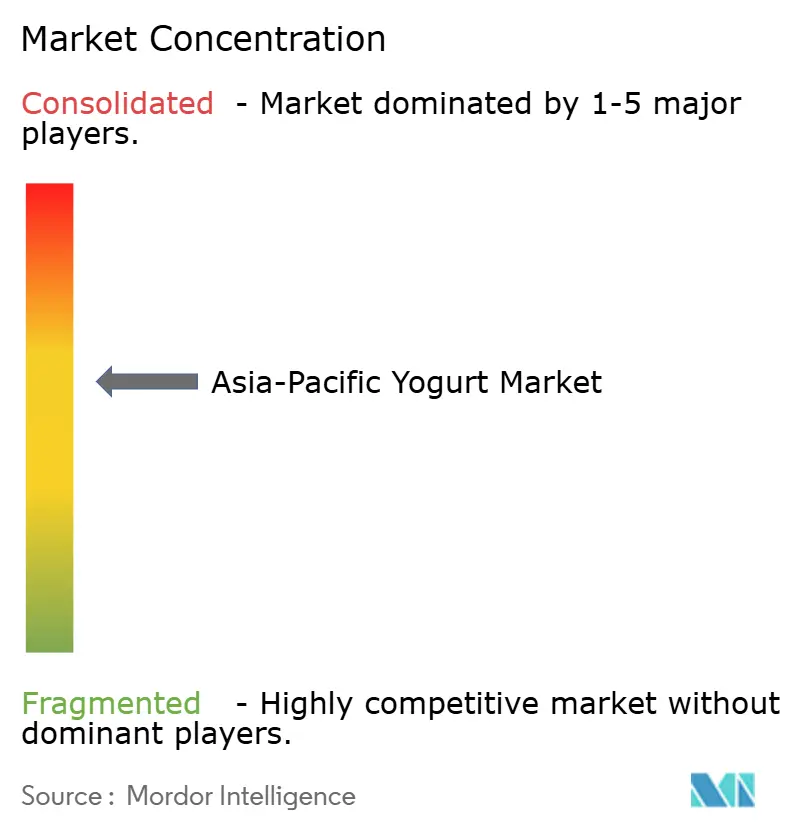
| Market Concentration | Medium |
Major Players
*Disclaimer: Major Players sorted in no particular order Image © Mordor Intelligence. Reuse requires attribution under CC BY 4.0. |
|
Asia-Pacific Yogurt Market Analysis by Mordor Intelligence
The Asia-Pacific yogurt market was valued at USD 51.75 billion in 2025 and is projected to grow to USD 71.96 billion by 2030, with a compound annual growth rate (CAGR) of 9.21%. This growth highlights a significant shift in consumer preferences toward gut health, protein consumption, and convenience across the region. The increasing awareness of the benefits of probiotics and the rising demand for functional foods are driving the adoption of yogurt as a dietary staple. Additionally, the growing urban population and busy lifestyles are contributing to the popularity of yogurt as a convenient and nutritious snack option. The market is also witnessing innovation in flavors, packaging, and product formulations to cater to diverse consumer preferences.
Key Report Takeaways
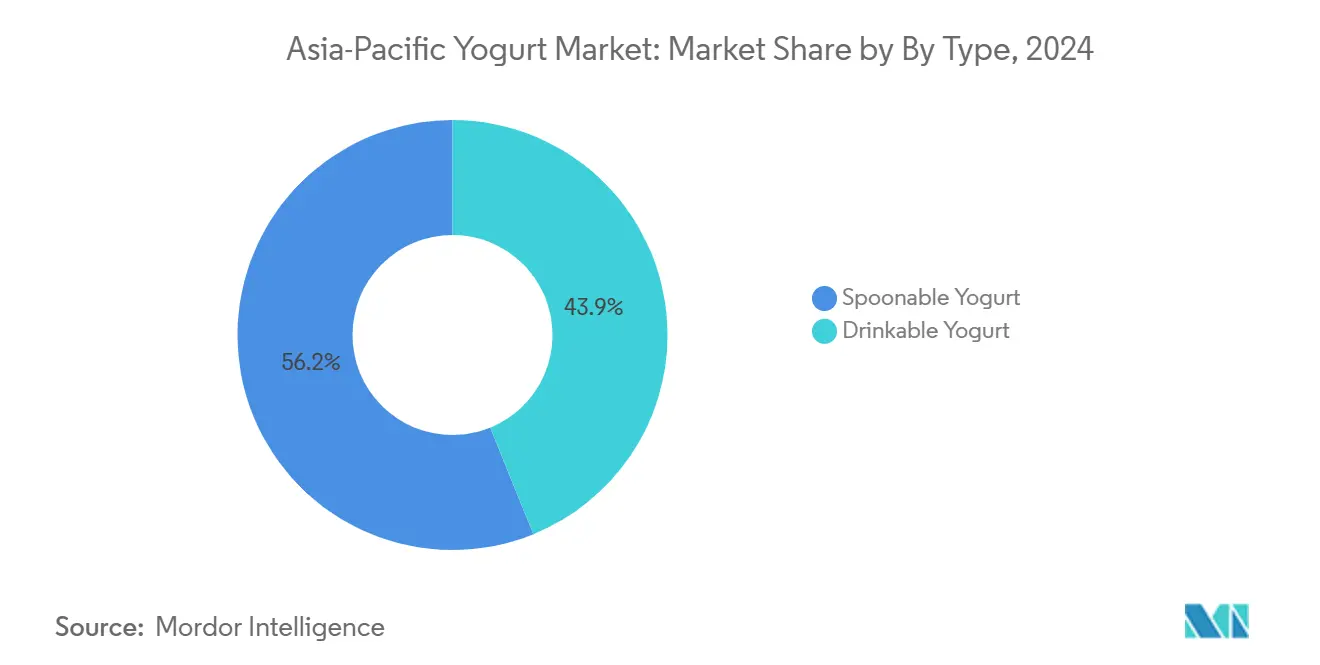
- By type, spoonable yogurt held 56.15% of the Asia-Pacific yogurt market share in 2024; however, drinkable formats are forecast to grow at a 10.25% CAGR to 2030.
- By source, dairy-based offerings commanded 95.01% of 2024 revenue, whereas non-dairy alternatives are poised for the fastest gains with a 10.66% CAGR through 2030.
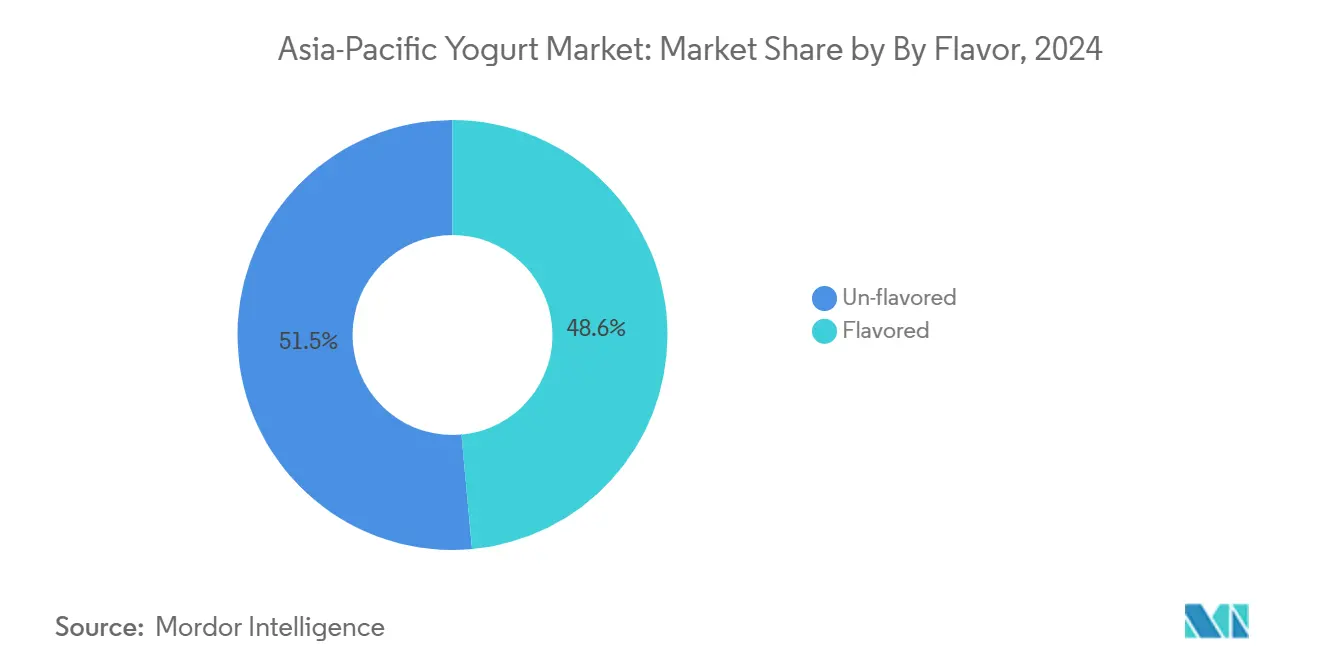
- By flavor, un-flavored products captured 51.45% share in 2024, yet flavored SKUs are on track for an 11.12% CAGR over 2025-2030.
- By distribution channel, off-trade outlets dominated with 86.35% share in 2024; on-trade venues are predicted to expand at a 9.93% CAGR over the same horizon.
- By geography, China led with 45.28% of 2024 regional value, while India is projected to notch the strongest growth at an 11.45% CAGR to 2030.
Asia-Pacific Yogurt Market Trends and Insights
Drivers Impact Analysis
| Driver | (~) % Impact on CAGR Forecast | Geographic Relevance | Impact Timeline |
|---|---|---|---|
| Increasing health consciousness promotes yogurt for probiotics, gut health, and immunity benefits | +2.3% | Global, with peak adoption in Japan, South Korea, Australia | Medium term (2-4 years) |
| Rising lactose intolerance drives demand for low-lactose or lactose-free yogurt variants | +1.8% | China, India, Southeast Asia (Indonesia, Thailand, Malaysia) | Short term (≤ 2 years) |
| Product innovations like flavored, low-fat, Greek, and functional yogurts | +1.5% | Urban centers across China, India, Japan, South Korea, Singapore | Medium term (2-4 years) |
| Growing preference for clean-label, low-sugar, and non-flavored options | +1.2% | Hong Kong, Singapore, Australia, urban China and India | Short term (≤ 2 years) |
| Expansion of plant-based yogurt alternatives caters to vegan and flexitarian diets | +1.4% | Australia, Singapore, urban China, India metro areas | Long term (≥ 4 years) |
| Surge in drinkable yogurt popularity offers convenience for on-the-go consumption | +1.0% | China, India, Indonesia, Thailand, Malaysia | Short term (≤ 2 years) |
| Source: Mordor Intelligence | |||
Understand The Key Trends Shaping This Market
Download PDF
Increasing health consciousness promotes yogurt for probiotics, gut health, and immunity benefits
Probiotic yogurt has transitioned from a niche wellness product to a mainstream dietary staple as Asia-Pacific governments associate non-communicable diseases with gut microbiome imbalances. According to the International Diabetes Federation, the prevalence of diabetes in the region reached 11.9% of adults in 2024[1]Source: International Diabetes Federation, “China,” idf.org. In the same year, diabetes-related health expenditure in China amounted to USD 169 billion[2]Source: International Diabetes Federation, “IDF Diabetes Atlas 11th Edition,” idf.org. Clinical trials published in peer-reviewed journals demonstrate that daily consumption of yogurt containing Lactobacillus rhamnosus GG or Bifidobacterium lactis BB-12 reduces glycemic variability by 8 to 12% over 12 weeks. In September 2025, Yakult Honsha Co., Ltd. announced that its overseas subsidiary, Yakult (Singapore) Pte. Ltd., would begin selling the probiotic lactic acid bacteria beverage Y1000 Toshitsu Off on October 1, 2025. Y1000 Toshitsu Off, which was launched in retail stores in Japan in April 2025, is a probiotic beverage containing the highest concentration of Lacticaseibacillus paracasei strain Shirota in Yakult’s history (1 billion CFUs per ml, or 110 billion CFUs per bottle). The product features 44% less sugar and 32% fewer calories compared to the original Y1000. It is classified as a Food with Function Claims, containing Lacticaseibacillus paracasei strain Shirota, which has been demonstrated to relieve stress and improve sleep quality under conditions of temporary mental stress.
Rising lactose intolerance drives demand for low-lactose or lactose-free yogurt variants
Lactose malabsorption is prevalent across East Asia; however, yogurt consumption in these markets exceeds that of regions with higher lactose tolerance. This is attributed to the fermentation process, which breaks down lactose into simpler sugars, making yogurt easier to digest.In India, the situation is more nuanced, with lactase non-persistence being particularly prevalent in the southern states, where coconut-based curd has traditionally been a preferred choice. A similar trend is observed in South Korea, where plant-based yogurts are increasingly being introduced. In July 2025, Seoul Milk Cooperative launched its plant-based yogurt, 'Cocogurt,' to meet the rising demand driven by the vegan trend. 'Cocogurt' is a premium yogurt alternative made from coconut milk, designed as a dairy substitute. It features a rich tropical fruit flavor, emphasizing the natural sweetness and nuttiness of coconut. With a coconut milk content of 96.3%, the product offers a distinct coconut taste and is fortified with minerals, vitamins, and dietary fiber.
Product innovations like flavored, low-fat, Greek, and functional yogurts
Greek yogurt adoption in the Asia-Pacific region lags behind Europe and North America; however, growth is accelerating as producers adapt the strained yogurt style to align with local preferences. In September 2025, Chobani expanded its Chobani Fit range in Australia by introducing Fit Flip, a high-protein Greek yoghurt paired with crunchy mix-ins. The new product contains no added sugar, provides 16 grams of protein per serving, and is designed for post-workout recovery, convenience, and everyday snacking. Fit Flip is available in three flavor combinations: cocoa soy crisps, vanilla Greek yoghurt with roasted almonds, and no-added-sugar dark chocolate. Functional yogurt, defined as products fortified with ingredients beyond probiotics, represents the fastest innovation vector. In December 2025, Pulmuone Danone introduced its premium high-protein yogurt brand "YoPRO" in Korea, intensifying its focus on the fermented milk market. YoPRO is designed to provide convenient protein supplementation, featuring nine essential amino acids, high protein content, and BCAAs.
Growing preference for clean-label and low-sugar options
Sugar reduction is now both a regulatory requirement and a consumer priority. Regulatory bodies across various regions are implementing stringent measures to limit sugar content in food and beverages, aiming to address public health concerns such as obesity and diabetes. Simultaneously, consumers are increasingly seeking healthier alternatives, driven by growing awareness of the negative health impacts of excessive sugar consumption. This dual pressure from regulations and consumer demand is driving significant changes in the yogurt industry. Australia and Singapore are at the forefront of clean-label adoption. COYO, an Australian brand, introduced an oat-and-coconut yogurt in February 2025, comprising 74% oat milk and 17% coconut cream. This product has been listed in Woolworths and Coles and is available in Natural, Mango, Vanilla Bean, and Strawberry flavors.
Restraints Impact Analysis
| Restraint | (~) % Impact on CAGR Forecast | Geographic Relevance | Impact Timeline |
|---|---|---|---|
| High lactose intolerance rates limit traditional dairy yogurt adoption | -0.9% | China, Southeast Asia (Indonesia, Thailand, Malaysia, Vietnam) | Medium term (2-4 years) |
| Consumer concerns over high sugar content in flavored yogurts | -0.7% | Hong Kong, Singapore, Australia, urban China and India | Short term (≤ 2 years) |
| Inadequate cold-chain infrastructure | -1.1% | India rural areas, Indonesia, Thailand, Vietnam, Philippines | Long term (≥ 4 years) |
| Taste and texture perceptions favor fresh dairy over processed yogurt | -0.5% | Rural China, India, Southeast Asia | Medium term (2-4 years) |
| Source: Mordor Intelligence | |||
Consumer concerns over high sugar content in flavored yogurts
The growth of flavored yogurt masks an underlying structural challenge: the high costs associated with reformulation and potential compromises in taste. In China, regulatory authorities have proposed front-of-pack warning labels for products with high added sugar content, which could impact a substantial portion of flavored yogurts currently on the market [3]Source: State Administration for Market Regulation and Standardization Administration of China, “Guidelines for Graphical Labeling of Nutritional Components in Prepackaged Foods,” std.samr.gov.cn. Manufacturers face a significant challenge, as natural sweeteners like stevia and monk fruit are considerably more expensive than traditional sugar, putting pressure on profit margins. Additionally, consumer acceptance of these alternatives remains uncertain. This situation limits short-term growth, especially in markets where health-conscious preferences align with price sensitivity.
Inadequate cold-chain infrastructure
Cold-chain limitations continue to be a significant barrier in high-growth markets. In Indonesia, the prevalence of traditional trade results in most outlets lacking reliable refrigeration, leading manufacturers to focus on ambient-stable yogurt formats that compromise probiotic viability. In India, rural cold-chain infrastructure has shown only modest improvements despite government incentives under the Pradhan Mantri Kisan Sampada Yojana scheme. The economic impact is evident, as spoilage rates for chilled yogurt in Southeast Asia remain considerably higher compared to countries like Japan and South Korea, where cold-chain systems are more advanced. To mitigate these challenges, companies are investing in ultra-high-temperature processing and aseptic packaging, enabling yogurt to remain shelf-stable until opened. However, these formats are typically sold at lower prices than chilled alternatives, reducing revenue per unit.
Segment Analysis
By Type: Drinkable Formats Gain Traction
Spoonable variants accounted for a 56.15% market share in 2024. Drinkable yogurt is projected to grow at a CAGR of 10.25% from 2025 to 2030. The divergence in yogurt consumption patterns is influenced by urbanization and commuting habits. Drinkable yogurt purchases are predominantly made during morning hours, with peak demand observed in major cities where long commutes influence consumption behavior. Spoonable yogurt remains dominant in markets like Japan and South Korea, where breakfast traditions prioritize sit-down meals and portion control. In Asia, the success of drinkable probiotic beverages through direct sales demonstrates that convenience and consumer trust are more significant drivers of repeat purchases than the product format itself.
The resilience of spoonable yogurt is attributed to its versatility as both a cooking ingredient and a dessert base. In India, Amul’s dahi is deeply ingrained in household culinary practices, being used in dishes such as raita, lassi, and marinades, applications that drinkable formats cannot replicate. In Australia, the Greek yogurt segment, primarily spoonable, has experienced strong growth, driven by its high-protein positioning and premium pricing compared to standard variants.
Get Detailed Market Forecasts at the Most Granular Levels
Download PDF
By Source: Non-Dairy Alternatives Accelerate
Dairy-based products held a 95.01% market share in 2024. Non-dairy yogurt is expected to grow at a CAGR of 10.66% from 2025 to 2030, reflecting the initial phase of plant-based product adoption. This growth is driven by increasing consumer awareness of plant-based diets, rising lactose intolerance cases, and environmental concerns associated with dairy production. Soy continues to be the leading non-dairy base in China, with brands such as Vitasoy and Yili securing strong positions by targeting flexitarian consumers who seek a balance between plant-based and traditional dairy options. Additionally, oat-based yogurt is gradually gaining popularity in markets like Australia and Singapore due to its perceived health benefits, creamy texture, and suitability for individuals with soy or nut allergies.
Dairy-based yogurt maintains its dominance through cooperative structures in countries like India and New Zealand. Amul's extensive farmer network enables cost-effective milk supply, resulting in more competitive retail pricing compared to plant-based alternatives. In Australia and New Zealand, Fonterra leverages its grass-fed positioning to command a premium over conventional dairy yogurt while remaining more affordable than almond or oat-based options. Additionally, lactose-free dairy yogurt caters to consumers seeking the taste and texture of dairy without experiencing digestive discomfort.
By Flavor: Clean-Label Push Elevates Un-Flavored
Un-flavored yogurt commanded 51.45% share in 2024, yet flavored variants are growing faster at 11.12% CAGR from 2025 to 2030, a dynamic that reflects both health-driven simplification and premiumization. Research from Hong Kong’s Centre for Food Safety revealed that many flavored yogurts exceeded WHO sugar thresholds, prompting a shift toward plain yogurt as a customizable option. In Japan, Meiji and Morinaga lead the unflavored yogurt segment, promoting plain yogurt as a breakfast staple often paired with granola and fruit. Trends indicate that plain yogurt is frequently consumed with cereals such as muesli or oats, emphasizing complementary consumption habits.
Flavored yogurt's faster growth is driven by innovation in natural sweeteners and exotic profiles. Yakult Honsha Co., Ltd. announced that its overseas subsidiary, Yakult Danone India Pvt. Ltd. (“Yakult India”), launched the low-sugar, low-calorie Yakult Light Mango Flavor in July 2024. By introducing the popular mango flavor in India, the company aims to enhance consumer interest and boost the consumption of Lactobacillus casei strain Shirota, thereby increasing overall sales of Yakult products. Additionally, in response to the growing health consciousness in India, Yakult Light and the new Yakult Light Mango Flavor are formulated to be low in sugar and enriched with vitamins E and D, catering to the demand for healthier products and supporting consumers in improving their health. Stevia adoption varies across regions, with consumers in countries like Singapore showing a preference for monk fruit over stevia due to its ability to provide sweetness without an aftertaste. As a result, companies have adjusted their flavored yogurt formulations to align with these preferences.
Get Detailed Market Forecasts at the Most Granular Levels
Download PDF
By Distribution Channel: Off-Trade Dominance Persists
Off-trade channels held 86.35% share in 2024, yet on-trade outlets are growing at 9.93% CAGR from 2025 to 2030 as drinkable yogurt becomes a breakfast and snack option in cafés and quick-service restaurants. Supermarkets and hypermarkets remain key channels for yogurt distribution. In China, Alibaba’s Freshippo and JD.com’s 7Fresh stores have significantly increased shelf space for chilled yogurt compared to previous years. Convenience stores, such as FamilyMart and 7-Eleven in Japan, South Korea, and Taiwan, have established a strong presence by emphasizing single-serve drinkable yogurt formats targeted at commuters and students. Additionally, online retail is growing rapidly, driven by subscription models.
On-trade growth is predominantly focused in urban areas. Starbucks China launched a Greek yogurt parfait aimed at office workers who frequently skip breakfast, and the product rapidly gained popularity. In Indonesia, Thailand, and Vietnam, traditional trade continues to depend heavily on ambient-stable yogurt due to limited refrigeration infrastructure. However, modern trade is expected to grow significantly in the coming years, supported by increased investment in cold-chain infrastructure.
Geography Analysis
China dominates the Asia-Pacific yogurt market, accounting for 45.28% of the projected 2024 market value, and drives innovation through increased approvals of probiotic strains. India is forecast to grow at 11.45% CAGR from 2025 to 2030. China's regulatory environment has facilitated the introduction of new probiotic products, enabling manufacturers to cater to evolving consumer preferences for health-focused options. Companies like Yili and Mengniu have enhanced their refrigerated logistics networks, improving access to rural markets by ensuring the efficient distribution of perishable products. This expansion has allowed these companies to tap into previously underserved areas, boosting overall market penetration.
India demonstrates significant growth potential, driven by the cooperative milk networks of Amul and Mother Dairy, along with a government-supported cold-chain program designed to enhance rural reach. Lactose-free product launches are gaining momentum in southern metropolitan areas, where lactose intolerance is more prevalent. In Australia and New Zealand, grass-fed offerings attract sustainability-conscious consumers, while Singapore is positioning itself as a leader in plant-based adoption, with oat-milk yogurt products rapidly gaining market presence.
Japan and South Korea exhibit high per-capita yogurt consumption levels, yet growth persists through functional SKUs featuring collagen and protein, targeting active and aging consumers. Functional SKUs are specialized product variants designed to offer additional health benefits beyond basic nutrition. These products cater to the increasing demand for health-focused options among consumers who prioritize wellness. Clear regulations regarding "intestinal health" claims ensure that most products adhere to live-culture standards, which are essential for promoting digestive health. These standards not only enhance consumer trust but also support the ability of such products to maintain premium price points in the market.
Competitive Landscape
The market exhibits moderate fragmentation, with leading players such as Yili, Mengniu, Danone, Nestlé, and Yakult accounting for a substantial share of regional revenue. This creates opportunities for local companies to maintain their positions by leveraging robust distribution networks and cultural alignment. In China, Yili and Mengniu maintain dominance through vertical integration, encompassing dairy farms, processing facilities, and logistics systems, which enable swift farm-to-shelf delivery while ensuring the preservation of probiotic viability.
Technology adoption is transforming competitive dynamics in the market. JD.com's integration of yogurt sales with food delivery platforms, such as Meituan and Ele.me, facilitated same-day delivery of chilled products across 47 Chinese cities in 2024. This development has significantly reduced the competitive edge of hyperlocal brands, which previously relied on their proximity to consumers for faster delivery. Alibaba's Freshippo stores utilize radio-frequency identification (RFID) tags to monitor yogurt inventory in real time, enabling precise tracking and reducing spoilage by ensuring timely restocking and removal of expired products.
Smaller players are focusing on niche positioning, exemplified by COYO's oat-and-coconut yogurt, which appeals to health-conscious consumers seeking simple and natural ingredient profiles. Patent activity serves as a forward-looking indicator of innovation trends in the market, highlighting areas of potential growth and competition. However, regulatory compliance continues to pose a significant barrier to entry, as companies must navigate complex legal frameworks and standards to ensure product safety and market approval.
Asia-Pacific Yogurt Industry Leaders
-
Meiji Dairies Corporation
-
Danone
-
Yakult Honsha
-
China Mengniu Dairy Company
-
Inner Mongolia Yili Industrial Group
- *Disclaimer: Major Players sorted in no particular order
Need More Details on Market Players and Competitors?
Download PDF
Recent Industry Developments
- November 2025: Seven-Eleven introduced a yogurt product developed using spending data from foreign tourists. The new offering, "Strawberry Compote Greek Yogurt" (4,900 won), is an addition to the YOZM Yogurt range. This product features classic-style Greek yogurt layered over strawberry compote with fruit chunks. By incorporating strawberries, a popular winter fruit, it expands the options available to international customers.
- September 2025: Chobani expanded its Chobani Fit range in Australia by introducing Fit Flip, a high-protein Greek yoghurt paired with crunchy mix-ins. The new product contains no added sugar, provides 16 grams of protein per serving, and is designed for post-workout recovery, convenience, and everyday snacking. Fit Flip is available in three flavor combinations: cocoa soy crisps, vanilla Greek yoghurt with roasted almonds, and no-added-sugar dark chocolate.
- February 2025: COYO, an Australian brand, introduced an oat-and-coconut yogurt, comprising 74% oat milk and 17% coconut cream. This product has been listed in Woolworths and Coles and is available in Natural, Mango, Vanilla Bean, and Strawberry flavors.
Asia-Pacific Yogurt Market Report Scope
Flavored Yogurt, Unflavored Yogurt are covered as segments by Product Type. Off-Trade, On-Trade are covered as segments by Distribution Channel. Australia, China, India, Indonesia, Japan, Malaysia, New Zealand, Pakistan, South Korea are covered as segments by Country.
By Type
| Drinkable Yogurt |
| Spoonable Yogurt |
By Source
| Dairy-based |
| Non-dairy based |
By Flavour
| Flavoured |
| Un-flavoured |
By Distribution Channel
| On-trade | |
| Off-trade | Convenience Stores |
| Specialist Retailers | |
| Supermarkets and Hypermarkets | |
| On-line Retail | |
| Other Distribution Channels |
Country
| China |
| Japan |
| India |
| Australia |
| Indonesia |
| Malaysia |
| South Korea |
| New Zealand |
| Thailand |
| Singapore |
| Rest of Asia-Pacific |
| By Type | Drinkable Yogurt | |
| Spoonable Yogurt | ||
| By Source | Dairy-based | |
| Non-dairy based | ||
| By Flavour | Flavoured | |
| Un-flavoured | ||
| By Distribution Channel | On-trade | |
| Off-trade | Convenience Stores | |
| Specialist Retailers | ||
| Supermarkets and Hypermarkets | ||
| On-line Retail | ||
| Other Distribution Channels | ||
| Country | China | |
| Japan | ||
| India | ||
| Australia | ||
| Indonesia | ||
| Malaysia | ||
| South Korea | ||
| New Zealand | ||
| Thailand | ||
| Singapore | ||
| Rest of Asia-Pacific | ||
Need A Different Region or Segment?
Customize Now
Market Definition
- Butter - Butter is a yellow-to-white solid emulsion of fat globules, water, and inorganic salts produced by churning the cream from cows’ milk
- Dairy - Dairy product include milk and any of the foods made from milk, including butter, cheese, ice cream, yogurt, and condensed and dried milk.
- Frozen Desserts - Frozen dairy dessert means and includes products containing milk or cream and other ingredients which are frozen or semi-frozen prior to consumption, such as ice milk or sherbet, including frozen dairy desserts for special dietary purposes, and sorbet
- Sour Milk Drinks - Sour milk is thick, curdled milk, with a sour taste, obtained from the fermentation of milk. Sour milk drinks such as kefir, laban, buttermilk have been considered in the study
| Keyword | Definition |
|---|---|
| Cultured Butter | Cultured butter is prepared by having the raw butter go through chemical processing and has been added with certain emulsifiers and foreign ingredients. |
| Uncultured Butter | This type of butter is one which has not been processed in any way |
| Natural Cheese | The type of cheese in its most natural form. It is made from natural and simple products and ingredients, including fresh and natural salts, natural colors, enzymes, and high-quality milk. |
| Processed Cheese | Processed cheese undergoes the same processes as natural cheese; however, it requires more steps and many different forms of ingredients. Making processed cheese involves melting natural cheese, emulsifying it, and adding preservatives and other artificial ingredients or colorings. |
| Single Cream | Single cream contains around 18% fat. It’s a single layer of cream that appears over boiled milk. |
| Double Cream | Double cream contains 48% fat, more than double the amount of fat of single cream. It’s heavier and thicker than single cream |
| Whipping Cream | This has a much higher fat percentage than single cream (36%). Used to top cakes, pies, and puddings and as a thickener for sauces, soups, and fillings. |
| Frozen Desserts | Desserts that are meant to be eaten in frozen condition. E.g., sherbets, sorbets, frozen yogurts |
| UHT Milk (Ultra-high temperature milk) | Milk heated at a very high temperature. Ultra-high-temperature processing (UHT) of milk involves heating for 1–8 sec at 135–154°C. which kills the spore-forming pathogenic microorganism, resulting in a product with a shelf-life of several months. |
| Non-dairy butter/Plant-based butter | Butter made from plant-derived oil such as coconut, palm, etc. |
| Non-dairy Yogurt | Yogurt made from typically made from nuts, like almonds, cashews, coconuts, and even other foods like soybeans, plantains, oats, and peas |
| On-trade | It refers to restaurants, QSRs, and bars. |
| Off-trade | It refers to supermarkets, hypermarkets, on-line channels, etc. |
| Neufchatel cheese | One of the oldest kinds of cheese in France. It is a soft, slightly crumbly, mold-ripened, bloomy-rind cheese made in the Neufchâtel-en-Bray region of Normandy. |
| Flexitarian | It refers to a consumer preferring a semi-vegetarian diet, that is centered on plant foods with limited or occasional inclusion of meat. |
| Lactose Intolerance | Lactose intolerance is a reaction in digestive system to lactose, the sugar in milk. It causes uncomfortable symptoms in response to the consumption of dairy products. |
| Cream Cheese | Cream cheese is a soft and creamy fresh cheese with a tangy taste made from milk and cream. |
| Sorbets | Sorbet is a frozen dessert made using ice combined with fruit juice, fruit purée, or other ingredients, such as wine, liqueur, or honey. |
| Sherbet | Sherbet is a sweetened frozen dessert made with fruit and some sort of dairy product such as milk or cream. |
| Shelf stable | Foods that can be safely stored at room temperature, or "on the shelf," for at least one year and do not have to be cooked or refrigerated to eat safely. |
| DSD | Direct Store Delivery is the process in supply chain management wherein the product is delivered from manufacturing plant directly to the retailer. |
| OU Kosher | Orthodox Union Kosher is a kosher certification agency based in New York City. |
| Gelato | Gelato is a frozen creamy dessert made with milk, heavy cream and sugar. |
| Grass-fed Cows | Grass-fed cows are allowed to graze in pastures, where they eat a variety of grasses and clover. |
Need More Details on Market Definition?
Ask a Question
Research Methodology
Mordor Intelligence follows a four-step methodology in all our reports.
- Step-1: Identify Key Variables: In order to build a robust forecasting methodology, the variables and factors identified in Step 1 are tested against available historical market numbers. Through an iterative process, the variables required for market forecast are set, and the model is built on the basis of these variables.
- Step-2: Build a Market Model: Market-size estimations for the forecast years are in nominal terms. Inflation is not a part of the pricing, and the average selling price (ASP) is kept constant throughout the forecast period for each country.
- Step-3: Validate and Finalize: In this important step, all market numbers, variables, and analyst calls are validated through an extensive network of primary research experts from the market studied. The respondents are selected across levels and functions to generate a holistic picture of the market studied.
- Step-4: Research Outputs: Syndicated Reports, Custom Consulting Assignments, Databases & Subscription Platforms

Get More Details On Research Methodology
Download PDF


