
Market Overview
| Study Period | 2020 - 2031 |
|---|---|
| Forecast Data Period | 2026 - 2031 |
| Base Year Market Size (2025) | USD 16.09 Billion |
| Market Size (2026) | USD 17.04 Billion |
| Market Size (2031) | USD 22.68 Billion |
| Growth Rate (2026 - 2031) | 5.89% CAGR |
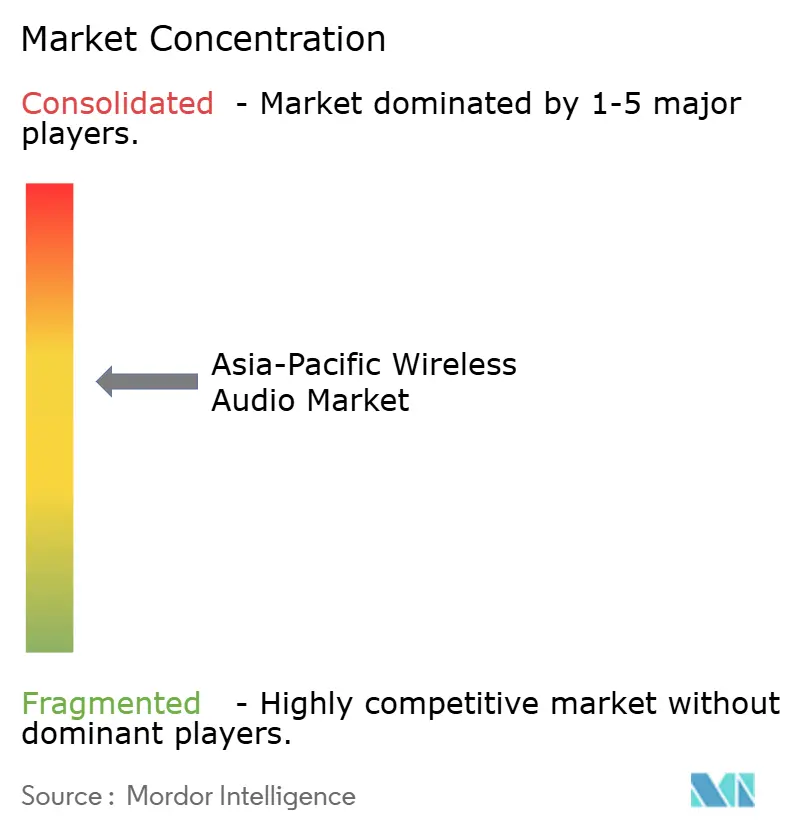
| Market Concentration | Medium |
Major Players *Disclaimer: Major Players sorted in no particular order Image © Mordor Intelligence. Reuse requires attribution under CC BY 4.0. | |
Asia-Pacific Wireless Audio Market Analysis by Mordor Intelligence
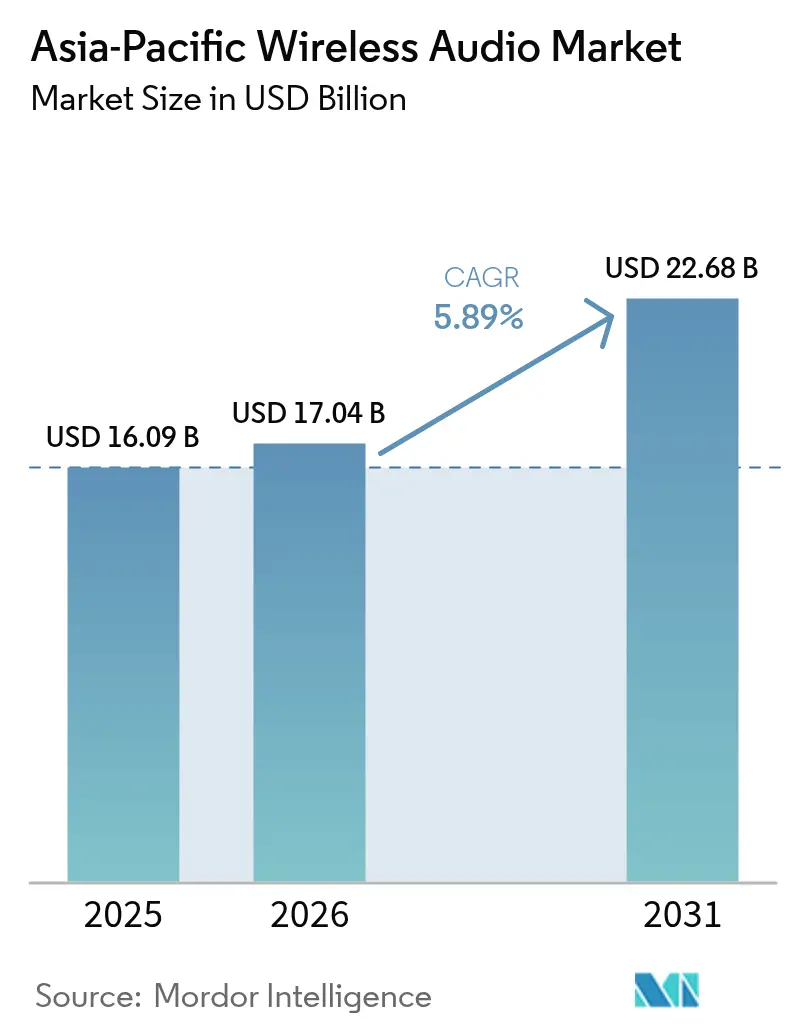
The Asia-Pacific wireless audio market size is expected to grow from USD 16.09 billion in 2025 to USD 17.04 billion in 2026 and is forecast to reach USD 22.68 billion by 2031 at 5.89% CAGR over 2026-2031. This growth reflects a decisive shift from stationary speakers to personal devices, particularly true wireless stereo (TWS) earbuds, which captured 46% of device-type revenue in 2024 and are expected to expand at an annual rate of 13.80%. Rapid localization of audio system-on-chip manufacturing in India and Vietnam, the region’s frontrunner in the adoption of Bluetooth LE Audio, and the integration of wireless audio into automotive infotainment systems uplift overall demand. Simultaneously, e-commerce penetration, rising streaming subscriptions, and feature escalation, such as spatial audio and active noise cancellation, are encouraging premium upgrades. Competitive dynamics remain vigorous, as budget brands leverage low landed costs while established global names invest in ecosystem lock-in and multi-device connectivity. Affordability, spectrum congestion in megacities, and tightening e-waste rules temper the otherwise positive outlook.
Key Report Takeaways
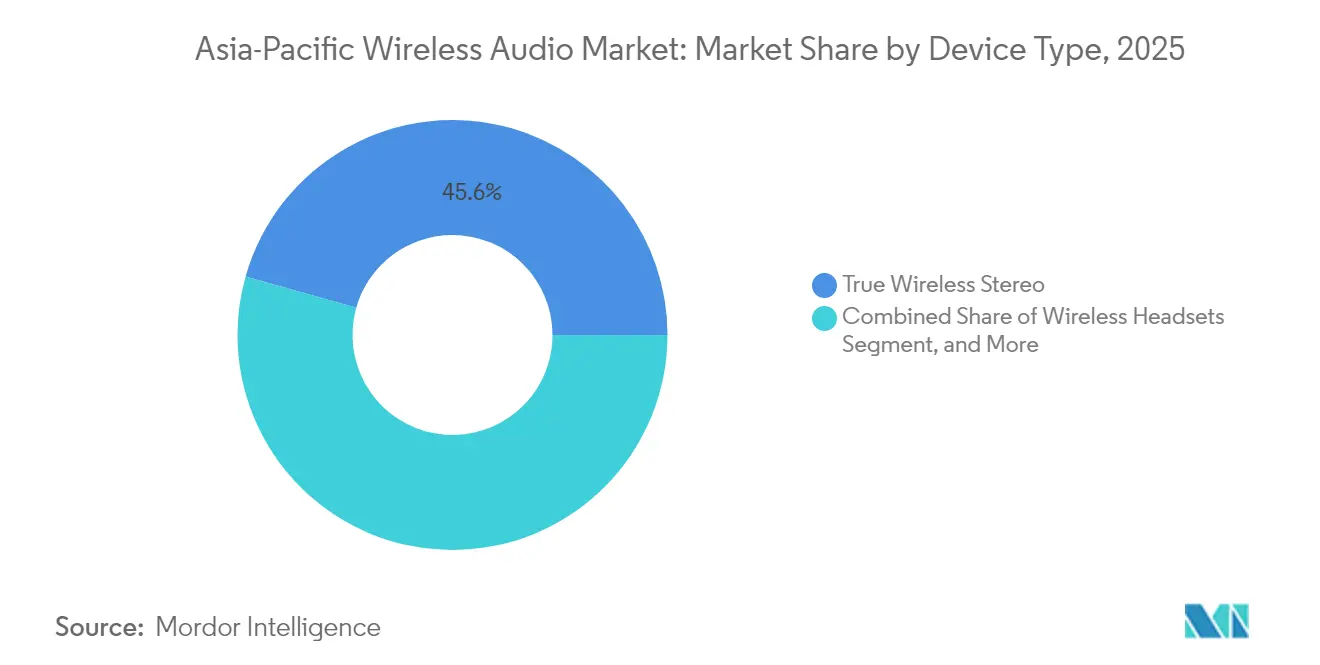
- By device type, True Wireless Stereo earbuds accounted for 45.62% of the revenue in 2025 and are projected to advance at a 7.42% CAGR through 2031.
- By connectivity technology, Bluetooth-only products accounted for 68.55% of 2025 revenue, while ultra-wideband is projected to expand at a 8.87% CAGR to 2031.
- By application, residential and consumer use retained 73.10% of the revenue in 2025, while gaming and e-sports are on track to post an 7.68% CAGR through 2031.
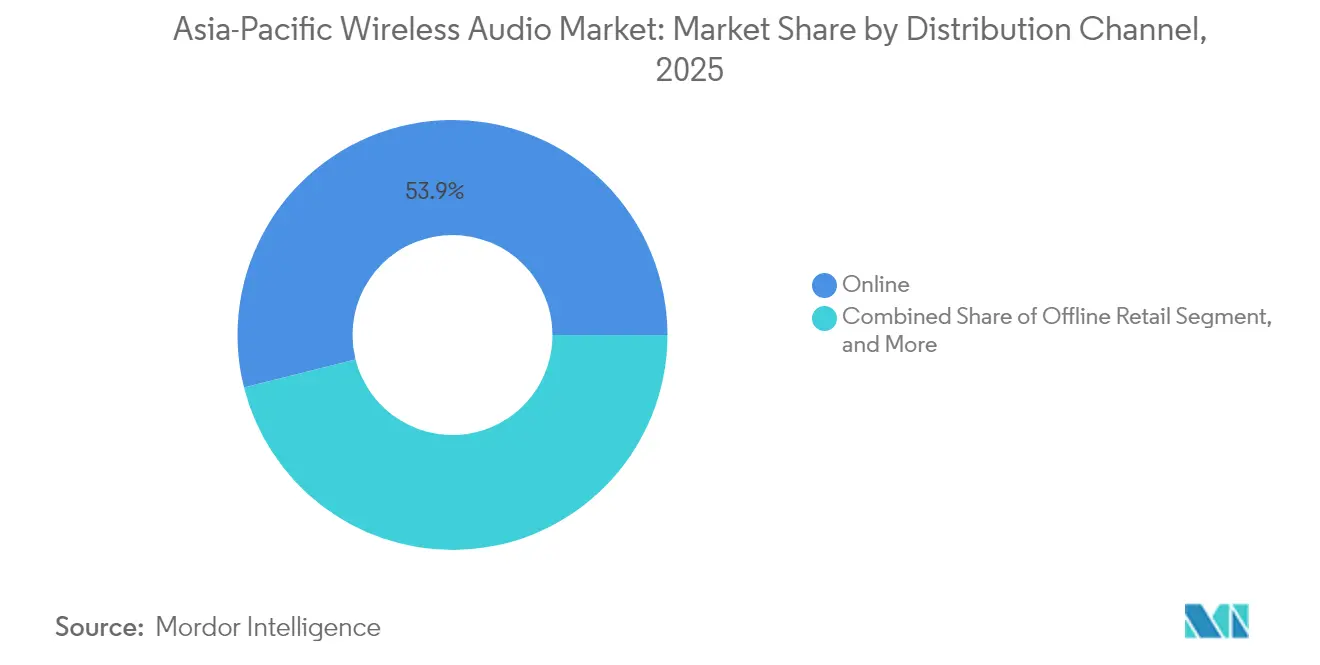
- By distribution, online channels secured a 53.92% revenue share in 2025 and are growing at an 8.05% CAGR through 2031.
- By price band, the budget tier represented 40.85% revenue in 2025, while the premium tier is on track to post an 8.52% CAGR through 2031.
Note: Market size and forecast figures in this report are generated using Mordor Intelligence’s proprietary estimation framework, updated with the latest available data and insights as of 2026.
Asia-Pacific Wireless Audio Market Trends and Insights
Drivers Impact Analysis*
| Driver | (~) % Impact on CAGR Forecast | Geographic Relevance | Impact Timeline |
|---|---|---|---|
| Rising adoption of true wireless stereo earbuds | +2.8% | India, China, Southeast Asia | Short term (≤ 2 years) |
| Increasing smart speaker penetration in urban households | +0.4% | China, Japan, South Korea | Medium term (2-4 years) |
| Advancements in Bluetooth LE Audio and LC3 codec | +1.5% | Japan, South Korea, China | Medium term (2-4 years) |
| Growth of online music streaming services | +1.2% | India, Southeast Asia, China | Short term (≤ 2 years) |
| Bundled audio ecosystems with IoT devices | +0.7% | China, South Korea, urban India | Medium term (2-4 years) |
| Localization of audio SoC manufacturing | +0.9% | India, Vietnam, Southeast Asia | Long term (≥ 4 years) |
| Source: Mordor Intelligence | |||
Rising Adoption of True Wireless Stereo Earbuds
TWS earbuds are redefining personal listening across the region, with India recording 4% shipment growth in Q1 2025 despite wider device softness. Asia-Pacific vendors, led by Xiaomi, Realme, and Oppo, are driving the development of hybrid active noise cancellation that exceeds 50 decibels, spatial audio, and AI-enhanced call clarity. Budget models under USD 25 captured fast-moving volume, while premium models above USD 59 expanded by 1.4 times year-over-year, illustrating a bifurcated yet inclusive price ladder. Physical retail remains essential for first-time buyers seeking to try on and purchase fit and sound products, even as e-commerce accounts for the majority of sales value. The cadence of feature rollouts shortens product lifecycles and raises R&D requirements, compelling brands to innovate or face rapid commoditization.
Advancements in Bluetooth LE Audio and LC3 Codec
Bluetooth LE Audio introduces lower power draw, higher fidelity at reduced bit rates, and multi-stream audio that supports Auracast broadcasting to unlimited receivers. The Bluetooth Special Interest Group anticipates 3 billion LE Audio-equipped devices will ship by 2028, with Japan alone expected to deploy 1.3 billion units.[1]Bluetooth Special Interest Group, “Bluetooth Market Update 2024,” bluetooth.com Flagship smartphones and earbuds from Samsung, Sony, LG, and Xiaomi already support the standard, and over 100 commercially available Auracast devices are cataloged in the SIG registry. Reduced latency benefits gaming and automotive infotainment, while Auracast unlocks silent gyms, multilingual museum tours, and gate announcements, widening addressable use cases for the Asia-Pacific wireless audio market.
Growth of Online Music Streaming Services
Streaming revenue in Asia increased at a faster rate than any other region in 2024, driven by wider smartphone adoption, cost-effective data plans, and extensive local catalogs.[2]International Federation of the Phonographic Industry, “Global Music Report 2024,” ifpi.org Rising subscriptions motivate consumers to invest in higher-fidelity playback, evidenced by the spread of LDAC and LHDC codecs into mid-tier TWS devices. Streaming also promotes multi-point connectivity, allowing listeners to switch seamlessly between devices, such as phone to laptop or in-car systems, without interruption. In China, over 80% of new vehicle models now ship with wireless CarPlay, reinforcing the connection between streaming habits and demand for embedded wireless audio.
Bundled audio ecosystems with IoT devices
Urban centers such as Shanghai, Mumbai, Tokyo, and Seoul are experiencing overcrowding on 2.4 GHz and 5 GHz frequencies. Packet collisions from overlapping Bluetooth and Wi-Fi networks cause dropouts and audible artifacts. Automotive cabins, loaded with concurrent Bluetooth hands-free, wireless CarPlay, and rear-seat video, operate well below theoretical throughput. Dual-band Wi-Fi chipsets, adaptive frequency hopping, and a gradual shift to less congested ultra-wideband offer partial relief, yet the finite unlicensed spectrum remains a technical ceiling for the Asia-Pacific wireless audio market share in densely populated corridors.[3]Electronic Specifier, “Next-gen vehicle connectivity,” electronicspecifier.com
Restraints Impact Analysis*
| Restraint | (~) % Impact on CAGR Forecast | Geographic Relevance | Impact Timeline |
|---|---|---|---|
| Spectrum congestion in dense metro areas | -0.6% | China, India, Japan, South Korea | Short term (≤ 2 years) |
| Price sensitivity in emerging markets | -1.1% | India, Southeast Asia, lower-tier Chinese cities | Short term (≤ 2 years) |
| Stricter e-waste recycling regulations | -0.5% | ASEAN, India, China | Medium term (2-4 years) |
| Health concerns over prolonged RF exposure | -0.3% | Japan, South Korea, global | Long term (≥ 4 years) |
| Source: Mordor Intelligence | |||
Spectrum Congestion in Dense Metro Areas
Rapid device proliferation in Shanghai, Mumbai, Tokyo, and Seoul is crowding the 2.4 GHz and 5 GHz bands that Bluetooth and Wi-Fi share. Packet collisions and interference reduce effective throughput, resulting in audio dropouts that compromise the user experience during calls, gaming, and in-car streaming. Automotive cabins illustrate the challenge: simultaneous Bluetooth hands-free, wireless CarPlay, and rear-seat video can slash practical bandwidth to under half of theoretical capacity. Hardware makers are adding adaptive frequency hopping and dual-band Wi-Fi radios, but these fixes raise bill-of-materials costs and lengthen design cycles. Until more spectrum or wider adoption of ultra-wideband materializes, congestion will cap audio-device density in the region’s largest cities.
Price Sensitivity in Emerging Markets
Affordability remains the gatekeeper to mass adoption in India, Indonesia, Vietnam, and the Philippines, where sub-USD 50 models comprised 41% of 2024 unit sales. India’s average selling price for true wireless stereo devices declined 18% in 2024 to approximately USD 17, reflecting intense competition among local brands and Shenzhen-sourced white-label suppliers. Although premium shipments above USD 150 are expanding at a 14.20% CAGR, they still represent a small portion of the overall volume, indicating that most buyers trade advanced features for lower ticket prices. Budget dominance squeezes vendor margins, leaving limited headroom for R&D spending on innovations such as spatial audio or high-resolution codecs. Currency fluctuations and import duties further pressure pricing strategies, so even small cost increases from upgraded chips or recycled-material housings can dampen demand. As a result, the region’s wireless audio suppliers must balance feature rollouts against razor-thin consumer price ceilings to maintain competitiveness.
*Our forecasts treat driver/restraint impacts as directional, not additive. The impact forecasts reflect baseline growth, mix effects, and variable interactions.
Segment Analysis
By Device Type: True Wireless Stereo Leads Personal Audio Transformation
The Asia-Pacific wireless audio market size for TWS reached 45.62% of the revenue in 2025 and is slated to expand at a 7.42% CAGR through 2031. Budget TWS shipments rose 52% on the back of sub-USD 25 pricing, yet premium TWS boasting spatial audio and lossless transmission posted the fastest value growth. Wireless speakers accounted for approximately one-quarter of revenue, although China’s smart speaker shipments declined 25.6% to 15.7 million units, indicating a decline in traction for stationary devices. Over-ear wireless headsets and neckband formats remain viable among office workers and gamers who seek extended battery life; however, their mid-single-digit growth underscores a consumer migration to fully cord-free earbuds. Continuous feature trickle-down encompassing noise cancellation, AI processing, and high-resolution codecs supports market expansion while heightening differentiation challenges.
Pioneering launches emphasize the escalating specification race. Regional manufacturers showcased Wi-Fi streaming earbuds capable of lossless playback, surpassing the limitations of Bluetooth codecs, while portable speakers entered the niche wearables market, including audio-enabled sunglasses with IP54 ratings and open-ear acoustics. This evolution reinforces a user preference for mobility, personalization, and cross-device continuity, core demand pillars that will continue to drive the Asia-Pacific wireless audio market on an upward trajectory.


By Connectivity Technology: Ultra-Wideband Gains Ground
Bluetooth-only devices delivered 68.55% of 2025 revenue, reaffirming the protocol’s ubiquity. Yet, ultra-wideband is racing forward at a 8.87% CAGR, propelled by sub-10 nanosecond ranging accuracy, which is vital for automotive digital keys and head-tracked spatial audio in competitive gaming. Bluetooth and Wi-Fi combo chipsets are becoming increasingly popular in premium earbuds, enabling seamless handoffs between local lossless streaming and traditional Bluetooth listening. Wi-Fi or AirPlay speakers, which account for roughly 8% of revenue, cater to multi-room home audio enthusiasts who demand higher bitrates. Near-field communication mostly eases pairing but is evolving into an authentication tool for premium content. As LE Audio proliferates, Bluetooth’s continued dominance is assured; however, its newer low-latency, multi-stream profile will increasingly blur the lines with ultra-wideband for high-precision use cases.
By Application: Gaming and E-Sports Outperform
Residential listening still accounted for 73.10% of 2025 revenue, while gaming and e-sports are pacing ahead at a 7.68% CAGR. China and South Korea anchor professional gaming ecosystems that demand sub-100 millisecond lag headsets. Product designs now incorporate hybrid noise cancellation to reduce external distractions and 2.4 GHz dongles that bypass Bluetooth bottlenecks. Automotive infotainment generated approximately 6% of the revenue but is poised to ride a steeper slope as in-vehicle systems adopt LE Audio for simultaneous driver and passenger streams. Meanwhile, fitness and sports segments continue to favor open-ear or bone-conduction formats that allow for environmental awareness. Commercial venues remain nascent adopters, yet Auracast’s unlimited broadcast potential primes airports, gyms, and museums for future uptake.
By Distribution Channel: Online Dominates, Offline Proves Sticky
E-commerce platforms captured 53.92% of the revenue in 2025 and are expanding at a 8.05% CAGR, leveraging dynamic pricing and a broad range of SKUs. Offline retail, however, remains influential in India, where shoppers prefer tactile trials; the country’s offline personal audio value surged 32% over 12 months, despite online sales accounting for roughly three-quarters of overall sales. Brand-run experience stores in tier-1 and tier-2 cities blur channel boundaries, letting customers audition products before selecting their preferred fulfillment route. Direct corporate procurement remains niche but stable, sustained by the adoption of hybrid work, which drives enterprise demand for conferencing headsets with multi-point connectivity.
By Price Band: Premium Climbs Despite Budget Prevalence
Devices under USD 50 held a 40.85% share in 2025, highlighting value sensitivity across emerging economies. Yet, the premium category above USD 150 is expanding at a 8.52% CAGR, as users pay for adaptive noise cancellation, lossless codecs, and ecosystem integration. The mid-range USD 50–USD 150 tier maintains healthy traction, although feature trickle-down from premium into budget lines is compressing the window for mid-segment differentiation. The localization of audio SoC production in India, which increased domestic output to 62% in 2023, is lowering entry-level costs and preserving vendor margins, even as average selling prices continue to drift downward.
Geography Analysis
China remains the largest single geography but reveals contrasting signals. Smart speaker unit shipments declined 25.6% to 15.7 million in 2024, and revenue decreased 29.4% to CNY 4.2 billion (USD 0.6 billion) as consumer preference shifted toward TWS and portable speakers. By contrast, automotive wireless audio is thriving, with in-vehicle infotainment penetration reaching 79.1% across 16.64 million vehicles. Bluetooth LE Audio integration into smart cabins is accelerating as electric vehicle production climbs. China’s top three smart speaker vendors controlled 96.2% of the segment, underscoring consolidation and limited opportunities for competition.
India posted 4% year-over-year growth in TWS shipments for Q1 2025, buoyed by domestic brands that outpaced the incumbent market leader’s share. Offline retail experienced a 42% increase in personal audio volume, validating the importance of in-person trial even in a digitally oriented market. Government incentives and foreign investment have propelled domestic manufacturing, increasing the local production share from 30% in 2022 to 62% in 2023, which in turn reduces landed costs and enhances price competitiveness. Premium shipments remain small at 4% but are scaling faster than volume averages, indicating a rising appetite for high-spec models among urban consumers.
Japan and South Korea are early movers in Bluetooth LE Audio rollouts, with Japan projected to deploy 1.3 billion LE Audio units by 2028. Domestic champions Sony, Samsung, and LG are embedding Auracast transmit and receive functions across smartphones, televisions, and earbuds, setting new baselines for seamless multi-device listening. South Korea’s automotive giants, in collaboration with local consumer electronics firms, are adopting ultra-wideband technology for vehicle access and in-cabin pairing, reinforcing the synergy between consumer and automotive audio.
Southeast Asia continues to drive regional momentum through sustained smartphone adoption and e-commerce growth. Product debuts in Vietnam, Malaysia, and Indonesia showcase party speakers with patented sound enhancements, portable speakers with retractable handles, and audio sunglasses. Fragmented retail structures favor alliances with local chains, while rising mid-tier purchasing power signals incremental shifts from purely budget devices toward models featuring noise cancellation and extended battery life.
Regulatory Landscape
Wireless audio devices in Asia-Pacific face country-specific compliance requirements spanning radio approvals, EMC, and product stewardship, which affects SKU design and launch sequencing. In Vietnam, wireless audio equipment operating from 25 MHz to 2,000 MHz is assessed against QCVN 130:2022/BTTTT for electromagnetic compatibility (EMC), adding test and documentation requirements for brands selling headphones, speakers, and related transmit/receive products.
Spectrum and terminal-equipment rules are also tightening or changing in key hubs. Thailand updated its technical standard for wireless microphones and adjacent audio systems through NBTC TS 1006-2568 (2025), replacing NBTC TS 1006-2560 and specifying approval needs for bands including 694-703 MHz, 748-758 MHz, and 803-806 MHz; the NBTC also opened consultation on a 2026-2028 Frequency Management Master Plan starting 18 May 2026 (comments through 6 July 2026), signaling ongoing spectrum planning that can affect professional and event-audio device configurations. In Singapore, IMDA revised its Equipment Registration framework in March 2026 (EQR Issue 1) and continues to maintain technical standards for connected terminal equipment (IMDA TS CMT Issue 1 Rev 4, Feb 2026), reinforcing the need for market-specific firmware and compliance files even for globally launched consumer audio products.
Competitive Landscape
The Asia-Pacific wireless audio market features a moderately concentrated vendor pool. Apple, Samsung, Sony, and Harman maintain high-profile positions through vertical ecosystem integration and strategic acquisitions. Samsung’s agreement to purchase Sound United from Masimo, valued at USD 350 million, aims to extend Harman’s premium audio reach across consumer and automotive segments. Chinese and Indian challengers, such as Xiaomi, Realme, boAt, and Oppo, control outsized volumes in the sub-USD 50 tier by leveraging local manufacturing, fast refresh cycles, and aggressive online promotions. Canalys data shows that Apple led global personal audio shipments with 18 million units in Q2 2024, with Samsung, boAt, Xiaomi, and Sony rounding out the top five.
Technology differentiators remain central. Over 100 Auracast-capable products are already commercial. Ultra-wideband integration into digital car keys and premium gaming headsets is emerging as a new battleground, alongside Wi-Fi-enabled earbuds that promise lossless playback. Regulatory compliance with ICNIRP 2020 exposure limits and new ASEAN e-waste directives is now a minimum standard, but no cancer-specific restrictions have materialized after the World Health Organization's reviews found no reliable evidence linking prolonged RF exposure to adverse health outcomes.
Asia-Pacific Wireless Audio Industry Leaders
Apple Inc.
Samsung Electronics Co. Ltd
Harman International Industries Incorporated
Sony Group Corporation
Xiaomi Corporation
- *Disclaimer: Major Players sorted in no particular order

Market Opportunities and Future Outlook
Bluetooth LE Audio rollouts and Auracast create a concrete whitespace beyond personal listening, particularly for broadcast-style, multi-receiver audio in public and semi-public venues such as airports, museums, and gyms. In these settings, venue operators can standardize on a widely supported protocol rather than using proprietary RF headsets.
This opportunity is reinforced by ecosystem readiness cited in the report context, including flagship-device support across brands and the presence of over 100 commercially available Auracast-capable products in the Bluetooth SIG registry, which makes pilot deployments more practical for facility owners and integrators. On the supply side, localization programs and manufacturing moves in Asia-Pacific also support lower-cost, faster-refresh product roadmaps across budget and mid-range tiers, while still allowing feature upgrades such as hybrid ANC, spatial audio, and multi-device connectivity. The report context points to a material increase in local production share in India (rising to 62% in 2023) and ongoing localization of audio SoC manufacturing in India and Vietnam, which ties into the region’s high online-channel share (53.92% of 2025 revenue) where rapid SKU iteration and competitive pricing are decisive. At the same time, tightening equipment registration and spectrum governance in markets such as Singapore and Thailand increases the demand for compliance-ready regional variants, creating an execution gap that favors vendors with established certification workflows and flexible firmware and hardware platforms across Bluetooth, Bluetooth plus Wi-Fi combo, and emerging ultra-wideband use cases.
Recent Industry Developments
- July 2026: Samsung introduced the Music Studio Series Wi-Fi speakers (LS50H and LS70H) in India. The launch extends Samsung's wireless-audio footprint beyond earbuds into networked home audio, supporting ecosystem bundling and multi-device playback use cases.
- May 2026: Xiaomi launched Xiaomi Buds 6 globally with aptX Lossless support. The product strengthens higher-fidelity positioning for mass-market channels, increasing specification pressure across competing TWS lines in Asia-Pacific.
- June 2024: Harman announced a major investment of about THB 2.8 billion for a new manufacturing facility in Chonburi, Thailand. The project expands regional supply capability for consumer and automotive audio programs and reduces dependency on longer cross-border supply routes for selected SKUs.


Research Methodology Framework and Report Scope
Market Definition and Coverage
This market covers spending on wireless audio devices sold across Asia Pacific, where sound is delivered without a physical cable to the source device, mostly using Bluetooth or Wi-Fi.
Scope exclusions: Wired-only headphones and speakers, microphones, and software-only audio services are excluded from this sizing.
Segmentation Overview
- By Device Type
- Wireless Speakers
- Bluetooth-Only
- Smart Speakers
- Wi-Fi Speakers
- Wireless Earphones
- Wireless Headsets
- True Wireless Stereo
- Wireless Speakers
- By Connectivity Technology
- Bluetooth Only
- Bluetooth plus Wi-Fi Combo
- Wi-Fi/AirPlay
- Near Field Communication
- Ultra-Wideband
- By Application
- Residential/Consumer
- Commercial (Retail, Hospitality)
- Automotive Infotainment
- Fitness and Sports
- Gaming and E-Sports
- By Distribution Channel
- Online
- Offline Retail
- Direct Corporate Sales
- By Price Band
- Budget (Less than USD 50)
- Mid-Range (USD 50-150)
- Premium (Above USD 150)
- By Country
- China
- South Korea
- Japan
- India
- Southeast Asia
Data Sources, Market Sizing, and Validation
Desk Research
Desk research is used to set the market frame and to anchor country and device adoption assumptions before we build the model. We referred to public sources such as ITU indicators for connectivity readiness, World Bank macro data for consumer spend context, UN Comtrade trade flows for relevant product groups, and national statistics portals in key economies for retail and electronics indicators.
We also reviewed manufacturer annual reports, earnings decks, and major distributor and retailer disclosures to track product-mix shifts, channel intensity, and the direction of pricing across earbuds, headsets, earphones, and speakers. Where public disclosures were thin, we used paid subscriptions focused on company financials, news and financials, patent databases, and shipment-level import-export data to cross-check timelines and plausible ranges. The sources listed here are illustrative, and many other public and paid references were also used to collect, validate, and clarify inputs.
Primary Interviews and Surveys
Primary work was used to pressure-test what desk sources cannot fully explain, especially country-level product mix, channel pricing, and the pace of feature adoption. We spoke with participants across the value chain, including brands, distributors, large retailers, and component ecosystem contacts, and coverage was balanced across key APAC demand centers and manufacturing hubs. Inputs from these discussions helped refine adoption curves, typical discounting behavior, and the split between consumer use and commercial demand (such as offices and hospitality).
Distribution of primary research fieldwork respondents
| Company type | Respondent position | Region |
|---|---|---|
| Top tier: 32% | CXOs: 16% | |
| Mid tier: 50% | Functional/Unit leaders: 25% | |
| Smaller Players: 18% | Managers: 59% |
Market-Sizing & Forecasting
Sizing is first built using a top-down demand pool approach, where consumer electronics spend and device penetration signals are used to reconstruct likely wireless audio purchases by country and then rolled up to the region. To keep totals realistic, we corroborate with selective bottom-up approximations, such as sampled average selling price (ASP) by device type multiplied by implied unit volumes from channel checks, and we adjust when gaps appear.
Key inputs that shape the model include smartphone installed base and replacement behavior, Bluetooth feature migration (including noise canceling and multipoint), online versus offline channel share, promotional intensity around major sales events, and ASP progression by price band (budget, mid-range, premium). Since country data quality varies, missing points are handled using proxy indicators (like import trends and retail electronics indices), then normalized through interview feedback. Forecasts lean on scenario analysis with a light multivariate view of inflation, real income, and device upgrade cycles, and then are tuned using expert consensus on the next two to three years of pricing and mix changes.
Data Validation & Update Cycle
Outputs are checked in several steps so a single assumption does not drive the result. We compare modeled totals against independent signals such as trade flows, reported category revenue ranges in filings, and observed ASP ranges from channel conversations, and we investigate outliers at the country and device level.
Before sign-off, the model and narrative go through an internal analyst review, where logic checks are repeated and any large variance triggers a follow-up call or a re-check of the source trail. Reports are refreshed annually, and interim updates are done when material events occur that could move demand or pricing materially. Right before delivery, we complete a final pass so clients receive the latest updated view.
Mordor Intelligence's Asia Pacific Wireless Audio Market Size Compared With Other Published Estimates
Published market sizes for wireless audio in Asia Pacific often do not match because researchers do not count the same products, the same channels, or even the same countries within the region. Differences also come from how prices are treated, since some models assume list prices while others attempt to reflect real selling prices after promotions.
The spread typically gets wider when one estimate focuses only on earbuds or only on consumer demand, while another includes adjacent device categories, commercial uses, and alternative connectivity types like Wi-Fi audio. Timing matters too, since currency conversion points and refresh cadence can shift the stated value even when the same real-world demand is being described.
Benchmark comparison
| Source | Market Size | Gaps in Research Methodology |
|---|---|---|
| Mordor Intelligence | USD 16.09 B (2025) | |
| Industry Publisher A | USD 12.18 B (2025) | This figure appears to follow a narrower device basket and uses a longer-range growth path that can overstate early-year adoption, with less explicit visibility on country roll-ups and price-band treatment. |
| Trade Journal B | USD 23.20 B (2024) | This number is closer to an earphones and headphones view and may blend wired and wireless revenue and include broader accessories, which inflates totals when compared with device-only wireless definitions. |
The table points to product scope and pricing treatment as the main drivers of variance. By keeping the count tied to wireless speakers, wireless earphones, wireless headsets, and TWS across APAC and pressure-testing ASPs through channel inputs, the spread is reduced in a repeatable way, a modeling choice applied by Mordor Intelligence.


Key Questions Answered in the Report
What is the current value of the Asia Pacific wireless audio market?
The Asia-Pacific wireless audio market is valued at USD 17.04 billion in 2026 and is poised to reach USD 22.68 billion by 2031.
Which product category is growing fastest?
True wireless stereo earbuds are expanding at a 7.42% CAGR, the quickest among all device types.
How important is online retail to regional sales?
E-commerce holds 53.92% of 2025 revenue and is set to grow at 8.05% CAGR, though offline remains critical in India for experiential purchases.
Why is Bluetooth LE Audio significant?
It lowers power use, improves fidelity, and supports Auracast broadcast, enabling many new public and automotive use cases.
What challenges could slow market growth?
Spectrum congestion in dense metros, high price sensitivity in emerging markets, and stricter e-waste regulations together subtract roughly 2.2 percentage points from forecast CAGR.
Which geography is the largest contributor?
China remains the largest market, driven by high TWS demand and automotive infotainment integration, despite a shrinking smart speaker segment.
Page last updated on:






