
Market Overview
| Study Period | 2020 - 2031 |
|---|---|
| Forecast Data Period | 2026 - 2031 |
| Base Year Market Size (2025) | USD 14.18 Billion |
| Market Size (2026) | USD 17.36 Billion |
| Market Size (2031) | USD 38.57 Billion |
| Growth Rate (2026 - 2031) | 17.31 % |
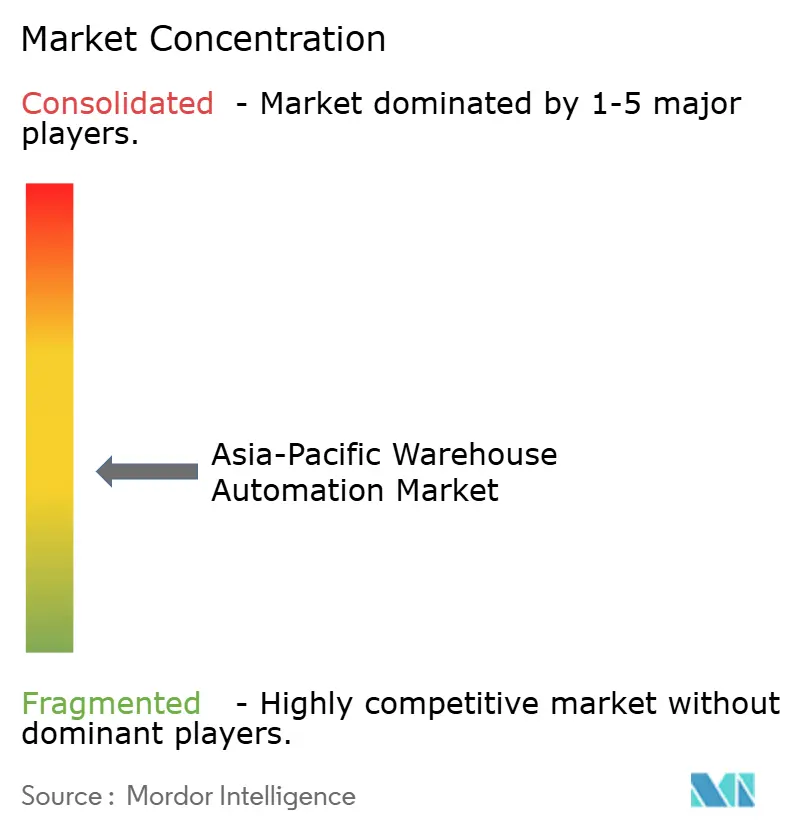
| Market Concentration | Medium |
Major Players *Disclaimer: Major Players sorted in no particular order Image © Mordor Intelligence. Reuse requires attribution under CC BY 4.0. | |
Asia-Pacific Warehouse Automation Market Analysis by Mordor Intelligence
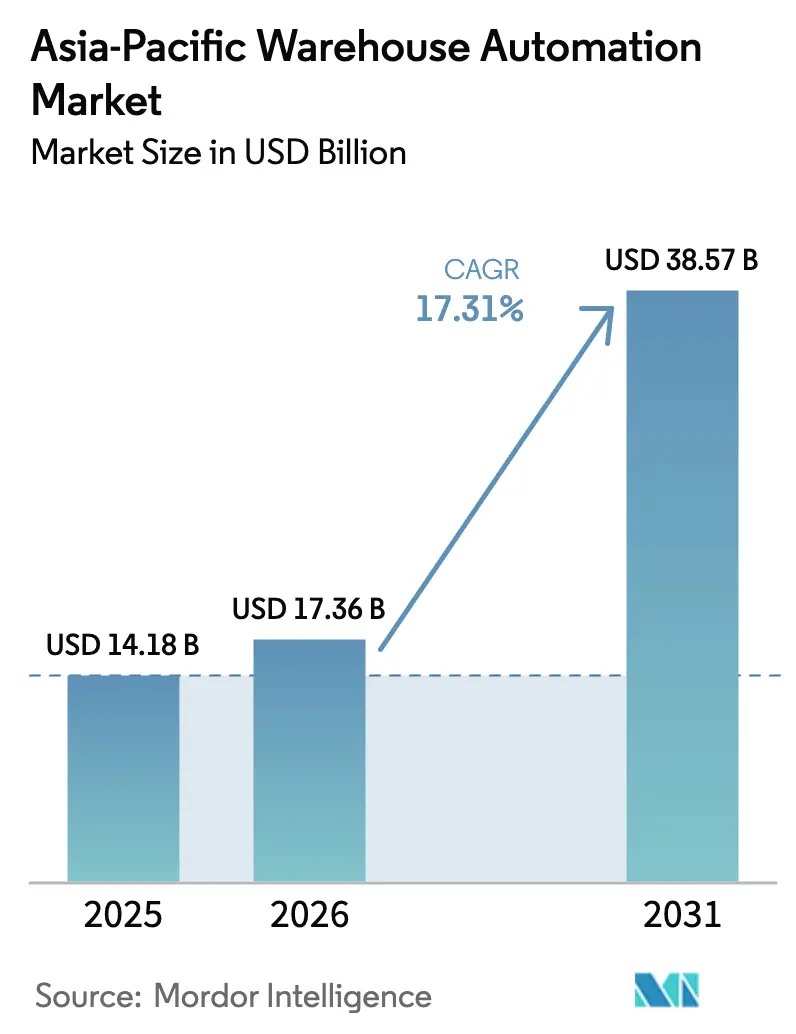
The Asia-Pacific warehouse automation market size is expected to increase from USD 14.18 billion in 2025 to USD 17.36 billion in 2026 and reach USD 38.57 billion by 2031, growing at a CAGR of 17.31% over 2026-2031. Elevated e-commerce volumes, urban delivery commitments under two hours, and widespread 5G pilots are accelerating automation investments, especially in micro-fulfillment nodes that shorten the last mile. Hardware keeps the largest revenue pool, yet services are expanding slightly faster as operators lean on integration and predictive maintenance expertise that lowers lifetime costs. Fast-growing grocery fulfillment, tightening cold-chain rules, and green mandates that link future tax incentives to energy-per-order metrics provide sizable opportunities for solution vendors. Competitive intensity is moderate, with Japanese and European incumbents emphasizing reliability while Chinese disruptors compete on price for autonomous mobile robots. Throughout 2026, investors are rewarding suppliers that package automation, software, and financing, an approach that appeals to small and mid-size 3PLs seeking rapid payback.
Key Report Takeaways
- By component, hardware led with 67.13% of the Asia-Pacific warehouse automation market share in 2025, while services are advancing at a 17.93% CAGR to 2031.
- By end user, food and beverage accounted for 23.44% of the Asia-Pacific warehouse automation market in 2025; groceries are growing at an 18.77% CAGR between 2026-2031.
- By warehouse function, distribution centers accounted for 41.38% of revenue share in 2025, but micro-fulfillment centers posted the highest 18.51% CAGR through 2031.
- By warehouse size, large facilities above 250,000 ft² accounted for 46.78% share of the Asia-Pacific warehouse automation market size in 2025, whereas small facilities below 50,000 ft² expanded at 17.92% CAGR.
- By geography, China retained 56.83% of the revenue share in 2025, while India recorded the fastest 18.56% CAGR through 2031.
Note: Market size and forecast figures in this report are generated using Mordor Intelligence’s proprietary estimation framework, updated with the latest available data and insights as of January 2026.
Market Trends and Insights
Drivers Impact Analysis of Asia-Pacific Warehouse Automation Market*
| Driver | (~) % Impact on CAGR Forecast | Geographic Relevance | Impact Timeline |
|---|---|---|---|
| Exponential Growth of the E-commerce Industry and Same-Day Delivery Expectations | +4.2% | China, India, Southeast Asia core, spill-over to Australia | Short term (≤ 2 years) |
| Government Incentives for Smart Manufacturing Under Industry 4.0 Programs | +3.1% | Japan, South Korea, China, India | Medium term (2-4 years) |
| Rising Labor Costs Amid Aging Workforce in Developed Asia-Pacific Economies | +2.8% | Japan, South Korea, Australia, Singapore | Medium term (2-4 years) |
| Surge in Dark Store and Micro-Fulfillment Adoption in Urban Centers | +2.5% | China tier-1 cities, Singapore, Tokyo, Seoul, Sydney | Short term (≤ 2 years) |
| Deployment of 5G Private Networks Enabling Ultra-Low-Latency Warehouse Control | +1.9% | South Korea, China, Japan, early pilots in India | Long term (≥ 4 years) |
| Decarbonization Mandates Driving Automation to Reduce Energy per Order | +1.7% | Japan, South Korea, Australia, Singapore | Long term (≥ 4 years) |
| Source: Mordor Intelligence | |||
Exponential Growth of the E-commerce Industry and Same-Day Delivery Expectations
Southeast Asia’s e-commerce gross merchandise value reached USD 139 billion in 2024, a 15% year-on-year jump that tightened delivery windows across Jakarta and Manila.[1] During China’s Singles’ Day 2024, platforms processed 2.9 billion parcels in 72 hours, forcing logistics providers to adopt sortation robots capable of handling 30,000 packages per hour. In India, 58% of online shoppers expected same-day service for electronics and apparel orders in 2024, up from 41% two years earlier, putting pressure on warehouses to automate pick-and-pack flows. Amazon India reported that goods-to-person robotics trimmed order-to-dispatch time by 40%, enabling two-hour delivery in 15 metropolitan areas. The surge in urban demand is pushing capital toward micro-fulfillment hubs within 5 kilometers of customers, where automation offsets urban real estate premiums.
Government Incentives for Smart Manufacturing Under Industry 4.0 Programs
Japan earmarked JPY 200 billion (USD 1.8 billion) in fiscal 2024 to subsidize collaborative robots and warehouse execution systems, aiming for 50% logistics automation by 2027.[2] China’s 14th Five-Year Plan mandates 70% mechanization in cold-chain warehouses by 2025, accelerating the deployment of shuttles and AS/RS systems that reduce food waste and energy per order. South Korea launched a USD 500 million Smart Logistics Innovation Fund in 2024, covering up to 40% of capital outlays for mobile robots for small and medium operators. India’s Production-Linked Incentive scheme, announced in 2024, provides tax credits equal to 6% of incremental revenue for warehouses installing automation through 2028. These fiscal levers shorten typical payback periods from five years to under three, unlocking projects that mid-tier 3PLs once deemed unaffordable.
Rising Labor Costs Amid Aging Workforce in Developed Asia-Pacific Economies
Japan’s median worker age climbed to 49 years in 2024, and a 6.4 million labor shortfall is projected by 2030, which is expected to lift logistics wages 12% year-over-year.[3] South Korea’s working-age population shrank 1.2% in 2024, prompting operators to boost base pay 9% to retain warehouse staff. Australia’s minimum wage rose 5.75% in July 2024, compressing margins for labor-intensive picking operations. Singapore capped foreign-worker ratios in logistics to 35% in 2024, accelerating the adoption of autonomous mobile robots to sustain throughput. Yamato Logistics cut its reliance on temporary staff by 60% after installing 1,000 Geek+ robots across 12 Japanese sites in 2024, lowering parcel labor costs by 18%.
Surge in Dark Stores and Micro-Fulfillment Adoption in Urban Centers
Coles operated 15 automated micro-fulfillment centers in Melbourne and Sydney by mid-2025, each processing 10,000 orders per day within two-hour windows using AutoStore grids. FairPrice Group and Ocado opened a 20,000 m² automated facility in 2024 that assembles 30,000 grocery orders weekly, serving 90% of Singapore within one hour. Alibaba’s Freshippo chain expanded to 350 dark stores by December 2024, where robotic arms reduced order assembly time from 12 minutes to four. JD.com launched 80 micro-fulfillment centers in second-tier Chinese cities during 2024, each under 5,000 ft² and stocked with 3,000 SKUs, trimming last-mile delivery cost by 25%. Vendors report that 62% of Asia-Pacific orders in 2024 came from facilities smaller than 50,000 ft², reversing the previous decade’s focus on mega-sheds.
Restraints Impact Analysis of Asia-Pacific Warehouse Automation Market*
| Restraint | (~) % Impact on CAGR Forecast | Geographic Relevance | Impact Timeline |
|---|---|---|---|
| High Capital Expenditure and Long Payback Periods | -2.3% | India, Southeast Asia, smaller operators across Asia-Pacific | Medium term (2-4 years) |
| Availability of Low-Cost Labor in Emerging Economies | -1.8% | India, Vietnam, Indonesia, Philippines | Short term (≤ 2 years) |
| Complexity of Integrating Legacy IT and OT Systems | -1.4% | Japan, South Korea, established operators in China | Medium term (2-4 years) |
| Cybersecurity Vulnerabilities in Connected Robotic Fleets | -0.9% | Global, with acute risk in Japan, Australia, Singapore | Long term (≥ 4 years) |
| Source: Mordor Intelligence | |||
High Capital Expenditure and Long Payback Periods
Installing an automated storage and retrieval system for a 100,000 ft² warehouse typically costs USD 8-15 million, with payback stretching three to five years depending on wage differentials. Autonomous mobile robots price between USD 20,000 and USD 100,000 each, and fleets of 50 units push upfront spend beyond USD 1 million, plus annual software fees near 20% of the hardware cost. Commercial loan rates in India averaged 9.5% in 2024, thereby inflating the weighted-average cost of capital and extending breakeven timelines for thin-margin operators. Robotics-as-a-service contracts at USD 2,000-4,000 per robot per month lower barriers but raise the total five-year cost 20-30%. These financing hurdles leave automation penetration below 12% in Vietnam and Indonesia, despite robust online retail growth.
Availability of Low-Cost Labor in Emerging Economies
Average monthly warehouse wages are USD 180 in India and USD 220 in Vietnam, which is one-fifth of the rates in Japan or Australia, reducing the urgency for automation. Vietnam’s logistics sector employed 1.2 million workers in 2024, and low wages stretch robotic ROI to six-plus years for basic picking tasks. Indonesia’s logistics unemployment rate was 4.8% in 2024, allowing firms to scale manual teams for peak seasons at minimal fixed costs. The Philippines supplies warehouse labor at USD 200-250 per month, undercutting annualized operating costs of a single mobile robot by roughly 40%. Flipkart automated only 18% of its Indian fulfillment footprint in 2024, limiting deployments to high-throughput electronics and grocery zones where volumes justify capex.
*Our forecasts treat driver/restraint impacts as directional, not additive. The impact forecasts reflect baseline growth, mix effects, and variable interactions.
Asia-Pacific Warehouse Automation Market Segment Analysis
By Component:
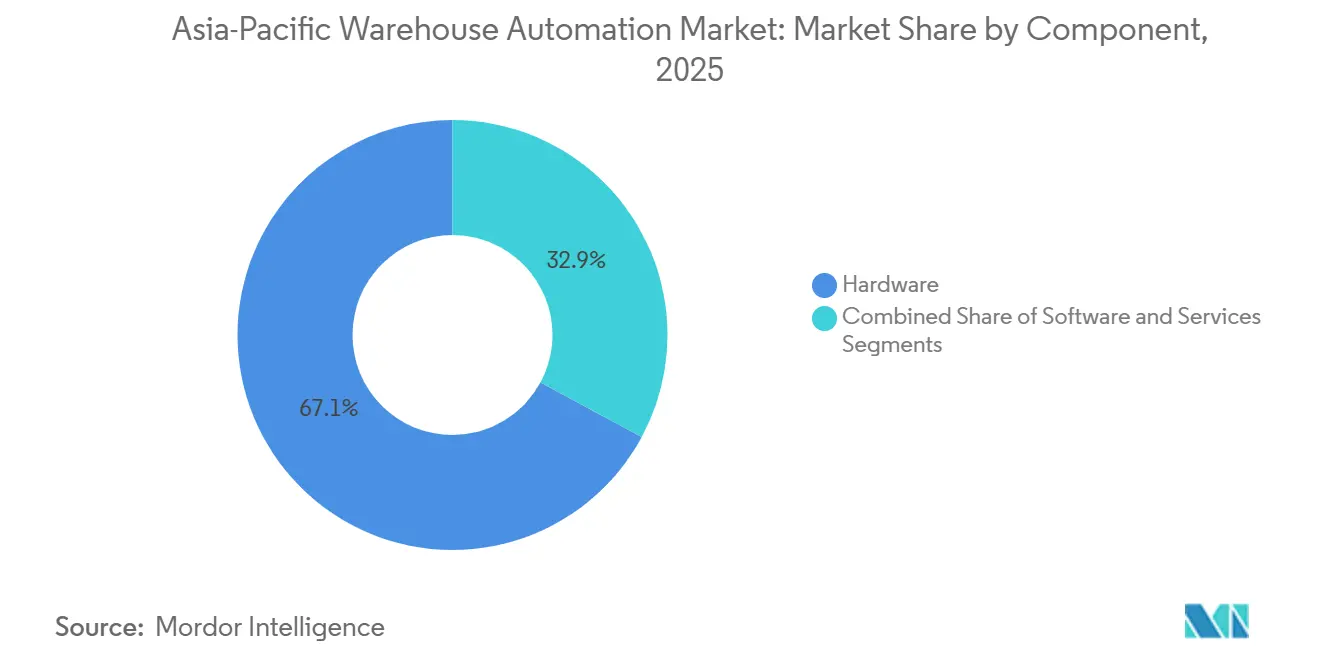
Integration-Heavy Services Gain GroundServices revenue is growing at a 17.93% CAGR, slightly outpacing hardware’s 17.31% trajectory, as operators discover that successful projects hinge on the smooth integration of legacy ERP, WMS, and OT layers. In 2025, hardware still delivered 67.13% of the Asia-Pacific warehouse automation market, largely because mobile robots, shuttle systems, and conveyors remain the backbone of throughput gains. Mobile fleets alone accounted for 28% of component turnover, buoyed by deployments such as 1,000 Geek+ units at Yamato Logistics, which trimmed processing time by 35%. Software captured 18% market share and is accelerating as real-time control and predictive maintenance mature, evidenced by a 40% jump in Blue Yonder and Manhattan Associates WMS licenses.
System integrators stand to benefit most, as 68% of operators surveyed in 2024 cited IT-OT convergence as their top hurdle. Consulting lines now bundle process redesign, safety certification, and workforce upskilling into multi-year contracts, swelling service margins. Hardware vendors respond by offering end-to-end packages, yet many mid-sized 3PLs prefer neutral advisers who can orchestrate mixed fleets. As warehouse complexity rises and the Asia-Pacific warehouse automation market expands, demand for cyber-secure integration eclipses the allure of marginal mechanical upgrades.

By End-User:
Grocery Cold-Chain Automation AcceleratesGrocery stores register the fastest 18.77% CAGR as strict temperature compliance and one-hour delivery windows intensify capital allocation toward mechanized cold storage. Food and beverage retained the largest 23.44% share of the Asia-Pacific warehouse automation market in 2025, underpinned by beverage distributors that streamline repetitive case handling with palletizing robots. State mandates in China require 70% mechanization of cold-chain sites by 2025, prompting carriers like SF Express to adopt multi-zone AS/RS systems with temperature ranges from -25 °C to +15 °C.
Post and parcel accounted for 19% of 2025 revenue, driven by high-speed sorters at hubs processing over 18,000 parcels per hour. Apparel and general merchandise accounted for 22%, but slower automation due to SKU variability complicates robotic grasping. Manufacturing accounted for 16%, with auto and electronics plants using AGVs to improve safety and increase space utilization. Pharmaceuticals, chemicals, and other niches expand on traceability standards that reward automated data capture. Overall, grocery momentum, especially for frozen and fresh produce, is driving the Asia-Pacific warehouse automation market beyond its historical reliance on parcel carriers.
By Warehouse Function:
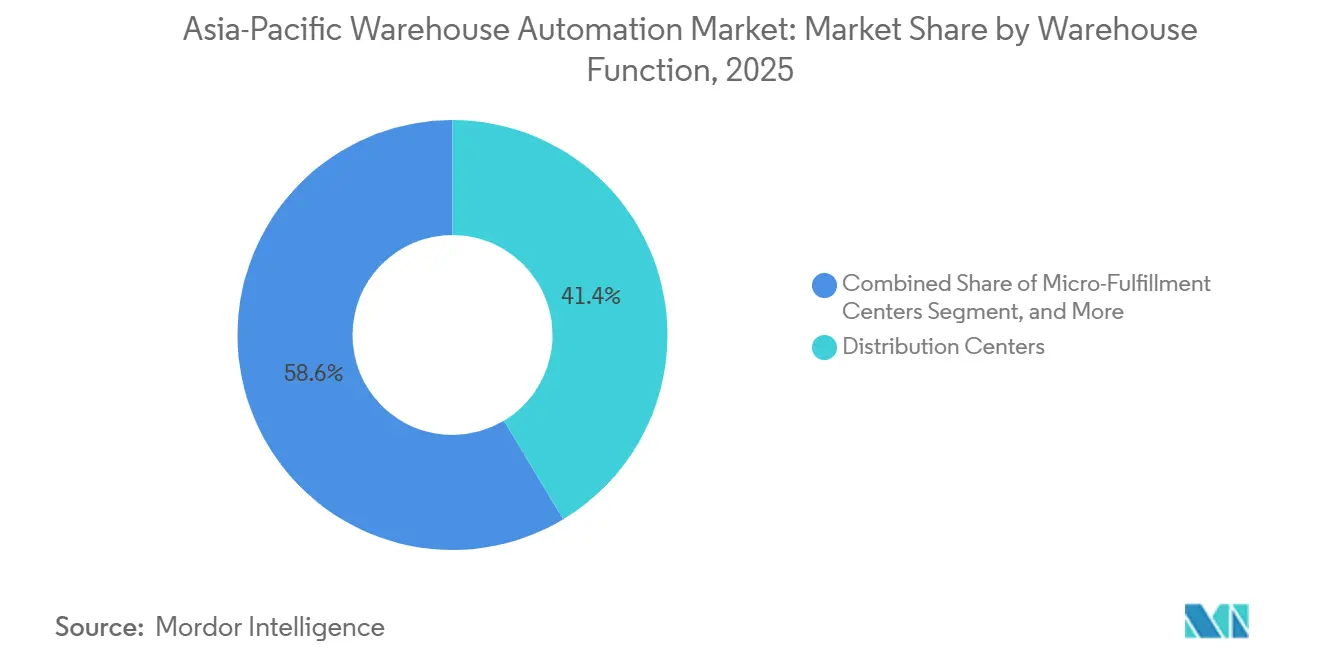
Micro-Fulfillment Outpaces Distribution GiantsDistribution centers still accounted for 41.38% of 2025 revenue, underscoring the need for master hubs that feed regional spokes. Yet micro-fulfillment centers log an 18.51% CAGR, the highest among functions, because urban consumers now value speed over assortment breadth. Goods-to-person workcells in spaces under 10,000 ft² store upward of 20,000 SKUs, delivering pick rates previously achievable only in full-scale facilities.
In Beijing, Singapore, and Sydney, dark stores play a pivotal role in the micro-fulfillment landscape. These stores, strategically located to optimize last-mile delivery, enhance operational efficiency and customer satisfaction. By diversifying revenue streams, this complex arrangement bolsters the stability and resilience of the Asia-Pacific warehouse automation market. It minimizes the risks associated with dependency on a single channel, ensuring the market remains adaptable to changing dynamics and external disruptions.
By Warehouse Size:
Small Urban Sites Gain TractionLarge complexes above 250,000 ft² accounted for 46.78% of 2025 turnover, led by mega-distribution facilities processing over 2 million parcels daily. Small sites under 50,000 ft², however, grow fastest at a 17.92% CAGR because inner-city rents push operators to vertical storage, which multiplies cubic capacity. AutoStore grids in Singapore pack 30,000 SKUs into footprints under 10,000 ft², justifying high capex with four-fold density gains.
Japan and South Korea witness the sharpest shift to small formats as zoning limits curb greenfield builds, compelling retrofit solutions with lift heights exceeding 16 bins. In India and parts of Southeast Asia, land availability still favors sprawling sheds, yet rising labor costs and consumer demand for next-day delivery are nudging operators toward compact automated hubs. Vendors now offer plug-and-play packages for ceilings below 8 meters, enabling rapid fit-outs and accelerating the adoption of the Asia-Pacific warehouse automation market.
Geography Analysis
China Warehouse Automation Market
China’s leading 56.83% share in 2025 mirrors its unparalleled e-commerce scale. Cainiao and JD Logistics jointly processed 120 billion parcels in 2024 across 1,200 automated facilities loaded with 200,000 mobile robots, delivering 99.9% accuracy. Cold-chain objectives in the 14th Five-Year Plan compel food distributors to install shuttle systems that cut food waste by 15% while reducing energy per order by 22%. Domestic vendors Geek+ and HAI Robotics supply robots priced 30-40% below foreign rivals, accelerating adoption in second-tier cities and keeping the Asia-Pacific warehouse automation market leadership firmly in Chinese hands.
India Warehouse Automation Market
India follows with the region’s fastest CAGR of 18.56%. Government mega-corridor spending and a 6% production-linked tax credit for logistics automation shorten payback to near three years for mid-tier 3PLs. Amazon will add 15 new fulfillment centers by 2027, Flipkart pledged USD 700 million for automation, and Reliance Retail uses 500 GreyOrange robots to sustain same-day service across 12 metros. While wages remain low, high-throughput segments such as electronics and grocery justify capital outlays, helping India steadily chip away at China’s dominance in the Asia-Pacific warehouse automation market.
APAC Warehouse Automation Market
South Korea showcases the region’s first large-scale 5G private network at CJ Logistics’ Icheon hub, synchronizing 500 robots with sub-10 ms latency. Australia experiments with decentralized micro-fulfillment, with Coles operating 15 AutoStore cells that serve 90-minute windows across urban corridors. Southeast Asia, grouped as Rest of Asia-Pacific, accelerates sortation automation for Lazada and Shopee hubs, pushing the combined share to 14% and adding diversity to the Asia-Pacific warehouse automation market growth profile.
Regulatory Landscape
Warehouse automation regulation across Asia-Pacific is tightening around safety, radio compliance, and localized technical requirements for mobile robots and unmanned facilities. In China, WB/T 1147-2026 (General Technical Requirements for Unmanned Warehouses) standardizes mechanical and electrical safety expectations for unmanned storage operations, aligning with broader operator and insurer emphasis on frameworks such as ISO 3691-4 for industrial trucks and AMRs. South Korea amended the Intelligent Robots Development and Distribution Promotion Act in 2024, tasking the Ministry of Trade, Industry and Energy with quality assurance policies for intelligent robots, reinforcing compliance and testing norms relevant to warehouse robot deployments.
Market access requirements are also becoming more country-specific, shaping how imported robotics and connected systems are brought into use. Vietnam’s Ministry of Industry and Trade issued Circular No. 12/2026/TT-BCT (May 2026), setting operating system-related requirements for imported warehouse robotics from July 1, 2026. Malaysia launched the MY-ROBO 2026 certification program (May 2026) for imported warehouse robots, with mandatory compliance for new imports from October 1, 2026. On the trade facilitation side, the RCEP Secretariat launched PEIS v2.0 in May 2026 across member economies to enable faster electronic verification of certificates of origin for industrial automation equipment, supporting cross-border movement of automation hardware and sub-systems used in automated warehouses.
Value Chain Analysis
The value chain begins with upstream component suppliers for sensors, servo drives, controllers, batteries, safety systems, and industrial compute. It then moves to robot and system OEMs (AMR/AGV makers, shuttle and AS/RS providers, and conveyor and sortation manufacturers), followed by warehouse software providers (WMS/WES and execution layers). System integrators and engineering firms form the critical midstream layer, combining mechanical design, controls, safety validation, and IT-OT integration before deployment into brownfield and greenfield sites, which supports the services segment as operators address interoperability and cybersecurity requirements.
Downstream demand is concentrated among e-commerce retailers, parcel carriers, 3PLs, and cold-chain grocery operators, who procure turnkey systems or phased retrofits and then contract multi-year maintenance and uptime services. Recent buildouts illustrate the shift toward automation-dense regional hubs and the growing role of simulation and orchestration software. Maersk opened the 1.1 million sq ft World Gateway II automated distribution centre in Singapore in March 2026 using multi-shuttle systems, AS/RS, and autonomous case-handling robots. DHL and Tetra Pak deployed a digital twin warehouse in April 2026 to model scenarios and remove bottlenecks. New capacity investments, such as Jabil’s AI-enabled logistics hub in Penang, Malaysia, which launched in July 2026 with autonomous systems and digital-twin technology, also reinforce the local commissioning, spares, and support partner footprint that helps automated facilities sustain high utilization.
Competitive Landscape
The competitive field is moderately fragmented. The top five Daifuku, Murata Machinery, Geek+, GreyOrange, and SSI Schaefer commanded 38% revenue in 2025, leaving 62% to niche robotics firms, local integrators, and pure-play software vendors. Japanese and European suppliers highlight safety and ISO 3691-4 compliance, both of which are requirements for insurance coverage in mature markets. Chinese disruptors compete aggressively on price, offering autonomous mobile robots for USD 20,000-35,000, undercutting incumbents by up to 40%. The tug-of-war keeps margins in check but broadens customer choice, driving deeper penetration of the Asia-Pacific warehouse automation market.
Strategy bifurcates into asset-heavy turnkey providers and asset-light subscription models. Daifuku and Murata favor 10-15-year service wraps with guaranteed uptime, stabilizing revenue but requiring large capital budgets from clients. GreyOrange and Locus Robotics promote robotics-as-a-service at USD 2,000-4,000 per robot per month, opening doors for smaller 3PLs but inflating total costs in the longer term. Cybersecurity now influences buying decisions after Daifuku’s 2024 ransomware outage. Vendors rushing to certify under IEC 62443 gain preference among risk-averse operators, nudging the Asia-Pacific warehouse automation market toward more secure architectures.
Partnerships flourish as technology lines blur. AutoStore links with SoftBank Robotics to add mobile manipulators to its cube storage, enabling mixed-SKU pick automation previously limited by gripping constraints. Geek+ partnered with Uniqlo to deploy 800 robots across 10 sites, reinforcing confidence in Chinese tech to Japanese standards. Daifuku’s 60% stake in Godrej Consoveyo strengthens its Indian exposure and tropical-climate engineering capabilities. Funding rounds remain robust. GreyOrange secured USD 135 million in Series D funding during 2025, signaling investor confidence that the Asia-Pacific warehouse automation market retains a multi-year runway.
Asia-Pacific Warehouse Automation Industry Leaders
-
Daifuku Co., Ltd.
-
Murata Machinery, Ltd.
-
Swisslog Holding AG
-
ABB Ltd.
-
Toshiba Global Commerce Solutions
- *Disclaimer: Major Players sorted in no particular order
Asia-Pacific Warehouse Automation Market Companies Covered in this Report
- Daifuku Co., Ltd.
- Murata Machinery, Ltd.
- Geek+ Inc.
- GreyOrange Pte. Ltd.
- SSI Schaefer Group
- Swisslog Holding AG
- Toyota Material Handling
- HAI Robotics
- ABB Ltd.
- Yaskawa Electric Corporation
- Godrej Consoveyo Logistics Automation Ltd.
- Bastian Solutions
- ST Engineering
- Toshiba Global Commerce Solutions
- Vanderlande Industries
- Honeywell Intelligrated
- Knapp AG
- Locus Robotics Corp.
- Kion Group
Read Analysis of Asia-Pacific Warehouse Automation Companies
Market Opportunities and Future Outlook
Opportunities are emerging in high-density, land-constrained logistics nodes and in verticals that require traceability and controlled handling, where automation investment is already showing up in major greenfield and retrofit projects. Singapore continues to act as a regional testbed and buying center for advanced systems, after Maersk opened its World Gateway II fully automated distribution centre there in March 2026 with an investment reported above S$200 million. Swisslog’s AutoStore deployment at Satair’s aerospace logistics facility (announced April 2026) also points to continued adoption beyond retail into specialized parts distribution. In Taiwan, UPS opened the Taoyuan International Logistics Center in April 2026 as a US$100 million facility integrating AMRs for inventory management and picking, highlighting automation-led hub modernization.
Technology-led whitespace is increasingly tied to software-orchestrated operations and space-optimization architectures, particularly as operators aim for throughput gains without expanding footprints. Digital twins in Asia-Pacific warehouses, including the DHL and Tetra Pak deployment in April 2026, support vendor offerings that combine simulation, execution software, and predictive maintenance for mixed fleets. In Japan, Taisei and Fanuc’s July 2026 announcement on an AI-powered automated warehouse concept focused on doubling storage density underscores demand for solutions that raise cubic utilization and reduce travel, creating room for high-density AS/RS, shuttle, and goods-to-person systems bundled with WES and analytics that unify disparate automation assets.
Recent Industry Developments in Asia-Pacific Warehouse Automation Market
- May 2026: Daifuku announced a strategic growth investment plan of approximately JPY 52 billion covering 2026 through 2029, including a planned acquisition of Germany-based Eisenmann GmbH in July 2026. The move signals continued consolidation and capacity building among global material-handling leaders, with implications for project delivery capability and solution breadth offered to Asia-Pacific warehouse operators.
- October 2025: Geek+ formed a USD 45 million alliance with Uniqlo to deploy 800 robots across 10 distribution centers in China and Japan, targeting faster fulfillment. The rollout supports higher robot density in apparel and general merchandise networks and raises the bar for multi-site fleet management and integration services.
- July 2024: Singapore capped foreign-worker ratios in logistics at 35%, accelerating the business case for goods-to-person automation and AMR deployments to sustain throughput. The policy shift reinforced demand for solutions that reduce manual handling dependence while meeting safety and compliance requirements in mature hub markets.
Asia-Pacific Warehouse Automation Market Report Scope and Research Methodology
Market Definition and Coverage
For this study, the market covers spending on warehouse automation solutions used inside distribution, fulfillment, and similar storage facilities across Asia-Pacific, including automation hardware, the supporting software layer, and the related services needed to implement and maintain these systems.
Scope exclusions: We exclude general factory automation that is not used within warehouse operations, as well as manual handling equipment that does not automate movement, storage, picking, or sorting.
Segments Covered in This Report
- By Component
- Hardware
- Mobile Robots (AGV, AMR)
- Automated Storage and Retrieval Systems (AS/RS)
- Automated Conveyor and Sorting Systems
- De-palletizing/Palletizing Systems
- Automatic Identification and Data Collection (AIDC)
- Piece Picking Robots
- Software
- Warehouse Management Systems (WMS)
- Warehouse Execution Systems (WES)
- Services
- Hardware
- By End-User
- Food and Beverage
- Post and Parcel
- Groceries
- General Merchandise
- Apparel
- Manufacturing (Durable and Non-Durable)
- Other End-User
- By Warehouse Function
- Distribution Centers
- Fulfillment Centers
- Return Centers
- Cold Storage Facilities
- Micro-Fulfillment Centers
- Dark Stores
- By Warehouse Size
- Small (Below 50 000 sq ft)
- Medium (50 000 – 250 000 sq ft)
- Large (Above 250 000 sq ft)
- By Country
- China
- India
- Japan
- South Korea
- Australia
- Rest of Asia Pacific
Data Sources, Market Sizing, and Validation
Desk Research
Our desk work starts by locking the demand pool and the geography, and then gathering public signals that can be checked repeatedly year after year. We refer to official trade and industry datasets such as UN Comtrade, national customs portals in Asia-Pacific, the World Bank, and IMF macro series. We also use logistics and manufacturing indicators from sources such as OECD and national statistics offices.
To connect demand signals to real automation spending, we review public company filings, annual reports, investor presentations, and reputable press coverage on distribution center and fulfillment expansion in the region. We also use patent databases to track automation innovation intensity and where it is being deployed across Asia-Pacific. When needed, we supplement this with paid subscriptions for company financials and intelligence, import-export shipment-level records, patents, and contracts and tenders. These checks help approximate deal values and cross-check whether projects are actually progressing. The sources listed here are illustrative and not exhaustive, and many other references were used for data collection, validation, and clarification.
Primary Interviews and Surveys
Primary work is used to stress-test assumptions that desk sources cannot confirm cleanly, such as typical project scope, average selling price behavior, and replacement cycles for core automation assets. We speak with a balanced mix of automation solution providers, component and software specialists, integrators, and warehouse operators across key Asia-Pacific countries, so the model reflects both supplier-side pricing and buyer-side rollout plans. These discussions help us confirm adoption patterns by warehouse type, for example distribution centers versus micro-fulfillment, and align the final estimates to practical installation timelines.
Distribution of primary research fieldwork respondents
| Company type | Respondent position |
|---|---|
| Top tier: 38% | CXOs: 14% |
| Mid tier: 46% | Functional/Unit leaders: 41% |
| Smaller Players: 16% | Managers: 45% |
Market-Sizing & Forecasting
Sizing begins with a top-down build that reconstructs Asia-Pacific warehouse automation demand using warehouse capacity additions, fulfillment and parcel throughput growth, and the observed pace of automation penetration by facility type. Once that ceiling is formed, we corroborate it with selective bottom-up approximations, such as sampled project values from integrator pipelines, supplier revenue exposure checks, and a simple ASP times shipment volume approach for common systems where inputs are available.
A few of the key inputs we track in the model include the number and expansion rate of distribution and fulfillment centers, e-commerce order volumes and parcel shipment trends, labor availability and wage pressure signals, capital spending appetite in logistics and manufacturing, and the mix shift between greenfield and retrofit projects, since these change system scope and budgets. Where direct volumes are not observable, gaps are handled through conservative ranges agreed in interviews, and then narrowed using cross-checks like tender activity, public project announcements, and import patterns for automation equipment.
For forecasting, we mainly use scenario analysis because adoption speed can swing based on labor conditions, customer delivery expectations, and investment cycles, which do not move in a straight line. The scenarios are anchored to expert views on pipeline conversion, expected ASP progression, and lead-time constraints, and then combined into a central case used for the published forecast.
Data Validation & Update Cycle
We validate outputs by checking if the implied spending per facility and the implied automation intensity align with what operators and integrators describe as realistic for the region. Unusual jumps are reviewed by tracing them back to one of the drivers, such as a sudden change in warehouse construction, a one-time mega project, or a pricing reset in key equipment, and then the assumption is corrected or clearly documented.
Before sign-off, the model and calculations go through multi-step analyst reviews, including variance checks against independent indicators like trade flows, public capex commentary, and tender pipelines. If a mismatch stays material, we re-contact experts to confirm whether the change is real or a data artifact. The report is refreshed annually, and interim updates are made when major events shift adoption, pricing, or supply lead times, followed by a final pre-delivery review so clients receive the latest view.
Mordor Intelligence's Asia Pacific Warehouse Automation Market Estimate Compared With Other Published Estimates
Published numbers for Asia-Pacific warehouse automation often do not line up because the market boundary is drawn differently across studies, and because the underlying demand signals used to validate the totals are not always the same. Differences also come from whether services and software are counted consistently, and whether the estimate reflects actual installation timing or only announced projects.
Project award trails, tender mentions, and equipment import patterns are the evidence checks that keep Mordor Intelligence tied to realized automation activity in Asia-Pacific facilities, rather than only a broad intralogistics spend pool. In addition, some published figures lean on a narrow definition that emphasizes robotics only, and some use an undefined base year or a regional mix that underweights China, Japan, and South Korea. That mix issue can shift totals by several billion dollars.
Overall, the spread in published values is largely explained by what is included in the solution scope and how strongly the totals are anchored to observable deployment signals. By keeping assumptions traceable to facility activity, project pipelines, and practical ASP and rollout timing, the final market size stays repeatable and easier to reconcile with what buyers and suppliers see on the ground.
Benchmark comparison
| Source | Market Size | Gaps in Research Methodology |
|---|---|---|
| Mordor Intelligence | USD 14.18 B (2025) | |
| Regional Consultancy A | USD 12.60 B (2024) | The figure is presented without a clearly stated base year definition and can reflect a narrower solution scope, which may undercount services and software attached to warehouse automation projects. |
| Industry Blog B | USD 2.10 B (2023) | This estimate appears closer to a subset view that emphasizes automation adoption commentary and may exclude major fixed systems and larger-scale warehouse build-outs across the full Asia-Pacific region. |
Overall, the spread in published values is largely explained by what is included in the solution scope and how strongly the totals are anchored to observable deployment signals. By keeping assumptions traceable to facility activity, project pipelines, and practical ASP and rollout timing, the final market size stays repeatable and easier to reconcile with what buyers and suppliers see on the ground.
Key Questions Answered in the Report
What is the projected value of the Asia-Pacific warehouse automation market in 2031?
The sector is expected to reach USD 38.57 billion by 2031, growing at a 17.31% CAGR from 2026 to 2031.
Which end-user category is growing fastest in warehouse automation adoption across Asia-Pacific?
Groceries lead with an 18.77% CAGR through 2031, propelled by stricter cold-chain rules and rapid-delivery models.
How significant is China’s role in regional warehouse automation spending?
China accounted for 56.83% of 2025 revenue, reflecting its vast e-commerce ecosystem and state-backed mechanization targets.
Why are services revenue expanding faster than hardware in the region?
Operators increasingly rely on integration, predictive maintenance, and workforce upskilling, driving services to a 17.93% CAGR.
Which warehouse function records the highest growth rate through 2031?
Micro-fulfillment centers post the fastest rise, logging an 18.51% CAGR as retailers move inventory closer to urban shoppers.
What financing option helps smaller 3PLs adopt automation without large upfront costs?
Robotics-as-a-service subscriptions, typically USD 2,000-4,000 per robot each month, cut capex though raise long-term spend.