
Market Overview
| Study Period | 2020 - 2031 |
|---|---|
| Forecast Data Period | 2026 - 2031 |
| Base Year Market Size (2025) | USD 624.36 Billion |
| Market Size (2026) | USD 674.51 Billion |
| Market Size (2031) | USD 992.36 Billion |
| Growth Rate (2026 - 2031) | 8.03 % |
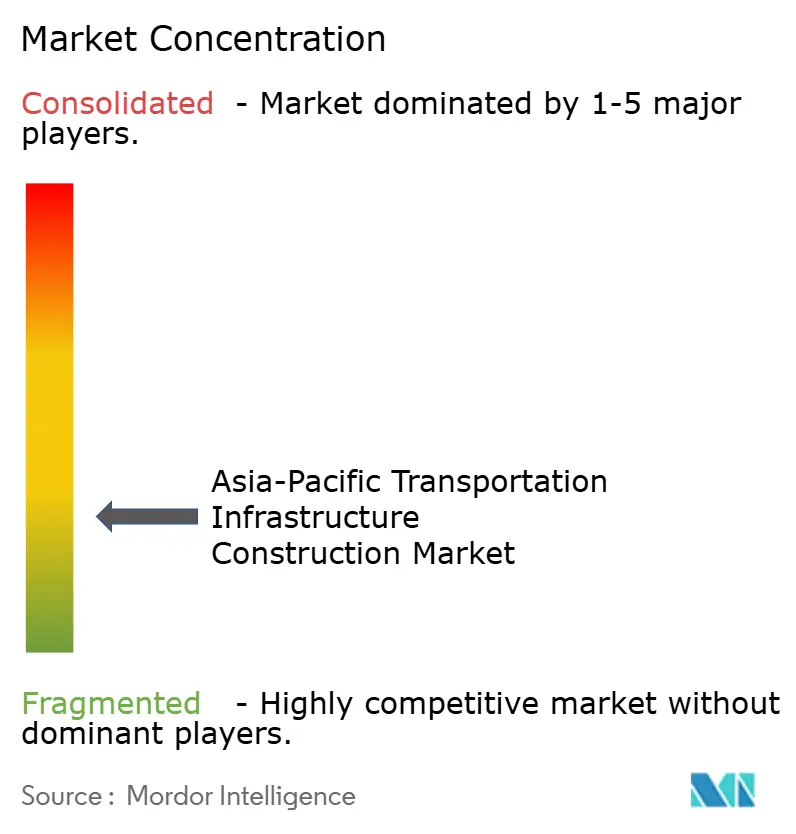
| Market Concentration | Low |
Major Players *Disclaimer: Major Players sorted in no particular order Image © Mordor Intelligence. Reuse requires attribution under CC BY 4.0. | |
Asia-Pacific Transportation Infrastructure Construction Market Analysis by Mordor Intelligence
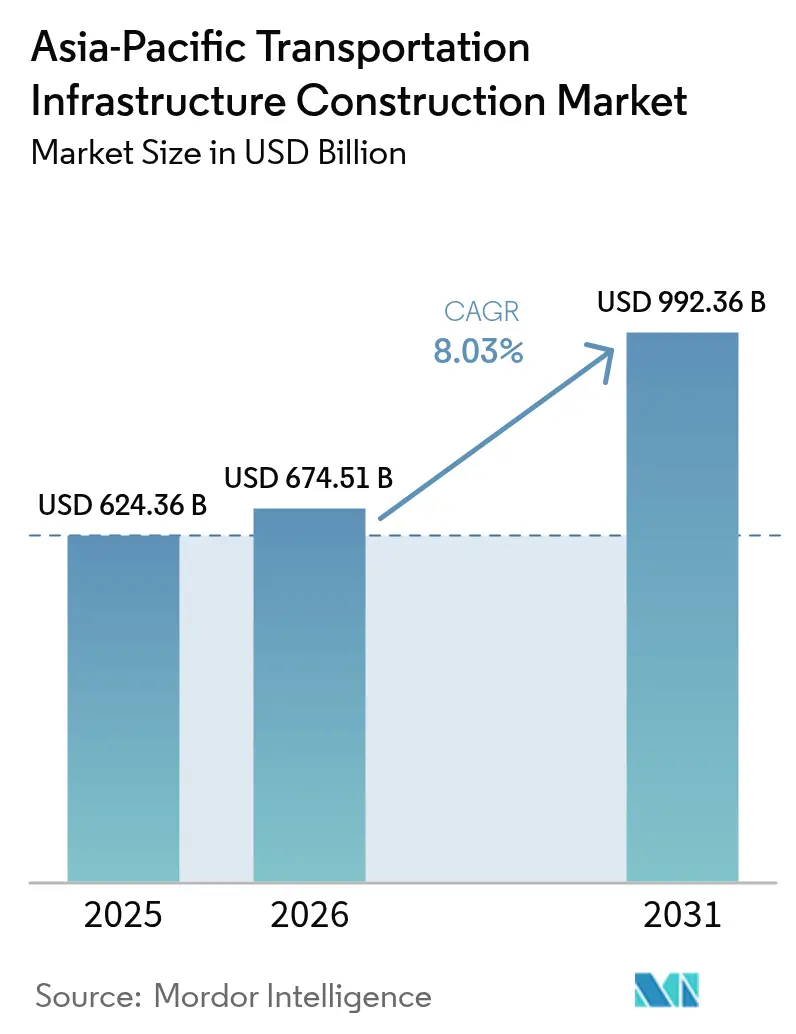
The Asia-Pacific Transportation Infrastructure Construction Market size is expected to grow from USD 624.36 billion in 2025 to USD 674.51 billion in 2026 and is forecast to reach USD 992.36 billion by 2031 at 8.03% CAGR over 2026-2031. Governments across the region view road, rail, port, and airport programs as instruments to unlock export competitiveness, secure energy-transition goals, and de-risk supply chains. Roadways retained the largest 2024 slice at 56.7% share, yet railways now lead headline growth as electrification and high-speed corridors undercut short-haul aviation economics. India’s 10.41% CAGR forecast underscores how a coordinated National Infrastructure Pipeline, metro build-outs, and new airports are transforming voter expectations and developer pipelines. Private capital is growing faster than budgetary outlays because public-private partnership templates in India, Thailand, and Australia reduce diligence time and allocate risk more predictably. Competitive intensity is rising as Chinese state-owned majors bid aggressively on cross-border megaprojects while local champions in India, Japan, and Southeast Asia protect niches that reward tunneling skill, seismic retrofits, and automation expertise,.
Key Report Takeaways
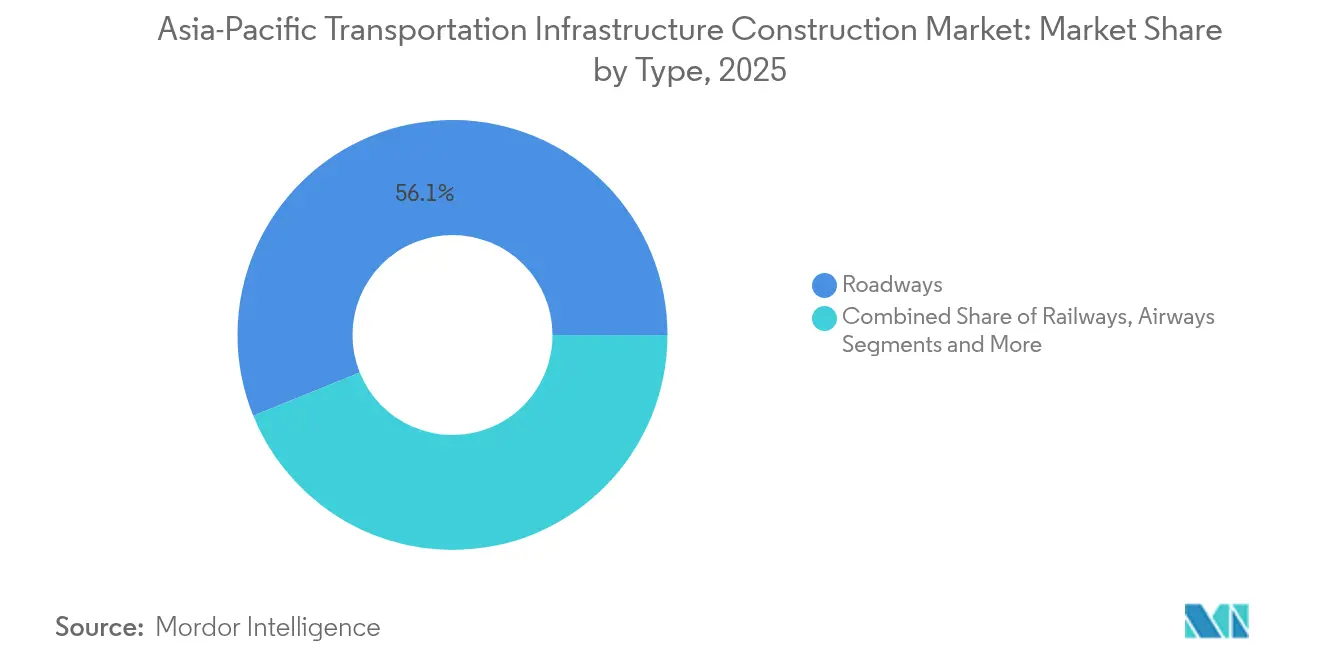
- By transport mode, roadways led with 56.12% revenue share in 2025; railways are forecast to expand at a 8.83% CAGR through 2031.
- By construction type, new builds accounted for 69.35% of the Asia Pacific transport infrastructure construction market share in 2025, while renovation is advancing at a 9.05% CAGR to 2031.
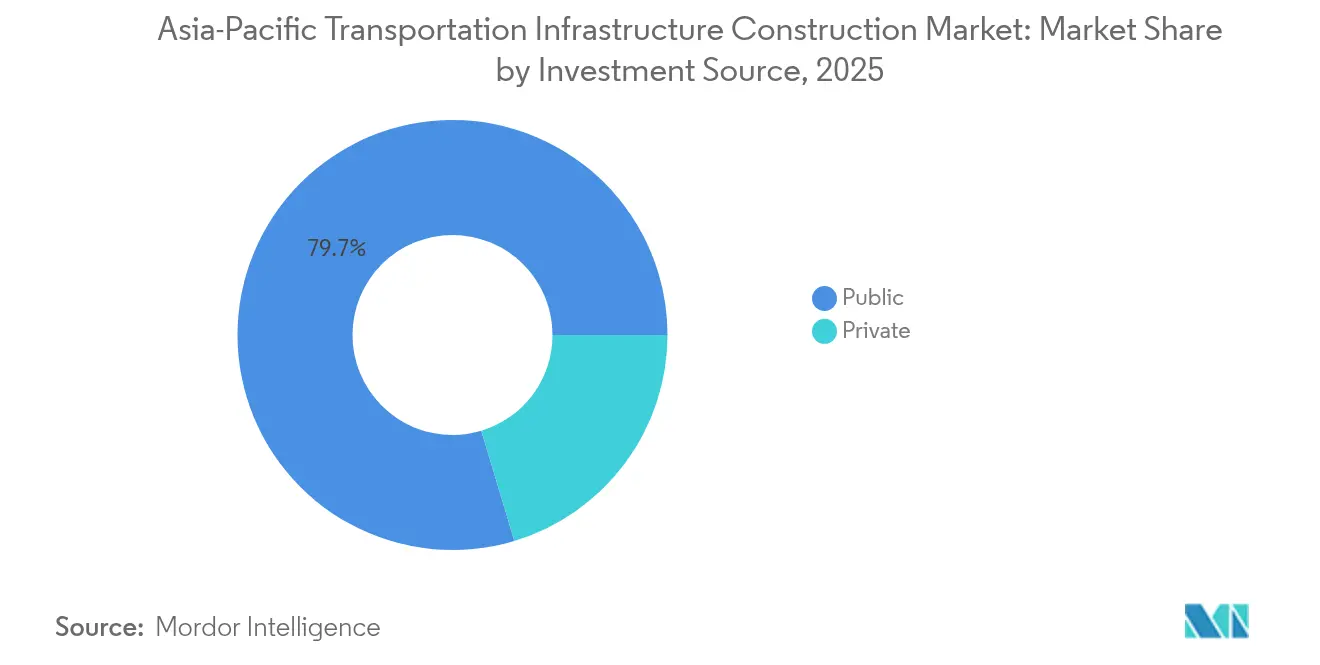
- By investment source, public funding controlled 79.65% of the Asia Pacific transport infrastructure construction market size in 2025; private capital records the highest projected CAGR at 9.52% to 2031.
- By country, China commanded 39.25% of 2025 value; India posts the fastest growth at 10.02% CAGR through 2031.
Note: Market size and forecast figures in this report are generated using Mordor Intelligence’s proprietary estimation framework, updated with the latest available data and insights as of 2026.
Market Trends and Insights
Drivers Impact Analysis of Asia-Pacific Transportation Infrastructure Construction Market*
| Drivers | (~) % Impact on CAGR Forecast | Geographic Relevance | Impact Timeline |
|---|---|---|---|
| Rapid urbanization and megacity growth | +2.3% | India, Indonesia, Philippines, Vietnam (Mumbai, Jakarta, Manila, Ho Chi Minh City) | Medium term (2-4 years) |
| Regional trade and logistics corridors | +1.9% | China, ASEAN core (Thailand, Vietnam, Malaysia) plus South Asia spill-over via BRI | Long term (≥ 4 years) |
| Government stimulus and PPP maturation | +2.1% | Pan-APAC with near-term traction in India, Thailand, Australia, Philippines | Short term (≤ 2 years) |
| Decarbonization and rail electrification | +1.5% | India, China, Japan, South Korea, Australia | Medium term (2-4 years) |
| Airport capacity and smart-port upgrades | +1.2% | India, Southeast Asia (Thailand, Philippines, Indonesia) plus China coastal hubs | Short term (≤ 2 years) |
| Source: Mordor Intelligence | |||
Rapid Urbanization And Megacity Growth Requiring Metros, BRT And Commuter Rail
Megacity expansion is rewriting urban mobility economics. India’s Mumbai–Ahmedabad high-speed rail, now under phased construction, will cut end-to-end travel to under three hours and effectively merge two labor markets. Jakarta’s planned capital in Kalimantan embeds a 50-kilometer metro and green-field airport, demonstrating how spatial relocation sidesteps legacy congestion FT.COM. Seoul’s Great Train eXpress adds three orbital lines that promise 30-minute trips from satellite towns, spurring higher-density housing. These systems share electric or hybrid rolling stock that aligns with decarbonization pledges while lowering life-cycle costs. Collectively, they anchor the 2.3% positive swing in regional CAGR by shifting commuter preference from private cars to rail-based mass transit.
Regional Trade And Logistics Corridors To Boost Connectivity
Policy makers now treat inland rail, deep-water ports, and multi-lane highways as geopolitical hedges rather than pure freight plays. Pakistan’s USD 10 billion ML-1 upgrade links Karachi to the Afghan frontier under China’s Belt and Road Initiative and gives Central Asia a maritime alternative. Indonesia’s Patimban Port, partially opened in 2024, eases pressure on Jakarta’s Tanjung Priok by focusing on auto and electronics exports. Thailand’s Bangkok–Kunming high-speed rail underscores ASEAN’s bid to compete with ocean lanes by offering faster land delivery. Vietnam approved a USD 67 billion Hanoi–Ho Chi Minh City line that blends passenger and light-freight capacity. These corridors accommodate dual-use logistics, shaping supply-chain security and adding 1.9% to growth prospects[1]World Bank Transport Team, “Philippines Urban Transport Improvement,” World Bank, worldbank.org.
Government Stimulus And PPP Models Unlocking Multi-Year Pipelines
Fiscal stimulus continues but is now paired with structured PPP templates that balance sovereign guarantees with commercial equity. The Asian Development Bank injected USD 500 million into India’s metro and highway roster in 2024, catalyzing co-investment by domestic insurers ADB.ORG. Thailand reserved 40% of its USD 76 billion stimulus for PPP-ready schemes, signaling a definitive pivot away from pure budget procurement. Australia’s 2024 budget ties any project above USD 330 million to a private-finance screening process, accelerating deal flow. The Philippines secured an initial USD 30 million World Bank loan to fund pre-feasibility studies, smoothing the path to larger debt placements. These—and similar—actions contribute a 2.1% uplift to the regional CAGR by shortening financial close cycles.
Decarbonization: Rail Electrification, Low-Carbon Mobility And Charging Infrastructure
Environmental mandates have moved from strategy decks to contract specifications. India electrified 95% of its broad-gauge network by late 2024, trimming diesel use and operating costs by up to a quarter. Indonesia’s Jakarta–Bandung bullet train is powered by a renewables-rich Java grid, serving as a low-carbon template for Vietnam’s pending high-speed corridor. Japan’s Chuo Shinkansen maglev recovers energy during braking and aims for 30% lower emissions than the current rolling stock. Australia integrates electric-vehicle charging at Inland Rail rest stops, anticipating shared passenger–freight networks. This pervasive design shift lifts regional growth by 1.5% as projects are future-proofed for zero-emission mobility.
Restraints Impact Analysis of Asia-Pacific Transportation Infrastructure Construction Market*
| Restraints | (~) % Impact on CAGR Forecast | Geographic Relevance | Impact Timeline |
|---|---|---|---|
| Funding gaps and higher interest costs | -1.4% | APAC-wide, acute in India, Indonesia, Philippines, Vietnam | Short term (≤ 2 years) |
| Land acquisition, permits and resettlement delays | -0.9% | India, Indonesia, Philippines, Malaysia | Medium term (2-4 years) |
| Complex geology, climate risk and skilled-labor shortages | -0.7% | Southeast Asia, Japan seismic zones, Australia remote corridors | Long term (≥ 4 years) |
| Source: Mordor Intelligence | |||
Funding Gaps And Higher Interest Rates Straining Capex And PPP Bankability
Tighter monetary policy erodes debt headroom and pushes required project yields above historical toll and fare trajectories. Concessions penciled at 4% interest now chase equity at yields topping 7%, stalling bids on Indian highways and Philippine metros. Indonesia’s USD 33 billion capital-move pipeline has attracted less than one-fifth of the planned private stake, forcing upfront public spend and scope deferrals. The National Infrastructure Pipeline in India similarly sees slower private lane uptake due to forex and traffic volatility. These financing gaps subtract 1.4% from regional growth until borrowing costs stabilize and tariff formulas adopt inflation indexation.
Land Acquisition, Environmental Approvals And Resettlement Delays Extending Timelines
Protracted clearances routinely add 18-24 months and inflate budgets. Gujarat farmers delayed the Mumbai–Ahmedabad bullet train despite revised compensation packages that ballooned by 30%. Indigenous groups in Indonesia’s Trans-Sumatra corridor withheld the right-of-way without community upgrades, pausing works. Malaysia’s East Coast Rail Link was rerouted after environmental lobbying, generating a USD 1 billion cost add-on. Judicial challenges against Japan’s maglev line cite groundwater risks and continue to drag on tunnel permits. These frictions reduce CAGR by 0.9% through schedule overruns and interest-during-construction accrual.
*Our forecasts treat driver/restraint impacts as directional, not additive. The impact forecasts reflect baseline growth, mix effects, and variable interactions.
Asia-Pacific Transportation Infrastructure Construction Market Segment Analysis
By Type:
Railways Accelerate As Electrification Reshapes Modal EconomicsRailways captured 8.83% forecast CAGR, the fastest within the Asia Pacific transport infrastructure construction market, even though roadways retained 56.12% share in 2025. India’s near-total rail electrification lowered fuel costs by a quarter, making rail freight the low-carbon option for bulk commodities. Indonesia’s 2024 opening of the Jakarta–Bandung line validated renewable-powered traction that Vietnam is now formatting for its north-south high-speed plan. Beyond cost, high-speed networks integrate labor markets, as evident from Japan’s continuing maglev investment. The Asia Pacific transport infrastructure construction market size for rail projects is therefore projected to compound fast enough to surpass USD 233.4 billion by 2031, should current pipelines reach financial close.
Airports and seaports follow with moderate CAGRs, powered by tourism recovery and export re-shoring. Singapore’s automated Tuas Port and Changi’s biometric terminals illustrate how turnaround speed now rivals capacity as the primary performance metric. China’s 60 automated container terminals baseline a regional shift toward 5G-connected cranes and driverless yard trucks. Upskilling requirements for air-side automation tilt contract awards toward firms with systems-integration capacity rather than pure civil capabilities. Overall, modal competition is no longer about lane kilometers or berth length alone; it revolves around energy efficiency, digital integration, and resiliency against climate disruptions.


By Construction Type:
Renovation Gains As Aging Assets Require Smart UpgradesNew construction held a 69.35% share of the Asia Pacific transport infrastructure construction market in 2025, reflecting a still-wide network gap in emerging economies. Yet renovation is growing at a 9.05% CAGR, faster than greenfield builds, because Japan, South Korea, and Australia must retrofit 1970s-era expressways and bridges for seismic or climate resilience. Japan commits around USD 15 billion through 2030 to seismic upgrades, while South Korea overhauls highways with congestion-based tolling that demands sensor-rich gantries and cloud analytics. Australia’s Inland Rail blends new track and legacy upgrades to double-stack freight, revealing an integrated design logic.
Renovation projects are increasingly capital-intensive; adding smart tolling or real-time structural health monitoring can lift per-lane costs above historical new-road benchmarks. Contractors able to stage works without full closures—through prefabricated bridge segments or modular signaling—win premium margins. As these projects demand both civil and digital engineering, consortia now include software vendors, cybersecurity firms, and telecom providers. This capability mix pushes renovation toward a roughly one-third share of total spend by 2031, shifting procurement criteria from lowest price to lifecycle value.
By Investment Source:
Private Capital Expands As PPP Structures MaturePublic funds still financed 79.65% of 2025 outlays, yet private investment climbs at 9.52% CAGR, the highest rate among capital sources, as clearer PPP guidelines improve bankability. The Asian Development Bank’s USD 500 million facility for Indian metros catalyzed pension-fund coinvestors, while Thailand earmarked USD 30 billion of its stimulus for concession-ready schemes. Australia insists that projects exceeding USD 330 million screen for private finance, expanding the investable universe.
A new hybrid PPP archetype blends multilateral concessional debt, sovereign guarantees, and inflation-indexed tariffs, shrinking completion-risk premiums. International sponsors such as VINCI and ACS bid not just on build contracts but lifetime concessions, including operations, digital upgrades, and commercial real-estate tie-ins. Consequently, the Asia Pacific transport infrastructure construction market size funded by private capital may crest USD 193.2 billion by 2031 if the current trajectory holds. Private investors are not replacing public money; they magnify fiscal reach by underwriting construction and operating risk over extended periods.
Geography Analysis
China and ASEAN Transportation Infrastructure Construction Market
China’s dominance, with a 39.25% 2025 share, stems from more than 170,000 kilometers of expressways and the world’s densest high-speed rail grid, yet future growth moderates as priorities move from capacity to automation, asset health monitoring, and carbon reduction. Automated container ports in Qingdao and Tianjin trim vessel dwell times and provide a template for Southeast Asian hubs that now court transshipment volume. Belt and Road ventures such as Pakistan’s ML-1 and Thailand’s Bangkok–Vientiane link export surplus civil-works capacity to neighboring markets, sustaining revenue for Chinese SOEs even as domestic builds plateau.
India Transportation Infrastructure Construction Market
India delivers the fastest 10.02% CAGR on the back of a broad policy pivot that treats infrastructure delivery as a political KPI. The Mumbai–Ahmedabad corridor, 20-million-passenger Navi Mumbai Airport, and multi-city metro build-outs display a new normal where mega-projects become campaign milestones. Domestic engineering houses like Larsen & Toubro, Dilip Buildcon and IRCON upgrade tunneling, signaling and O&M proficiency to match international benchmarks, ensuring local capture of value as project count accelerates.
Broader APAC Markets
Japan and South Korea keep growth moderate but high-value through Maglev, Great Train eXpress, and Incheon Airport expansions. Here, precision engineering, seismic resilience, and digital integration gain premium pricing. Australia, though smaller, embodies a strategic freight pivot: Inland Rail and Western Sydney Airport link resource basins to coastal export nodes while incorporating EV charging and hydrogen readiness. Indonesia’s Kalimantan move redistributes economic gravity within the archipelago and generates contiguous packages—such as Patimban Port extensions—that international contractors pursue with blended finance. Across Malaysia, Vietnam, the Philippines, and Thailand, ASEAN corridors knit resource provinces to export zones, helping secondary cities leapfrog infrastructure gaps through jointly funded expressways, airports, and rail spurs.
Regulatory Landscape
Regulation is tightening around safety, compliance, and digital permitting as governments scale multi-year road, rail, port, and airport programs. In Australia, the National Heavy Vehicle Regulator (NHVR) and National Transport Commission (NTC) released statutory instruments in May 2026 to support amended Heavy Vehicle National Law (HVNL) provisions, ahead of the August 1, 2026 commencement that updates accreditation, fatigue management, and safety assurance requirements.
Southeast Asia is also pushing faster approvals and more standardized technical requirements. The Philippines issued Executive Order No. 72 (2024) to integrate and harmonize processes for infrastructure master planning, budgeting, and approvals across sectors including transportation. Singapore advanced CORENET X as a mandatory digital submission pathway for larger projects (GFA 30,000 m2 and above) from October 1, 2025, reinforcing BIM-enabled compliance as a practical requirement for contractors and consultants. Vietnam is working in 2026 to finalize and promulgate a national technical standard (QCVN) for urban railways, while updates to road traffic order and safety requirements take effect July 1, 2026 under amended law.
Value Chain Analysis
The value chain covers planning and feasibility (often with multilateral and sovereign participation), design and engineering, procurement of materials and systems (steel, cement, asphalt/bitumen, aggregates, signaling, electrification, and airport/port automation), EPC delivery, testing and commissioning, and then long-tail operations and maintenance through concessions or asset managers. As PPP templates mature in markets such as India, Thailand, and Australia, procurement is increasingly bundling lifecycle responsibilities, bringing operators, financiers, and technology providers into the same delivery framework as civil contractors.
Execution risk is shifting toward input volatility and capacity constraints rather than pure contractor availability. Supply-side stress has included disruptions in materials flows (for example, reduced bitumen availability into India linked to Gulf route impacts) and bottlenecks tied to grid and utility readiness for energy-intensive works. This raises the value of early-stage utility coordination in project planning. Cost management and delivery schedules are therefore shaped by contract structures (indexation, risk-sharing, and variation mechanisms), regionalized sourcing, and the availability of specialized systems and commissioning expertise for rail electrification, smart ports, and biometric-enabled airport processing.
Competitive Landscape
Competitive power rests with a handful of Chinese SOEs—China State Construction Engineering, China Railway Construction, and China Communications Construction—that together controlled roughly 30%-35% of 2024 regional revenue. Their integrated engineering-procurement-construction chains and access to policy bank loans create cost advantages that are hard to match. Yet their market position is not unassailable. Indian majors like Larsen & Toubro prove competitive on complex metro tunneling after delivering the USD 3 billion Mumbai Metro Line 3 entirely underground while managing utility relocation beneath dense neighborhoods. Japanese conglomerates Obayashi, Kajima, and Shimizu secure airport and seismic-retrofit jobs where precision and quality command higher margins, a domain less sensitive to price competition.
Second-tier contenders differentiate via technology and financial structuring. Gamuda Berhad and Italian-Thai Development deploy modular viaduct construction and automation to slash on-site labor in Malaysia and Thailand. VINCI Construction Grands Projets, ACS, and Ferrovial leverage European PPP experience to structure airport and highway concessions that bundle O&M, retail, and real-estate monetization. Regional private equity funds now back mid-cap contractors that specialize in digital twin deployment and structural health monitoring, positioning them as partners for renovation-heavy pipelines.
Strategic moves illustrate the shifting landscape. China State Construction Engineering’s USD 4.5 billion Cairo monorail win extends its urban-rail turnkey offer globally. Hyundai Engineering & Construction’s USD 2.1 billion Saudi highway underscores how Asian builders chase Middle-East diversification to counter domestic slowdowns. Samsung C&T’s USD 300 million automation push into robotic rebar tying and 3D concrete printing targets productivity gains in labor-scarce markets. As renovation and smart-overlay projects rise, firms with systems-integration, cybersecurity, and data-analytics skills command premiums, tilting future rankings toward capability over sheer balance-sheet heft.
Asia-Pacific Transportation Infrastructure Construction Industry Leaders
China State Construction Engineering Corporation Ltd.
China Railway Construction Corporation
China Communications construction company Ltd.
Hyundai Engineering & Construction
OBAYASHI CORPORATION
- *Disclaimer: Major Players sorted in no particular order
Asia-Pacific Transportation Infrastructure Construction Market Companies Covered in this Report
- China State Construction Engineering Corp. Ltd.
- China Railway Construction Corp. Ltd.
- China Communications Construction Co. Ltd.
- Hyundai Engineering & Construction
- OBAYASHI CORPORATION
- Larsen & Toubro Ltd.
- Reliance Infrastructure Ltd.
- CPB Contractors (CIMIC Group)
- Dilip Buildcon Ltd.
- Italian-Thai Development PLC
- Shimizu Corporation
- Kajima Corporation
- Gamuda Berhad
- VINCI Construction Grands Projets
- Samsung C&T Engineering & Construction
- Penta-Ocean Construction
- PT Wijaya Karya Tbk
- China Harbour Engineering Company
- Beijing Construction Engineering Group
- Taisei Corporation
Read Analysis of Asia-Pacific Transportation Infrastructure Construction Companies

Market Opportunities and Future Outlook
Large, addressable investment requirements across Asia and the Pacific are creating whitespace for contractors and consortia that can deliver bankable packages and tighten permitting timelines. The Asian Transport Observatory estimates low- and middle-income economies in the region require around USD 2.6 trillion per year in transport infrastructure investment during 2025-2035, with roads taking a significant share of total needs. That scale keeps demand concentrated in program management, phased delivery, and rehabilitation, particularly where land, approvals, and financing constraints have become the binding factors.
Near-term opportunity clusters are also tied to named pipelines and projects where governments are moving procurement and scope decisions forward. Thailand has advanced a multi-project transport mega-pipeline linked to national connectivity goals, while the Philippines highlighted pending awards for key civil works packages on the USD 3.91 billion Bataan-Cavite Interlink Bridge (Manila Bay). Vietnam also reported accelerated construction activity for airside and fuel-supply elements at Long Thanh International Airport. Across the region, construction digitization is moving from tool proliferation to consolidation, with fewer disparate systems and broader use of AI/ML in workflows. That supports demand for contractors that can connect BIM-to-permit workflows, automate progress controls, and manage asset data handover for renovation-heavy portfolios.
Recent Industry Developments in Asia-Pacific Transportation Infrastructure Construction Market
- July 2026: China Railway Construction Corporation (CRCC) broke ground on Emirates Engineering Center at Dubai South, a large-scale aviation maintenance and engineering complex planned for delivery around 2030. The project underscores how Asia-based infrastructure contractors are extending transport-related capability into aviation hub developments and complex industrial facilities requiring heavy civil works and high-spec MEP execution.
- January 2025: Navi Mumbai International Airport commenced operations with an initial capacity of 20 million annual seats, incorporating biometric gates and automated baggage handling. Bringing a new major airport online reinforces the region’s active airport-capacity build cycle and supports follow-on packages in airside works, landside connectivity, and O&M-linked upgrades.
- December 2024: Larsen & Toubro completed tunneling for Mumbai Metro Line 3, a fully underground urban metro corridor delivered under dense, utility-heavy right-of-way conditions. The milestone reflects growing regional depth in complex metro construction, including shield tunneling, utility relocation, and systems-interface readiness that increasingly define megacity transport programs.


Asia-Pacific Transportation Infrastructure Construction Market Report Scope and Research Methodology
Market Definition and Coverage
This market measures the value of construction activity for transportation infrastructure across Asia-Pacific, covering spending tied to building and upgrading assets such as roads, rail lines, ports, and airports.
Scope exclusions: We exclude the ongoing operation of transport assets and pure equipment manufacturing that is not part of a construction contract value.
Segments Covered in This Report
- By Type
- Roadways
- Railways
- Airways
- Ports and Inland Waterways
- By Construction Type
- New Construction
- Renovation
- By Investment Source
- Public
- Private
- By Country
- China
- India
- Japan
- South Korea
- Australia
- Indonesia
- Rest of Asia-Pacific
Data Sources, Market Sizing, and Validation
Desk Research
Desk work starts with public capital spending and pipeline signals, because transportation construction is strongly driven by budgets and project awards. We leaned on sources such as ADB and World Bank infrastructure publications, national transport ministries and infrastructure agencies, and central statistics offices for construction output and price indices. We also used IMF and OECD macro series to anchor inflation, exchange-rate timing, and public investment direction, then cross-checked the picture with reputed press releases on corridor programs, metro expansions, and airport capacity additions.
On the supply side, we reviewed annual reports, investor decks, and tender disclosures from listed contractors and project developers to understand revenue mixes and backlog direction by country and mode. Where available, we also referenced paid subscriptions for company financials and news, plus a global contracts and tenders database to validate award cadence and typical contract values across large projects. These inputs helped us avoid over-counting the same program across multiple announcements and kept assumptions realistic when program details were missing. The desk sources cited here are illustrative only, and other public documents were also used for data collection, validation, and clarification.
Primary Interviews and Surveys
Primary work was used to test what is really being awarded and executed on the ground, especially when budgets and cashflows do not move in the same year. We spoke with EPC contractors, specialist civil contractors, project owners, consultants, and materials-linked participants to confirm typical project mix, renovation versus greenfield split, and how pricing is being quoted across major Asia-Pacific markets. When assumptions showed wide variance, we re-contacted respondents to confirm the likely range for escalation, procurement timing, and slippage risks before finalizing the model.
Distribution of primary research fieldwork respondents
| Company type | Respondent position |
|---|---|
| Top tier: 37% | CXOs: 17% |
| Mid tier: 46% | Functional/Unit leaders: 23% |
| Smaller Players: 17% | Managers: 60% |
Market-Sizing & Forecasting
The core model is built using top-down reconstruction of transportation construction spend by country and mode, where public budget lines, multi-year program allocations, and project award flows are translated into annual executed value. To keep totals consistent, we corroborated results with selective bottom-up checks such as sampled contractor revenues tied to transport works, typical contract value ranges from tenders, and volume proxies (lane-km additions, route-km rail builds, airport capacity expansions) multiplied by realistic cost bands.
A few inputs shaped the curve, including government capex and PPP pipeline timing, share of renovation versus new builds, construction cost inflation indices, currency conversion timing for local currency budgets, and mode-level unit cost trends that differ between roads, rail, ports, and airports. When project details were not disclosed, we handled gaps by using comparable projects in the same country and by applying conservative execution lags, then checked those choices against interview feedback.
For forecasting, we relied on scenario analysis anchored to confirmed program timelines and financing readiness, then stress-tested outcomes against macro indicators like GDP growth and public investment direction. In markets where escalation and supply constraints were a bigger driver, the pricing path was adjusted using an indexed approach so the forecast did not assume a flat cost environment year after year.
Data Validation & Update Cycle
Validation is done through multiple passes that compare outputs against independent signals such as transport capex trends, large award announcements, and construction output series, and then investigate outliers before sign-off. If a country total moves sharply, we check whether the driver is genuine (a mega project mobilization) or a modeling artifact (double counting, timing mismatch, or currency effect).
Reports are refreshed annually, and interim updates are made when material events occur, such as policy shifts, large PPP closures, or major project cancellations. Before delivery, a final review pass is completed so clients receive the most current view consistent with the latest public releases and our re-check calls.
Mordor Intelligence's Asia Pacific Transportation Infrastructure Construction Market Sizing Compared With Other Published Estimates
Published market sizes for transportation infrastructure construction in Asia-Pacific often look different because analysts do not always treat timing, pricing, and currency the same way. Even when the same countries are covered, differences show up based on whether values represent awarded work, executed work, or budgeted plans.
In our refresh-led approach, the spread usually comes from how quickly assumptions are updated for construction cost inflation, how local currency budgets are converted into USD, and whether renovation activity is blended into new build totals. When these items are updated on a fixed annual cycle with event-based rechecks, and currency timing is aligned to the base year, the resulting total stays closer to actual delivery pace, which is the logic applied by Mordor Intelligence.
Benchmark comparison
| Source | Market Size | Gaps in Research Methodology |
|---|---|---|
| Mordor Intelligence | USD 624.36 B (2025) | |
| Trade Journal A | USD 545.70 B (2026) | Uses a different year and appears to focus on a narrower reading of transport works, with less clarity on whether renovations and ancillary port and airport upgrades are fully counted. The figure also seems more sensitive to how local currency programs are converted to USD in the stated year. |
| Regional Consultancy B | USD 719.21 B (2024) | This number is for road and highway infrastructure only, so it is not directly comparable to an all-modes transportation construction total that includes rail, ports, and airports. The year difference also matters because road capex cycles and cost inflation can swing totals quickly across Asia-Pacific. |
Overall, the gap is mainly explained by scope boundaries (roads only versus all transport modes) and by timing choices around currency and escalation. By tying the model to executed construction value and checking it against award cadence and cost indices, we keep the final market size traceable to inputs that can be re-tested and updated in a repeatable way.


Key Questions Answered in the Report
How large is the Asia Pacific transport infrastructure construction market in 2026?
It is valued at USD 674.51 billion in 2026 and is forecast to hit USD 992.36 billion by 2031.
Which country will grow fastest through 2031?
India leads with a projected 10.02% CAGR, anchored by its National Infrastructure Pipeline and multiple metro and airport projects.
What is the role of private capital in upcoming projects?
Private investment grows at 9.52% CAGR because mature PPP frameworks blend multilateral debt, sovereign guarantees and indexed tariffs to reduce risk.
Why are railways gaining momentum over roadways?
Aggressive electrification, high-speed corridors and lower operating costs drive a 8.83% CAGR for rail projects, shifting freight and commuters from roads.
What are the main risks facing developers?
Higher interest rates, land-acquisition delays and skilled-labor shortages can add up to 1.4% negative impact on CAGR and extend timelines by up to two years.
Which technologies define next-generation transport assets?
Automation, 5G-enabled port cranes, biometric airport processing, modular construction and digital twins for asset monitoring are becoming standard across the region.
Page last updated on:


 Your data is secure and never sold or shared.


