Market Overview
| Study Period | 2019 - 2030 |
|---|---|
| Base Year For Estimation | 2024 |
| Forecast Data Period | 2025 - 2030 |
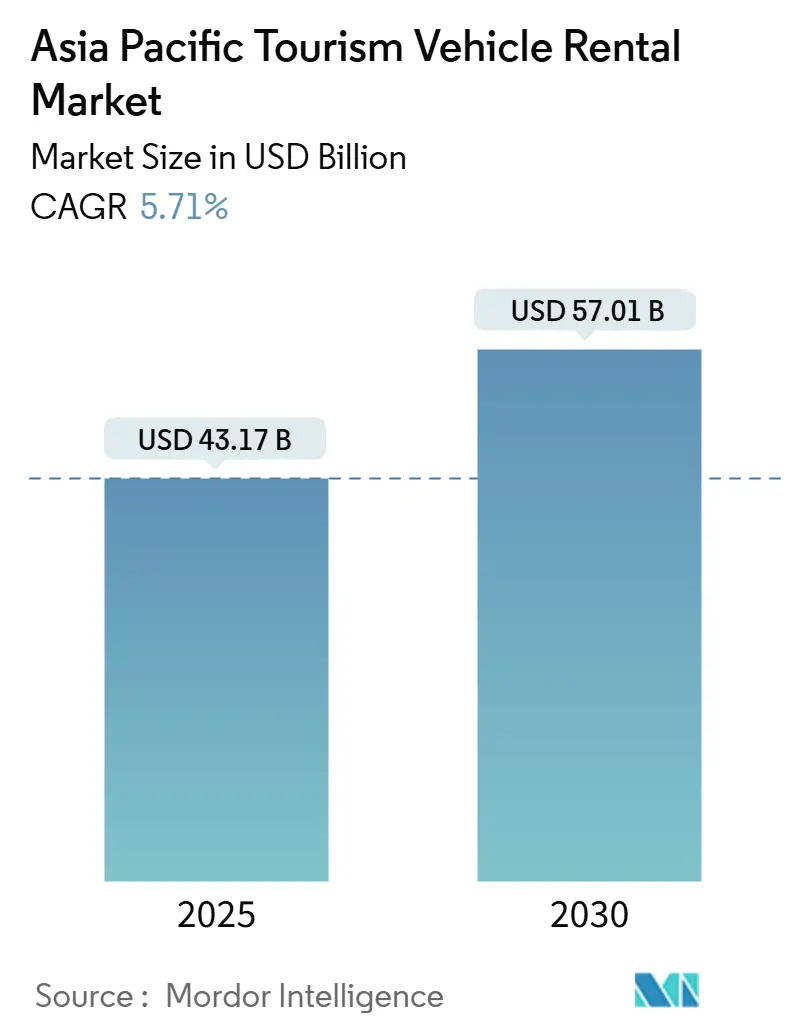
| Market Size (2025) | USD 43.17 Billion |
| Market Size (2030) | USD 57.01 Billion |
| Growth Rate (2025 - 2030) | 5.71% CAGR |
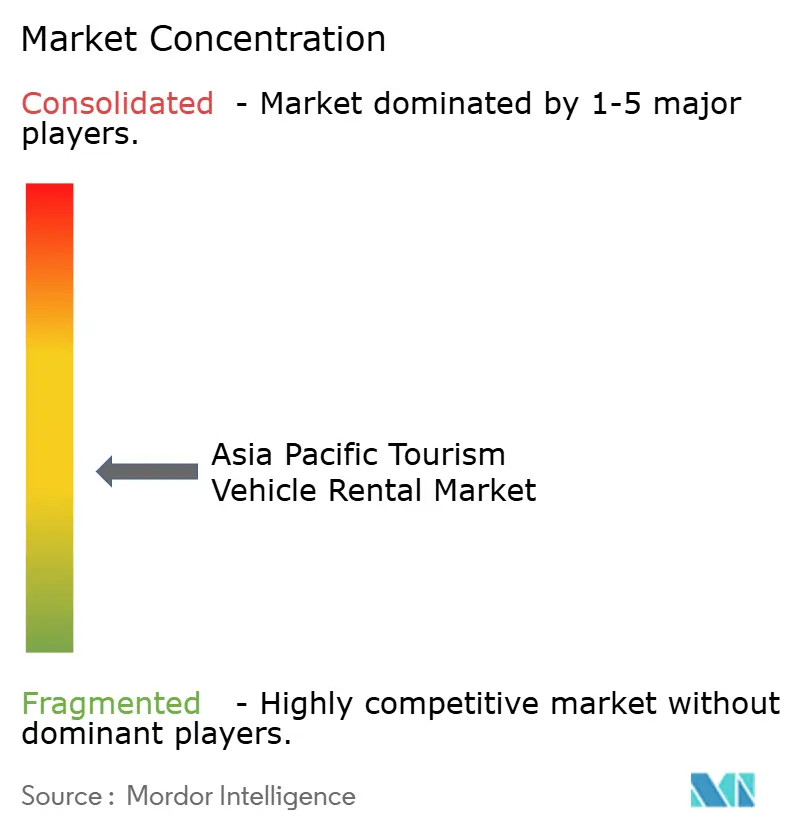
| Market Concentration | Medium |
Major Players *Disclaimer: Major Players sorted in no particular order Image © Mordor Intelligence. Reuse requires attribution under CC BY 4.0. | |
Asia Pacific Tourism Vehicle Rental Market Analysis by Mordor Intelligence
The Asia Pacific Tourism Vehicle Rental Market size is estimated at USD 43.17 billion in 2025, and is expected to reach USD 57.01 billion by 2030, at a CAGR of 5.71% during the forecast period (2025-2030). Surging cross-border travel, and the rapid return of Chinese outbound journeys are restoring vehicle demand to two-thirds of pre-pandemic levels. Recovery momentum is reinforced by super-app penetration, an expanding middle class that favors premium road trips, and policy measures such as Japan’s Tourism Nation Promotion Basic Plan that channel spending into local mobility services.
Key Report Takeaways
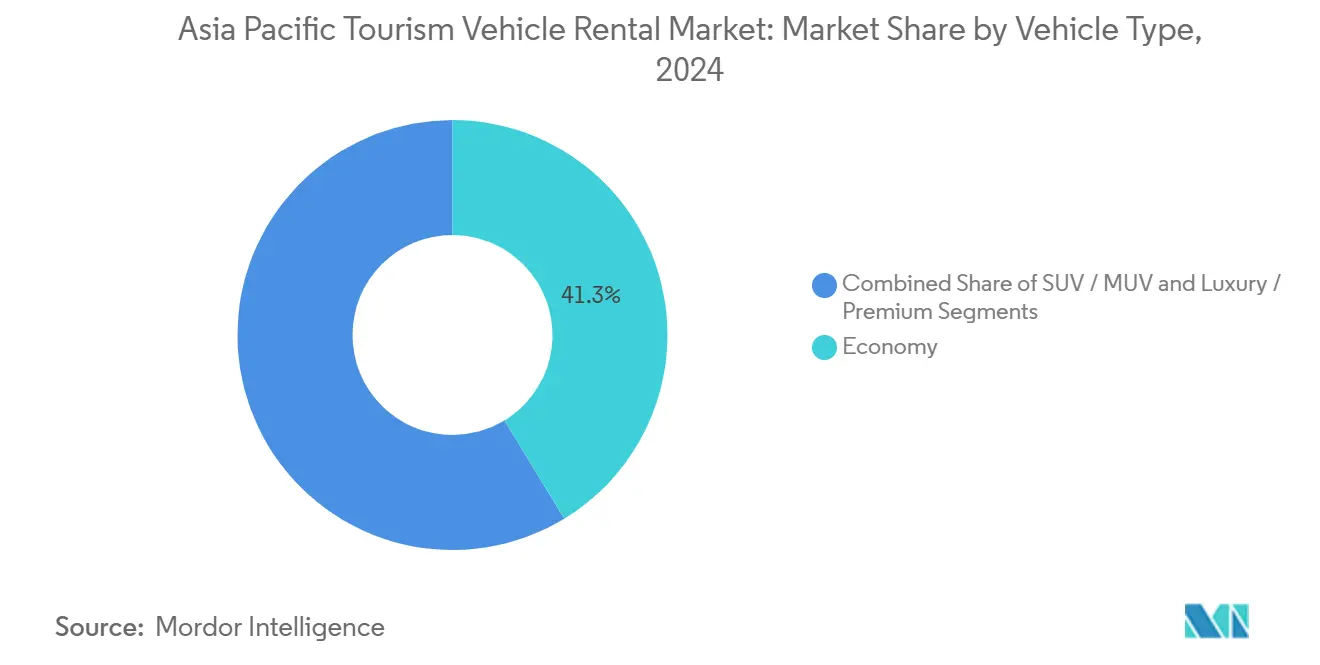
- By vehicle type, economy models led with 41.27% of the Asia Pacific tourism vehicle rental market share in 2024, while SUV/MUV categories are tracking the quickest expansion at a 6.13% CAGR to 2030.
- By booking mode, online channels captured 64.15% of revenue in 2024; mobile-first adoption is propelling this segment at a 5.85% CAGR through 2030.
- By end user, self-drive formats commanded 71.29% of demand in 2024, whereas agency-chauffeured services grow slower but retain relevance among high-end travelers, it also grows at a robust CAGR of 5.41% through 2030.
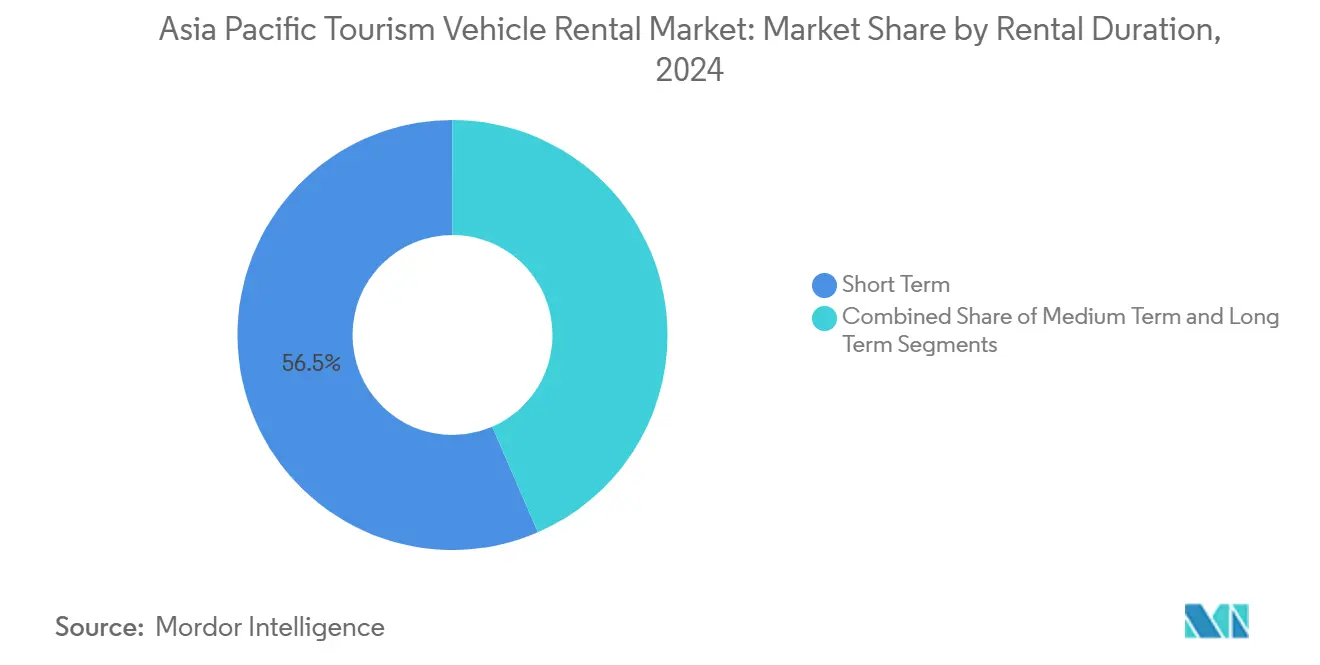
- By rental duration, short-term contracts (Less than or equal to 7 days) accounted for 56.47% of the Asia Pacific tourism vehicle rental market size in 2024; long-term rentals are accelerating at 5.57% CAGR as digital-nomad visas gain traction.
- By service channel, off-airport outlets held 58.34% share of the Asia Pacific tourism vehicle rental market in 2024 and are advancing at a 5.93% CAGR as pickup points migrate to city hubs and resort clusters.
- By country, China controlled 43.28% of regional revenue in 2024, while India delivers the fastest growth at 5.77% CAGR, supported by surging domestic leisure demand.
Asia Pacific Tourism Vehicle Rental Market Trends and Insights
Drivers Impact Analysis
| Driver | (~) % Impact on CAGR Forecast | Geographic Relevance | Impact Timeline |
|---|---|---|---|
| Rebound of Inbound and Domestic Tourism | +1.8% | China, Japan, Thailand | Medium term (2-4 years) |
| Mobile OTA and Super-App Penetration | +1.2% | ASEAN core, spill-over to China and India | Short term (≤ 2 years) |
| Rising Middle-Class Road-Trip | +0.9% | China, India, Southeast Asia emerging markets | Long term (≥ 4 years) |
| Mobility-Pass Bundles Via Super-Apps | +0.6% | Urban centers in Indonesia, Singapore, Thailand | Short term (≤ 2 years) |
| ASEAN Digital Licence Interoperability | +0.4% | ASEAN member states, cross-border corridors | Medium term (2-4 years) |
| Carbon-Credit Incentives | +0.3% | China, Japan, South Korea with EV mandates | Long term (≥ 4 years) |
| Source: Mordor Intelligence | |||
Rebound of inbound & domestic tourism
International arrivals are bouncing back sharply: Japan hosted more than 35 million visitors in 2024 and targets 60 million by 2030 under its Tourism Nation Promotion Basic Plan, anchoring fresh demand for regional car rentals.[1]“Visitor Statistics 2024,” Japan National Tourism Organization, jnto.go.jp Domestic excursions in China already exceed pre-COVID peaks, and the country intends to eclipse the United States as the world’s largest travel market by 2030. The widening appetite for “slow travel” and off-grid itineraries is driving self-drive and one-way rental uptake, particularly on secondary airport routes and heritage trails. As passengers look beyond standard group tours, the Asia Pacific tourism vehicle rental market benefits from diverse booking durations, including micro-vacations and multiday itineraries. This recovery is also sparking demand for larger vehicle classes that allow multigenerational families to travel together, fueling SUV/MUV penetration across the Asia Pacific tourism vehicle rental market.
Mobile OTA & super-app penetration
Mobile gross bookings in Northeast Asia are set to reach a new high in 2025, outpacing 2019 levels and consolidating online dominance.[2]“Annual Report 2024,” Grab Holdings, grab.com Super-apps such as Grab, Gojek, and Didi are embedding rental modules inside ride-hailing menus, eliminating app-switching friction and turning spontaneous trips into structured rentals. For traditional operators, the pivot from offline counters to digital funnels means repricing commission structures and integrating API-based inventory feeds in real time. In Thailand and Indonesia, super-app mobility passes that bundle rides, rentals, and last-mile delivery services are driving higher frequency among urban millennials. Consequently, the Asia Pacific tourism vehicle rental market is re-architecting distribution toward “anywhere pick-up” models, reshaping legacy return policies and backend fleet-management logic.
Rising middle-class road-trip culture
Growing disposable incomes and social-media promotion of panoramic drives are catalyzing a new generation of road enthusiasts in China and India. Weekend escapes to hill regions or coastal highways increasingly replace organized excursions, pushing SUV and crossover rentals into premium price bands. The trend dovetails with policy-backed highway expansion—India alone targets 100 km of new highways per day—lowering travel fatigue and improving route safety.[3]“Highway Development Status 2025,” Ministry of Road Transport & Highways India, morth.nic.in Rental firms are responding by adding infotainment-rich models, rear-seat entertainment packages, and multilingual navigation content to address diverse passenger cohorts. As a result, ticket sizes rise and ancillary revenue streams such as roof-rack add-ons, child seats, and Wi-Fi hotspots gain traction within the Asia Pacific tourism vehicle rental market.
ASEAN digital licence interoperability
A proposed common ASEAN driver-licence framework will allow visitors to rent across borders without redundant verification, smoothing Thailand-Malaysia-Singapore corridors. For operators, fewer documentary hurdles lower counter times and improve fleet rotation efficiency across adjoining depots. Leisure travelers benefit from multi-country itineraries—incentivizing longer bookings—and businesses gain cross-border flexibility for project deployments. The system is forecast to go live on priority tourist routes by 2027, improving utilization of dormant fleet inventories during shoulder seasons and bolstering the Asia Pacific tourism vehicle rental market.
Restraints Impact Analysis
| Restraint | (~) % Impact on CAGR Forecast | Geographic Relevance | Impact Timeline |
|---|---|---|---|
| Volatile Fuel Prices | -1.1% | Highest impact in fuel-import dependent markets like India | Short term (≤ 2 years) |
| Ride-Hailing and MaaS Substitution | -0.8% | Urban centers across China, Southeast Asia, India | Medium term (2-4 years) |
| Urban ICE-Free Zones | -0.6% | Tier-1 cities in China, Japan, South Korea | Medium term (2-4 years) |
| Semiconductor-Linked Fleet Shortages | -0.5% | Acute impact in vehicle import-dependent markets | Short term (≤ 2 years) |
| Source: Mordor Intelligence | |||
Volatile fuel prices
Fluctuating pump prices compress rental margins and stoke consumer price sensitivity, especially among leisure travelers who pre-pay bundles. Operators in markets importing refined products—such as the Philippines and South Korea—face currency depreciation that compounds procurement costs. Dynamic fuel surcharges can preserve yields but often erode price transparency on OTA listings, deterring bargain hunters. While EV uptake offers a strategic hedge, charging infrastructure gaps and higher acquisition costs limit immediate relief. The Asia Pacific tourism vehicle rental market therefore maintains cautious fleet renewal cycles, prioritizing fuel-efficient engine variants and hybrid powertrains where subsidies apply.
Ride-hailing & MaaS substitution
On-demand taxi fare elasticity and integrated public-transit passes nibble at short-duration rental demand in compact city cores. Super-apps now promote bundled airport transfers and hourly ride packages, directly overlapping with 1-day rental use cases. Academic studies tracking Uber’s expansion show muted displacement in long-haul tourism, yet notable cannibalization for intra-city leisure hops. Consequently, rental players refocus marketing on scenic trails, self-drive safaris, and rural circuits where ride-hailing coverage remains thin. Loyalty enhancements—free mileage tiers, late return grace periods, and digital-nomad subscription passes—are evolving to defend share inside the Asia Pacific tourism vehicle rental market.
Segment Analysis
By Vehicle Type: Premium Segments Drive Value Migration
In 2024 the economy class still supplied 41.27% of Asia Pacific tourism vehicle rental market share, but future mixes skew toward crossovers and seven-seat MPVs. SUV/MUV demand is rewriting fleet economics in the Asia Pacific tourism vehicle rental market. The segment’s 6.13% CAGR to 2030 outpaces the core economy class as middle-income families prioritize cabin comfort, luggage volume, and perceived safety. Japanese inbound arrivals frequently request hybrid SUVs to match long countryside drives, while Chinese millennials opt for MUVs on road trips to Hainan Island. At the high end, luxury marques like Lexus RX and BMW X5 lure corporate travelers in Australia who can offset fees via business expense claims.
Rental companies enjoy a dual benefit: higher average daily rates and lower per-kilometer depreciation due to stronger residual values of premium vehicles. Many operators therefore partner with automakers for fleet buy-back guarantees, protecting residuals against oversupply. Electric SUVs from BYD and MG are entering pilot fleets in Singapore and Shenzhen, signaling an EV twist in premiumization. With component shortages easing, firms are front-loading orders for 2026 models to hedge future supply risk.
Note: Segment shares of all individual segments available upon report purchase
Get Detailed Market Forecasts at the Most Granular Levels
Download PDF
By Booking Mode: Digital Channels Reshape Distribution
Online portals account for 64.15% of Asia Pacific tourism vehicle rental market share in 2024, converting discovery to booking within a few taps and capturing mobile-native travelers across South Korea and Taiwan, the online segment grows at a CAGR of 5.85% through 2030. Super-app integration means the Asia Pacific tourism vehicle rental market now surfaces inside ride-hailing dashboards, turning casual scrolling into rental intent. Offline counters, however, retain importance in regions such as Laos and Cambodia where tourists prefer assistance with local insurance options and language translation.
Comparison widgets that bundle fuel policies, collision-damage waivers, and loyalty perks are narrowing perceived price gaps between big brands and independents. As a corollary, franchise operators embrace channel-management software to synchronize rate parity and cancel penalties across GDS feeds, preventing revenue leakage.
By End User: Self-Drive Dominance Reflects Independence Trends
Self-drive formats command 71.29% Asia Pacific tourism vehicle rental market share, sustained by domestic tourists who know local traffic codes and relish schedule freedom. City-dwellers escaping to rural heritage sites often split driving duties among friends, reducing chauffeur need. For cross-border ASEAN corridors, interoperable e-toll systems and multilingual navigation simplify paperwork, further cementing self-drive appeal.
Chauffeur-driven rentals hold niche relevance, while growing at a robust CAGR of 5.41% through 2030. Luxury shopping sprees in Bangkok, embassy delegations in New Delhi, and first-time visitors wary of left-hand traffic in Australia. Operators diversify into dual offerings: self-drive by day, chauffeur by night, toggled via app. Loyalty tiers gifting free add-on drivers or in-car translation devices persuade repeat business travelers to maintain brand allegiance despite ride-hailing temptation, preserving profitability inside the Asia Pacific tourism vehicle rental industry’s service matrix.
By Rental Duration: Long-Term Growth Signals Structural Shifts
Short-term contracts retain 56.47%, the highest share of Asia Pacific tourism vehicle rental market due to weekend jaunts and week-long family vacations, yet their growth decelerates as consumers test hybrid travel combining leisure and remote assignments. Long-term (More than 30-day) agreements, clock the fastest 5.57% CAGR through 2030 amid remote work-enabled “workation” stays. Digital-nomad visas in Thailand and Malaysia, coupled with coworking resort packages, stimulate monthly rentals that incorporate multiple extensions without fresh paperwork.
Leasing-style products with bundled maintenance, insurance, and Wi-Fi entice long-stay customers who hesitate to buy a car abroad. Operators exploit the lower churn rate by reallocating underutilized city-fleet sedans to long-stay coastal hubs during monsoon off-season. Fleet planners now incorporate advanced telematics for preventive maintenance, ensuring vehicles endure prolonged use cycles without disruptive downtime.
Note: Segment shares of all individual segments available upon report purchase
Get Detailed Market Forecasts at the Most Granular Levels
Download PDF
By Service Channel: Off-Airport Expansion Reflects Urban Integration
Off-airport depots - city hotels, railway stations, shopping malls hold 58.34% share of Asia Pacific tourism vehicle rental market and outpace on-airport growth at 5.93% CAGR. Urban pickup points solve last-mile friction for domestic travelers arriving by high-speed rail, especially across China’s 45,000 km HSR network. In Thailand, Enterprise’s 2024 launch of 10 new off-airport counters in Phuket and Chiang Mai attests to the value of tourist-hub proximity. These outlets consistently post higher ancillary-product attachment rates, such as GPS rentals, due to casual footfall from adjacent attractions.
On-airport sites, conversely, maintain premium pricing and priority booking advantages for intercontinental arrivals with time-sensitive itineraries. Airport authorities are tightening concession frameworks, pressuring operators toward electric fleets and contactless kiosks. The coexistence of both channels ensures network density, bolstering resilience to traffic seasonality in the Asia Pacific tourism vehicle rental market. Looking ahead, peer-to-peer car-share partnerships inside parking garages may blur the line between traditional off-airport counters and community fleets.
Geography Analysis
China anchors the Asia Pacific tourism vehicle rental market with 43.28% revenue in 2024 and continues to refine tech-driven fleet management, including pilot autonomous rental pods for scenic zones in Hainan. Domestic road-trip culture is swelling as Tier-2 cities advertise self-drive coastal circuits, and EV-only tourist islands such as Wuzhizhou stimulate demand for electric SUV rentals. Zuzuche’s overseas recovery to more than half of pre-COVID levels underscores Chinese appetite for outbound rentals, especially in Japan and Australia.
India, expanding at 5.77% CAGR, is propelled by expressway construction and smartphone ticketing ecosystems that reduce booking friction. Despite Zoomcar’s Q1 2024 revenue dip, user sessions rose more than 10% after introducing gamified loyalty points, hinting at monetization upside once financing costs stabilize. Federal recognition of digital-nomad visas could elongate average rental durations and catalyze fleet upgrades from hatchbacks to compact SUVs.
Mature destinations includes Japan, Australia, New Zealand, and South Korea, deliver steady high-yield bookings supported by inbound traffic rebounds and corporate travel. Japan’s short-term rental segment jumped almost two fifth in 2023, driven by remote-work visas and extended stays in Kyoto and Okinawa. Southeast Asia benefits from ASEAN tourism integration, as Indonesia, Singapore, and Thailand register a massive year-on-year rise in arrivals, lifting demand across budget and premium tiers. Together these dynamics pluralize revenue channels, reinforcing resilience within the Asia Pacific tourism vehicle rental market.
Competitive Landscape
Global majors includes Hertz, Avis Budget Group, Enterprise Mobility, leverage scale to negotiate bulk OEM purchasing and deploy AI-powered demand forecasting. Avis operated about more than 690,500 vehicles and handled around 39 million rentals in 2023, generating more than USD 10 billion revenue, a sizable share emerging from its Asia-Pacific unit. Technology remains a differentiator: Enterprise’s Thai franchise tapped cloud-based telematics in 2024 and trimmed unplanned maintenance while boosting utilization.
Regional specialists—CAR Inc., eHi Car Services, and Indian peer Zoomcar—defend market niches via localized booking funnels, vernacular call centers, and flexible subscription passes. CAR Inc. pivots toward premium electric SUVs targeting affluent tourists venturing to China’s western provinces, while eHi amplifies corporate leasing to hedge inbound volatility. Start-ups integrating blockchain-backed carbon-credit tracking bolster green credentials and secure municipal permits for city-center curbside pickup.
Cross-industry entrants intensify rivalry. Grab and Gojek bundle rentals inside super-app ecosystems, driving on-demand conversions but also cannibalizing short-haul rentals. Chinese EV manufacturers such as BYD and NIO test “battery-as-a-service” partnerships with fleet operators, lowering up-front costs and aiding EV uptake. In response, traditional firms experiment with revenue-share alliances—Hertz cooperates with Uber for EV ride delivery across Australia—creating hybrid mobility models that expand value pools within the Asia Pacific tourism vehicle rental industry.
Asia Pacific Tourism Vehicle Rental Industry Leaders
eHi Car Service Limited
Zoomcar India Pvt. Ltd.
Hertz Corporation
Beijing China Auto Rental (CAR Inc.)
Avis Budget Group
- *Disclaimer: Major Players sorted in no particular order
Need More Details on Market Players and Competitors?
Download PDF
Recent Industry Developments
- March 2025: Japan’s Prime Minister Ishiba unveiled the Tourism Nation Promotion Basic Plan targeting 60 million visitors by 2030 and JPY 15 trillion (USD 100 billion) spend, a catalyst for mobility-service expansion.
- October 2024: Enterprise Mobility opened 10 Enterprise, National, and Alamo locations in Thailand via Thai Rent a Car, reinforcing coverage across Bangkok and Phuket.
Research Methodology Framework and Report Scope
Market Definitions and Key Coverage
According to Mordor Intelligence, the Asia-Pacific tourism vehicle rental market covers all short-term (hourly to monthly) hires of passenger cars and multipurpose vehicles that are booked by leisure travelers for self-drive or chauffeur services across airports, rail hubs, city centers, and digital platforms.
Vehicles borrowed exclusively for daily commuting, commercial freight, or long-term corporate leasing are outside this scope.
Segmentation Overview
- By Vehicle Type
- Economy
- SUV / MUV
- Luxury / Premium
- By Booking Mode
- Online
- Offline
- By End User
- Self-drive (Leisure & Business)
- Chauffeur / Rental-agency driven
- By Rental Duration
- Short-term (Less than or equal to 7 days)
- Medium-term (8 to 30 days)
- Long-term (More than 30 days)
- By Service Channel
- On-airport
- Off-airport
- By Country
- China
- India
- Japan
- Australia & New Zealand
- South Korea
- Indonesia
- Singapore
- Thailand
- Rest of Asia Pacific
Detailed Research Methodology and Data Validation
Primary Research
We interview fleet managers, OTA mobility leads, regional tourism officers, and rental kiosk supervisors across China, India, Japan, Australia, and Thailand.
These conversations validate utilization rates, typical rental lengths, online booking penetration, and average daily rates that are not disclosed in public filings.
Desk Research
Our analysts start with tri-angulated desk work.
Key inputs come from open datasets issued by UNWTO visitor arrivals, national transport ministries, and customs trade codes that signal rental fleet imports, complemented by tourism boards in China, Japan, India, and ASEAN, who release domestic road-trip statistics.
We also review annual filings of listed rental operators, airport passenger traffic logs, and regional auto associations for new-vehicle registrations and fleet age.
Subscription databases such as D&B Hoovers for company financials and Dow Jones Factiva for deal news help us benchmark operator revenues and fleet additions.
This list is illustrative; many other public and paid sources are consulted throughout the build.
Market-Sizing & Forecasting
A top-down demand pool constructed from inbound and domestic tourist nights, average party size, and road-trip share sets the ceiling.
We then test this with bottom-up cross-checks such as sampled fleet counts and blended daily rates observed during primary calls, adjusting for utilization, seasonality, and airport/off-airport mix.
Key model variables include tourist arrivals, disposable income per capita, smartphone booking share, EV share within rental fleets, and regulated self-drive age limits.
A multivariate regression with ARIMA error correction projects these drivers forward to 2030 and flags three growth scenarios; analysts align on the most probable path through consensus interviews.
Data Validation & Update Cycle
Every draft model passes variance checks against historic fleet growth and operator revenue trails.
Anomalies trigger re-contact of sources before managerial sign-off.
We refresh the dataset annually and push interim updates when visa policies, fuel taxes, or pandemic advisories materially shift travel demand.
Why Mordor's Asia Pacific Tourism Vehicle Rental Baseline Commands Confidence
Published estimates often differ because firms pick varying scopes, currencies, and refresh cadences before converting figures.
Key gap drivers include whether business rentals are blended with leisure, if motorcycle or van categories sneak into totals, how average daily rates are inflated, and how frequently models are rolled forward when exchange rates swing.
Benchmark comparison
| Market Size | Anonymized source | Primary gap driver |
|---|---|---|
| USD 43.17 B (2025) | Mordor Intelligence | - |
| USD 42.13 B (2024) | Regional Consultancy A | Adds airport-only bookings and omits peer-to-peer fleets, giving a narrower view |
| USD 35.80 B (2024) | Industry Journal B | Excludes premium SUVs, applies fixed FX rate from early 2023, and updates biennially |
In sum, Mordor's disciplined scope selection, balanced top-down/bottom-up validation, and yearly refresh yield a transparent, decision-ready baseline for stakeholders planning fleet expansion, pricing, or partnership moves in Asia-Pacific tourism mobility.
Need A Different Region or Segment?
Customize Now
Key Questions Answered in the Report
What is the current size of the Asia Pacific tourism vehicle rental market?
The Asia Pacific tourism vehicle rental market size is USD 43.17 billion in 2025 and is projected to grow to USD 57.01 billion by 2030.
Which country holds the largest share of the Asia Pacific tourism vehicle rental market?
China leads with 43.28% market share in 2024, powered by its vast domestic tourism base and a quick rebound in international arrivals.
Why are SUV/MUV rentals growing faster than economy cars?
Middle-class travelers increasingly value comfort and safety on family road trips, pushing SUV/MUV demand to a 6.13% CAGR through 2030.
How is digital booking influencing the Asia Pacific tourism vehicle rental industry?
Online and super-app channels already account for 64.15% of bookings and are set to increase further as mobile OTA penetration deepens across ASEAN and Northeast Asia.
What role do long-term rentals play in market growth?
Long-term (More than 30-day) rentals are the fastest-expanding duration segment at 5.57% CAGR, driven by digital-nomad visas and extended remote-work stays in destinations such as Thailand and Malaysia.
How are rental companies addressing fuel-price volatility?
Operators deploy dynamic surcharges, introduce fuel-efficient or electric fleets, and adopt telematics-based route optimization to mitigate margin pressure amid fluctuating fuel costs.


