
Market Overview
| Study Period | 2020 - 2031 |
|---|---|
| Forecast Data Period | 2026 - 2031 |
| Base Year Market Size (2025) | USD 124.85 Billion |
| Market Size (2026) | USD 131.13 Billion |
| Market Size (2031) | USD 167.59 Billion |
| Growth Rate (2026 - 2031) | 5.03 % |
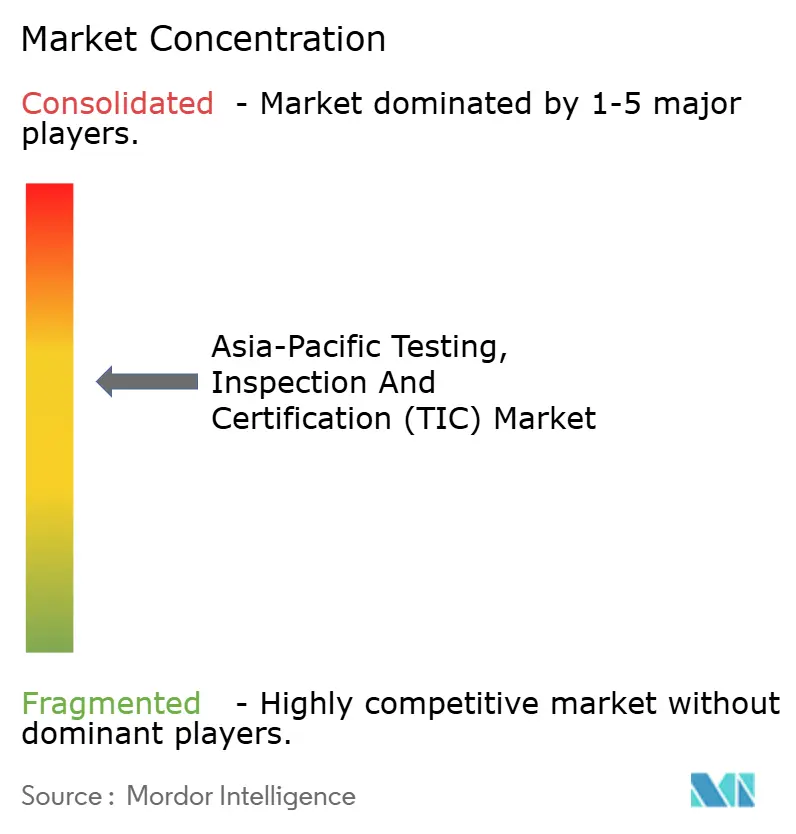
| Market Concentration | Medium |
Major Players
*Disclaimer: Major Players sorted in no particular order Image © Mordor Intelligence. Reuse requires attribution under CC BY 4.0. |
|
Asia-Pacific Testing, Inspection and Certification (TIC) Market Analysis by Mordor Intelligence
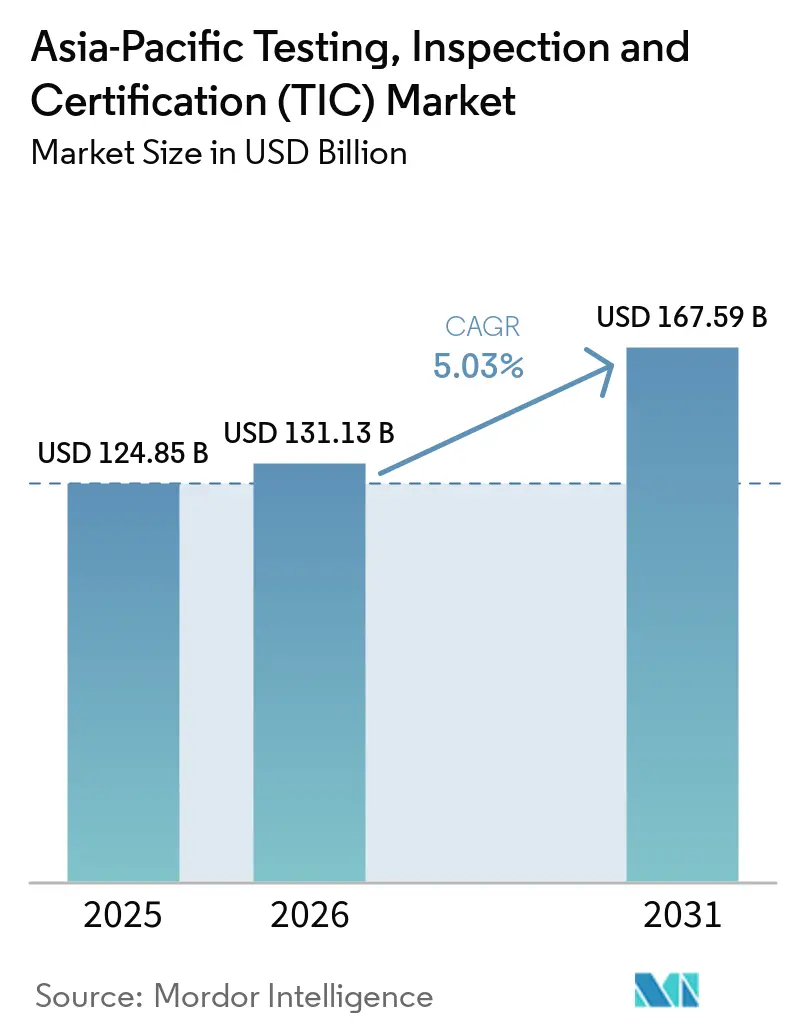
The Asia-Pacific TIC market size was valued at USD 124.85 billion in 2025 and estimated to grow from USD 131.13 billion in 2026 to reach USD 167.59 billion by 2031, at a CAGR of 5.03% during the forecast period (2026-2031). Expanding cross-border manufacturing networks, fast-tracking of sustainability rules, and accelerated digital adoption across factories, laboratories, and infrastructure programs collectively sustain demand for testing, inspection, and certification services. The continual rollout of electric-vehicle battery safety rules, medical-device cybersecurity labels, and hydrogen-fuel quality standards adds fresh compliance layers that favor providers able to mobilize multidisciplinary expertise across multiple jurisdictions. Outsourced providers strengthen their edge as regulatory duties outstrip in-house capabilities, while remote inspection platforms gain traction as enterprises pursue cost-effective coverage in locked-down or hard-to-reach sites. Certification, in particular, draws attention as companies seek independent assurance for ESG disclosures and supply-chain traceability.
Key Report Takeaways
- By service type, testing led with 57.90% revenue share of the Asia-Pacific TIC market in 2025; certification is forecast to grow at a 5.62% CAGR to 2031.
- By sourcing type, outsourced services captured a 63.10% share of the Asia-Pacific TIC market in 2025 and are projected to expand at a 5.32% CAGR through 2031.
- By industry vertical, consumer goods and retail held 22.60% of revenue of the Asia-Pacific TIC market in 2025, while food, agriculture, and beverage are advancing at a 6.05% CAGR to 2031.
- By mode of service delivery, on-site services retained a 52.05% share of the Asia-Pacific TIC market in 2025; remote and digital inspection is scaling fastest at a 5.86% CAGR to 2031.
- By country, China commanded 40.25% of the regional revenue of the Asia-Pacific TIC market in 2025, whereas India registered the fastest trajectory at a 6.22% CAGR through 2031.
Note: Market size and forecast figures in this report are generated using Mordor Intelligence’s proprietary estimation framework, updated with the latest available data and insights as of 2026.
Asia-Pacific Testing, Inspection and Certification (TIC) Market Trends and Insights
Drivers Impact Analysis*
| Driver | (~) % Impact on CAGR Forecast | Geographic Relevance | Impact Timeline |
|---|---|---|---|
| Supply-chain complexity | +1.2% | China, ASEAN export hubs | Medium term (2-4 years) |
| Sustainability and ESG audits | +0.9% | Singapore, Hong Kong, Australia | Short term (≤ 2 years) |
| EV and battery safety harmonization | +0.8% | China, Japan, South Korea, ASEAN | Medium term (2-4 years) |
| Real-time digital-health compliance | +0.7% | Singapore, Japan, Australia | Short term (≤ 2 years) |
| Green hydrogen pilot scaling | +0.5% | Australia, Japan | Long term (≥ 4 years) |
| AI-driven predictive maintenance | +0.4% | Advanced manufacturing hubs | Long term (≥ 4 years) |
| Source: Mordor Intelligence | |||
Trade-centric supply-chain complexity drives regional TIC demand
Asia sits at the heart of global manufacturing and now supports intricate, multi-jurisdictional supply chains that span hundreds of tier-1 and tier-2 suppliers. The ASEAN digital economy alone is targeting USD 1 trillion by 2030, a scale that intensifies conformity-assessment needs from chemicals to consumer electronics.[1] TIC firms respond by expanding regional footprints. QIMA signed an MoU with Korea Testing and Research Institute to deepen cross-border quality control, while SGS launched its SMART cloud platform to provide real-time supply-chain oversight. The forthcoming ASEAN Digital Economy Framework Agreement is expected to harmonize cross-border data rules and further lift demand for unified testing and certification services across member states.
ESG and sustainability audits accelerate across regional markets
Ninety-eight of the region’s 110 largest listed companies now publish sustainability disclosures, compared with fewer than half a decade earlier, reflecting tightened listing-rule requirements and rising investor scrutiny.[2] Australia’s AASB S2 climate rules mandate externally assured emissions statements from 2025, and Singapore will require limited assurance of Scope 1 and 2 data by fiscal year 2027. The global release of ISSA 5000 in late 2024 established a baseline for sustainability assurance, giving providers a consistent methodology to serve clients operating across multiple frameworks. Regional sustainable-bond issuance jumped 40% year-on-year in 2023, generating additional demand for pre- and post-issuance verifications and life-cycle carbon evaluations.
EV battery safety regulations drive harmonization and testing demand
China’s GB 38031 update, effective July 2026, compels batteries to withstand two hours of thermal-runaway fire without explosion, alongside new impact and charge-cycle tests. Malaysia’s MIROS issued three battery-electric safety codes that ASEAN members are already referencing, while Vietnam circulated draft lithium-battery rules that mirror United Nations transport guidelines. The expanded CCC scope and harder EV battery rules guarantee large recurring volumes, keeping the China testing inspection and certification market size for Testing ahead, while Certification gains strategic relevance as corporations face ESG disclosure mandates. The EU Battery Regulation further raises the bar for Asia-Pacific exporters by imposing digital passports and recycled-content disclosure from 2027. Together, these measures push OEMs to engage accredited labs early in the design process to avoid certification bottlenecks.
Digital-health compliance creates real-time testing opportunities
The Medical Device Single Audit Program allows one audit to satisfy five major markets, but region-specific add-ons persist for example, Singapore’s Cybersecurity Labelling Scheme for connected medical devices and Malaysia’s reinstated conformity-assessment for COVID-19 test kits. Rapid rulemaking was evident when Thailand cleared Mpox test-kit registrations within weeks of the outbreak. Governments are upgrading lab capacity and accreditation programs, opening doors for private TIC firms to form public-private partnerships that expand compliant testing networks.
Restraints Impact Analysis*
| Restraint | (~) % Impact on CAGR Forecast | Geographic Relevance | Impact Timeline |
|---|---|---|---|
| Shortage of advanced semiconductor labs | −0.8% | Taiwan, South Korea, Singapore | Medium term (2-4 years) |
| Fragmented national accreditation regimes | −0.6% | Emerging ASEAN economies | Long term (≥ 4 years) |
| Low TIC spend per capita | −0.4% | Vietnam, Cambodia, Laos | Medium term (2-4 years) |
| Cyber-security concerns on digital inspection | −0.3% | Region-wide critical infrastructure | Short term (≤ 2 years) |
| Source: Mordor Intelligence | |||
Advanced semiconductor testing capacity constraints limit growth
Asia hosts more than 80% of global assembly, test, and packaging capacity, yet shortages of skilled labor and EUV-ready test benches slow the expansion of next-generation fabrication lines. India alone needs an additional 250,000 engineers for its nascent foundry push, while Vietnam currently fulfils only one-fifth of the required semiconductor talent.[3] Fan-out wafer-level packaging and 3D stack inspections demand expensive, high-precision gear that smaller labs struggle to finance, elongating certification lead times and raising costs for chipmakers.
Cyber-security vulnerabilities challenge digital inspection adoption
Forty-five percent of Asia-Pacific manufacturers cite cyber-security risks as the main hurdle when shifting to remote inspection, exceeding the global average of 39%. Capability gaps remain: 68% report insufficient OT security skills, and 56% lack budgets for comprehensive protection. Remote inspection platforms must therefore embed end-to-end encryption, tamper-proof evidence logs, and secure video streaming to gain regulator acceptance. Applus+ has begun layering blockchain verification onto its remote-inspection packages to address these concerns.
*Our forecasts treat driver/restraint impacts as directional, not additive. The impact forecasts reflect baseline growth, mix effects, and variable interactions.
Segment Analysis
By Service Type: Dominant Testing, Accelerating Certification
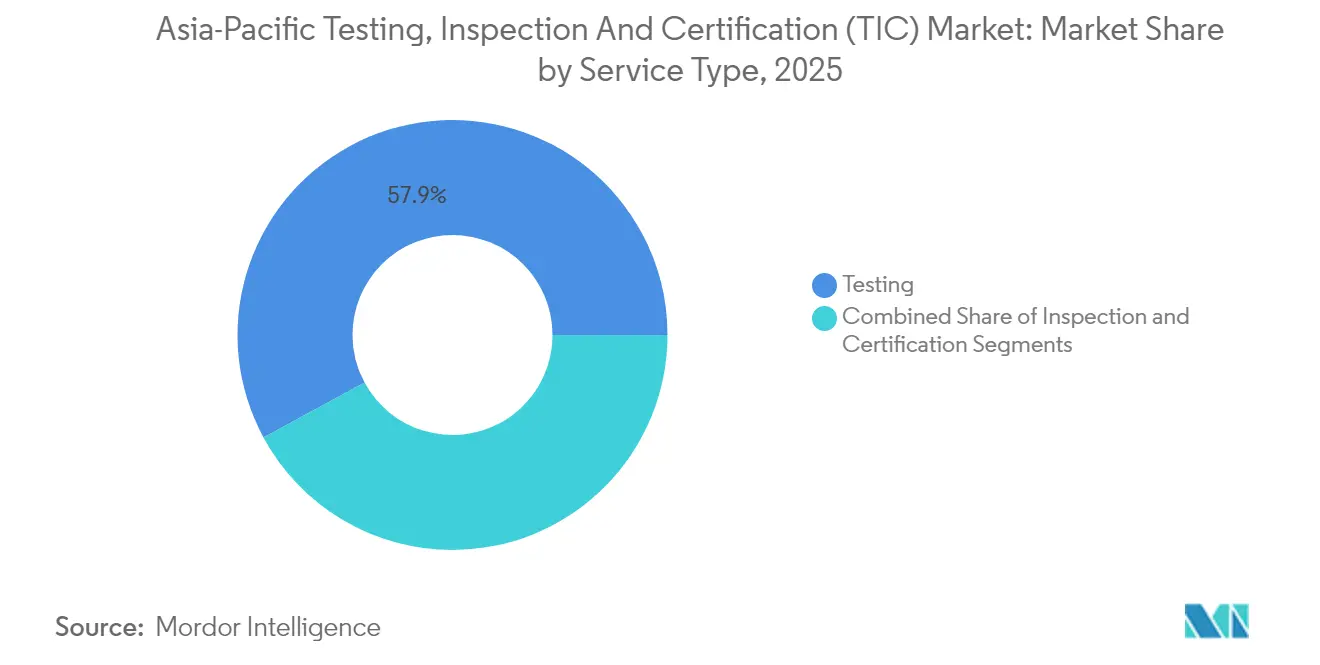
Testing held 57.90% of the Asia-Pacific TIC market share in 2025, as product safety, quality control, and regulatory compliance underpin every manufacturing supply chain. Heavy semiconductor exposure amplifies volumes because over 80% of global assembly and test work is carried out within the region, requiring high-frequency yield monitoring and failure-analysis routines. Asia-Pacific TIC market size attributed to testing is projected to grow steadily as fabs migrate to sub-5 nm nodes that raise complexity and require new fault-isolation protocols.
Certification is the fastest-advancing slice at a 5.62% CAGR through 2031, propelled by mandatory ESG assurance, voluntary carbon-credit verification, and new hydrogen-fuel quality marks. Leon Inspection’s overseas revenue climbed 21.3% in 2024 after it deployed AI-enabled spectral analysis and blockchain-backed data chains to speed CE-mark issuance for exporters. Providers investing in digital certificate vaults and auto-validation tools are positioned to capture share as governments pivot from self-declaration to third-party assurance.

By Sourcing Type: Outsourced Services Capture Strategic Spend
Outsourced providers controlled 63.10% of the Asia-Pacific TIC market size in 2025 and are forecast to expand at a 5.32% CAGR. Moving compliance tasks to specialists allows OEMs to focus resources on design and distribution while accessing deep domain expertise, multi-country accreditation, and scalable lab networks. SGS’s SMART platform integrates scheduling, document management, and analytics across thousands of factories, illustrating how outsourced partners enhance transparency to win new contracts.
In-house labs remain relevant in sectors where intellectual property is sensitive or continuous-process testing is embedded in the production line, such as pharmaceutical API analysis or petrochemical feedstock monitoring. Yet even these operators increasingly outsource niche tests such as recycled-content proof for EU battery exports when external labs can supply accredited results faster and at lower cost.
By Industry Vertical: Consumer Goods Lead, Food and Agriculture Surge
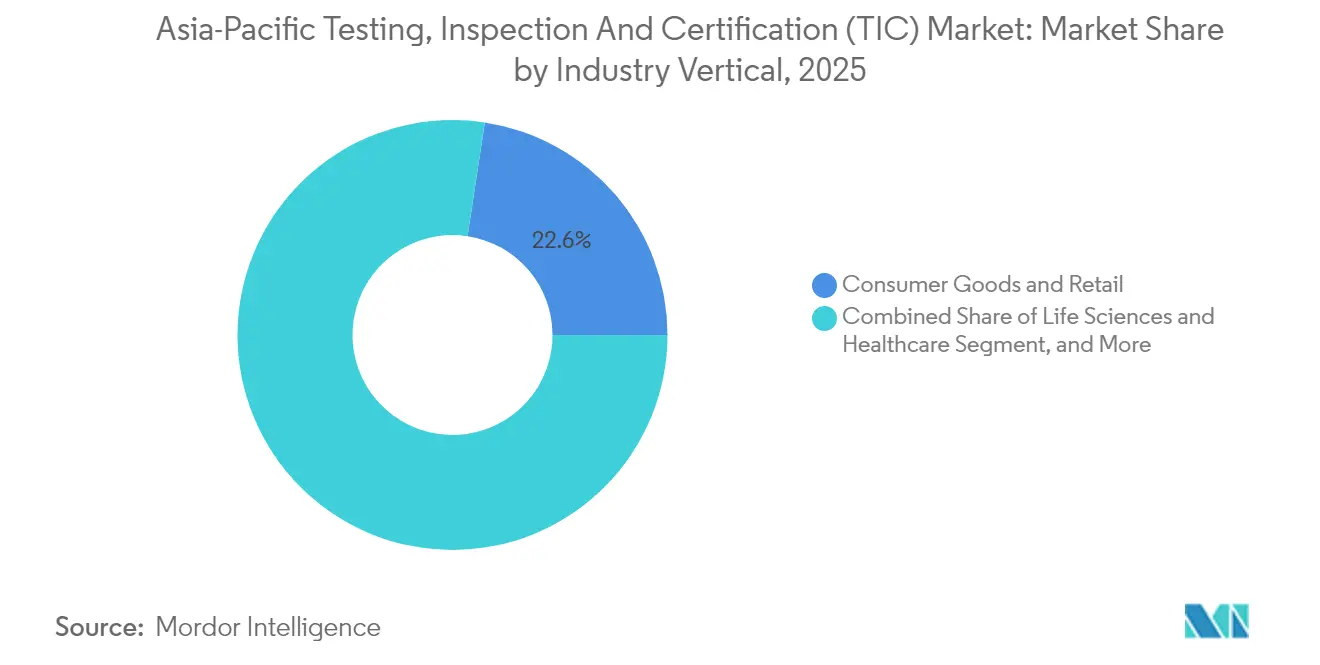
Consumer goods and retail claimed 22.60% of regional revenue in 2025, supported by long-established export compliance routines for toys, apparel, and homeware. SGS’s new furniture-testing center in Indonesia highlights continuing investment to serve this mature segment. Asia-Pacific TIC market size for consumer goods is set to grow alongside nearshoring trends that diversify manufacturing from coastal China to Indonesia and Vietnam.
Food, agriculture, and beverage sectors register the most rapid expansion at 6.05% CAGR as regulators tighten contaminant thresholds and traceability rules from farm to fork. Singapore’s Laboratory Recognition Programme now requires ISO/IEC 17025 accreditation before labs can carry out official food-safety tests, catalyzing private-lab upgrades and new market entrants. Exporters of seafood, fruit, and infant formula across ASEAN increasingly rely on accredited third parties for pesticide, heavy-metal, and microbial screens to satisfy European Union and United States import checks.
By Mode of Service Delivery: On-Site Persists, Remote Rises
On-site services retained a 52.05% share in 2025 because many infrastructure, energy, and heavy-equipment inspections still demand physical assessment of weld integrity, vibration levels, or hazardous-area compliance. Regulatory bodies often insist on witnessing destructive tests or reviewing calibration records in person. Asia-Pacific TIC market size for on-site inspection is forecast to grow modestly, given the continuing rollout of power-grid upgrades and rail projects.
Remote and digital inspections show the fastest momentum at 5.86% CAGR. Asia Quality Focus offers real-time video streams, standardized evidence collection, and immediate defect tagging that reduce travel time and carbon footprint while meeting buyer expectations for speed. Hybrid models are emerging, where initial document reviews and virtual walkthroughs precede targeted on-site sampling, optimizing resource allocation.
Geography Analysis
China led the Asia-Pacific TIC market with 40.25% revenue share in 2025, fueled by large-scale electronics, EV, and renewable-energy manufacturing. Domestic authorities actively standardize rules such as GB 38031 for batteries and fund metrology institutes, reinforcing demand for local conformity-assessment services. Leon Inspection reported HKD 1,263.1 million revenue in 2024, with almost 45% generated overseas, underscoring its rising global influence.
India ranks as the fastest-growing geography at a 6.22% CAGR through 2031. Government schemes, including the Performance-Linked Incentive for electronics and the Medical-Device Parks program, incentivize localized production and thereby multiply testing volumes. Nevertheless, a widening engineering talent gap and limited advanced-node semiconductor labs may cap near-term scaling until capacity catches up.
Japan, South Korea, and Australia contribute sizable revenue backed by technology leadership and proactive sustainability agendas. Japan’s Hydrogen Society Promotion Act introduces a detailed certification pipeline for low-carbon hydrogen and ammonia, demanding robust sampling, analytics, and chain-of-custody verification. Australia’s green-hydrogen pilots, often co-financed by Japanese investors, create cross-border opportunities for providers offering dual-jurisdiction accreditation.
ASEAN collectively registers steady growth as its digital economy targets USD 1 trillion gross merchandise value, translating into higher telecom-equipment type approvals, cybersecurity labelling, and e-commerce product-quality checks. Mutual-recognition initiatives under the Asia Pacific Accreditation Cooperation gradually smooth inter-country acceptance of reports, reducing redundant testing and encouraging providers to set up regional hubs.
Regulatory Landscape
Regulation across Asia-Pacific TIC demand is shaped by national telecom and digital-trust rules layered over regional mutual-recognition pathways. India updated its Mandatory Testing and Certification of Telecom Equipment (MTCTE) procedure in April 2024, tightening how equipment is tested and certified before sale and network use. China’s Ministry of Industry and Information Technology (MIIT) maintained Network Access License (NAL) requirements for critical telecommunications equipment under updated administrative measures covering newer categories such as satellite internet and virtualized devices.
In 2026, security and market-conduct provisions gained visibility in communications frameworks, which increased compliance workloads for manufacturers and service providers. Singapore advanced the Info-communications Media Development Authority (Amendment) Act 2026 in April 2026. Malaysia’s Dewan Rakyat passed the Communications and Multimedia (Amendment) Bill 2026 in July 2026, adding security safeguards and a Universal Service Provision (USP) initiative overseen by the National Security Council. Cross-border acceptance of conformity results continues to be supported by the APEC TEL Mutual Recognition Arrangement (MRA), which TIC firms use to reduce duplicative testing for participating economies while still meeting country-specific add-ons.
Value Chain Analysis
The Asia-Pacific TIC value chain starts with standards and scheme owners (regulators and accreditation bodies) that define test methods, audit protocols, and certification criteria. Execution follows through laboratory and inspection services, which then produce reports or certificates used for market access and buyer qualification. In the region, demand-side customers include electronics and telecom OEMs, component suppliers, contract manufacturers, cloud and data-center operators, and infrastructure owners. Outsourced providers held 63.10% of TIC spending in 2025 as enterprises sought multi-country coverage and faster turnaround.
Service delivery typically moves from pre-compliance advisory and sampling plans to laboratory testing (EMC, safety, reliability), on-site or remote inspections, and certification with ongoing surveillance. Major TIC networks, including SGS, Intertek, Bureau Veritas, and TUV SUD, sit at the center by aggregating accredited labs, field auditors, and digital platforms for scheduling, evidence capture, and certificate management. Key friction points include uneven availability of advanced labs for high-end semiconductor and connectivity reliability work, along with fragmented national accreditation regimes in parts of ASEAN, which can trigger retesting and extend lead times. This raises the value of providers that can coordinate mutual-recognition pathways and multi-jurisdiction documentation.
Competitive Landscape
The Asia-Pacific TIC market is moderately concentrated. SGS, Bureau Veritas, and Intertek operate extensive lab networks and multivertical service portfolios, together accounting for 28% of regional revenue in 2024. The February 2025 termination of merger talks between SGS and Bureau Veritas keeps the competitive field open, prompting both to accelerate standalone digital initiatives.[4] Intertek continues to expand ESG-assurance practices following heightened disclosure mandates.
Regional champions leverage local knowledge. China Leon Inspection integrates AI computer-vision systems into textile and footwear lines, shortening defect-detection cycles and differentiating on turnaround time. Japan’s JQA invests in hydrogen-quality analytics, while South Korea’s KTR builds 800V EV-battery test bays to align with upcoming UL and IEC standards. Technical depth and rapid accreditation across emerging categories, such as cyber-physical-system security certification, are becoming the primary differentiation levers.
White-space expansion is visible in advanced semiconductor reliability, recycled-content verification, and green-hydrogen passporting. EnerMech’s JV with TSI aims to combine mechanical-integrity engineering with core TIC services to supply large-scale LNG and hydrogen projects in Australia and Papua New Guinea. Partnerships that fuse engineering, software, and accreditation expertise are expected to proliferate as clients favor turnkey assurance covering complete asset life cycles.
Asia-Pacific Testing, Inspection and Certification (TIC) Industry Leaders
-
SGS SA
-
Bureau Veritas SA
-
Intertek Group plc
-
TÜV SÜD AG
-
TÜV Rheinland AG
- *Disclaimer: Major Players sorted in no particular order
Market Opportunities and Future Outlook
Higher-value digital-trust and cybersecurity assurance is a clear whitespace as connected devices, network virtualization, and data-driven operations push buyers toward third-party validation beyond basic safety and EMC. In Japan, TUV SUD was authorized in February 2025 by the Information-technology Promotion Agency (IPA) as a Testing Service Provider for the JC-STAR scheme, establishing an on-ramp for specialized security testing services that can be deployed across multinational device portfolios.
ASEAN-facing hub capacity and sustainability-linked verification are also creating new service lanes where certification incorporates measurable carbon metrics and digital asset records. In Singapore, the Economic Development Board highlighted TUV SUD’s inauguration of a S$100 million regional hub in March 2026 focused on sustainability and digital trust, reflecting investment in regional delivery infrastructure. In maritime and industrial infrastructure supply chains, PSA Singapore and Bureau Veritas announced a pilot in May 2026 for a Green Port Certified Expansion Joints program that embeds a carbon footprint threshold (<= 7.2 kg CO2e per linear metre) and digital twin integration. This expands TIC from compliance checks toward product-level carbon transparency and digital documentation that suppliers can use across procurement programs.
Recent Industry Developments
- June 2026: Intertek Group plc announced that its board agreed terms on a recommended cash acquisition of the entire issued share capital of Intertek by Isotope Bidco Limited. The transaction points to continued consolidation among top-tier TIC networks, with potential implications for pricing power, lab footprint rationalization, and investment capacity in digital assurance services across Asia-Pacific.
- March 2026: SGS completed the acquisition of Granite River Labs Services to strengthen its Digital Trust and Connectivity capabilities, including testing for high-speed wired data connections and related digital infrastructure needs. The deal expands SGS capacity in fast-growing connectivity validation areas that underpin data centers, devices, and network equipment supply chains in the region.
- December 2024: Bureau Veritas completed the acquisition of The APP Group in Australia, strengthening its Buildings and Infrastructure position in Asia-Pacific. The integration increases Bureau Veritas’s coverage in asset integrity, testing, and inspection work linked to infrastructure owners and public-sector projects, supporting broader end-to-end assurance offerings.
Research Methodology Framework and Report Scope
Market Definition and Coverage
We define the Asia-Pacific testing, inspection, and certification (TIC) market as third-party and in-house services used to verify products, materials, processes, and systems for quality, safety, and compliance, with revenue counted where the service is delivered across APAC.
Scope exclusions: We exclude pure consulting that does not include a test, inspection, audit, or certificate deliverable, along with internal quality work that is not priced as a TIC service.
Segmentation Overview
-
By Service Type
- Testing
- Inspection
- Certification
-
By Sourcing Type
- In-house
- Outsourced
-
By Industry Vertical
- Consumer Goods and Retail
- ICT and Telecom
- Automotive and Transportation
- Aerospace and Defense
- Oil, Gas and Petrochemicals
- Energy and Utilities
- Industrial Manufacturing and Machinery
- Chemicals and Materials
- Construction and Infrastructure
- Life Sciences and Healthcare
- Food, Agriculture and Beverage
- Other Industry Verticals (Environment, Sustainability, etc.)
-
By Mode of Service Delivery
- On-site
- Off-site / Laboratory
- Remote / Digital
-
By Country
- China
- Japan
- India
- South Korea
- ASEAN
- Rest of Asia-Pacific
Data Sources, Market Sizing, and Validation
Desk Research
Desk work starts by building a clear demand map for where TIC spend usually shows up in Asia-Pacific, and then aligning that map to measurable public signals. We leaned on official and open sources such as national standards bodies and accreditation council portals, customs and trade statistics, food and agriculture regulator notices, and transport safety and vehicle compliance guidelines published by governments.
To turn those signals into a usable sizing model, we also reviewed company annual reports and investor presentations, association updates, and reputable business press to understand service-mix shifts and end-user activity levels. Where available, we used paid subscriptions for company financials and news screening, plus a shipment-level import and export view to sanity-check trade-exposed verticals. These desk sources are illustrative only, and many other public references were used to collect data, cross-check assumptions, and clarify open questions.
Primary Interviews and Surveys
Primary interviews and structured surveys were used to pressure-test the model inputs that are hard to read from public data, such as typical pricing, outsourcing shares, and utilization swings across labs and inspection networks. We spoke with respondents across key end-user industries (including manufacturing, automotive, food, and infrastructure) and also with people involved in delivery and procurement, which helped us reconcile country-level differences across APAC before finalizing the totals.
Distribution of primary research fieldwork respondents
| Company type | Respondent position |
|---|---|
| Top tier: 27% | CXOs: 14% |
| Mid tier: 56% | Functional/Unit leaders: 38% |
| Smaller Players: 17% | Managers: 48% |
Market-Sizing & Forecasting
Our sizing starts with a top-down build where end-user activity pools are reconstructed, then filtered through compliance intensity and outsourcing penetration by country and sector. For Asia-Pacific TIC, this means linking demand to practical drivers such as export-oriented manufacturing throughput, regulatory testing cycles for food and consumer products, automotive homologation needs, and project inspection requirements in construction and infrastructure.
Those totals are then corroborated with selective bottom-up checks, such as sampled price ranges for common test panels, inspection day-rate norms, and a limited roll-up of publicly visible revenue disclosures where they exist. Gaps are filled using service-mix proxies agreed during interviews. For forecasting, we use scenario analysis supported by a light multivariate regression lens, where variables like industrial production trend, trade volume direction, safety and standards updates, and capex cycles shape the base case, and then experts validate whether the implied volume and pricing movement feels realistic.
Data Validation & Update Cycle
Validation is done in layers so one weak input does not drive the result. We compare outputs against independent signals like industrial output direction, trade exposure of tested categories, and visible compliance enforcement activity, and then investigate outliers at country and end-use level before sign-off.
A second analyst review is used to spot arithmetic breaks, unusual share shifts, and currency timing mismatches, and we re-contact sources when a variance looks material. Reports refresh annually, and interim updates are made when large regulatory changes, macro shocks, or major end-market swings can change demand meaningfully, followed by a final pre-delivery check to ensure the latest data is reflected.
Mordor Intelligence's Asia Pacific Testing Inspection Certification Market Size Measured Against Other Published Estimates
Published TIC market numbers for Asia-Pacific often vary because each publisher draws the service boundary differently, and also uses different assumptions for in-house work, outsourcing penetration, and price progression. Differences also come from how broadly end-user industries are covered across countries, and whether figures are kept current when standards and compliance needs change.
The main gap comes from whether in-house lab and inspection activity is monetized as market revenue or kept outside the market. In Mordor Intelligence's approach, in-house services are counted only when they are priced as a TIC activity (not as general internal quality overhead), which can move totals versus estimates that treat all internal QC as spend.
Benchmark comparison
| Source | Market Size | Gaps in Research Methodology |
|---|---|---|
| Mordor Intelligence | USD 124.85 B (2025) | |
| Trade Journal A | USD 58.30 B (2024) | Uses a global regional split where Asia-Pacific is derived as a share, and the year and conversion timing differ, which can compress the APAC number versus a country-up demand build with service-mix checks. |
| Regional Consultancy B | USD 16.97 B (2024) | Likely narrows the scope toward outsourced or selected service lines and does not fully represent broader industrial and infrastructure-related inspection and certification, leading to a smaller total for APAC. |
The spread is largely explained by what gets counted as TIC revenue and how the APAC number is constructed, whether it is built from country and end-use drivers or backed out from a global total. When scope is kept consistent and assumptions are checked against activity indicators and interview feedback, the market size becomes easier to trace and to update year to year.
Key Questions Answered in the Report
How large is the Asia-Pacific TIC market in 2026?
Asia-Pacific TIC market size is valued at USD 131.13 billion in 2026.
What is the projected CAGR through 2031?
The market is forecast to grow at a 5.03% CAGR between 2026 and 2031.
Which country is the fastest-growing TIC customer?
India shows the quickest pace, expanding at a 6.22% CAGR through 2031.
Which service category is growing the fastest?
Certification services lead growth, tracking a 5.62% CAGR during the forecast period.
What trend is accelerating remote inspections?
Post-pandemic digital-audit adoption and newer cyber-secure video platforms are lifting remote inspections at a 5.86% CAGR.
Which vertical presents the greatest upside beyond 2026?
Food, agriculture, and beverage sees the strongest outlook at a 6.05% CAGR as regulators tighten safety and traceability rules.