
Market Overview
| Study Period | 2020 - 2031 |
|---|---|
| Forecast Data Period | 2026 - 2031 |
| Base Year Market Size (2025) | USD 4.73 Billion |
| Market Size (2026) | USD 5.29 Billion |
| Market Size (2031) | USD 8.46 Billion |
| Growth Rate (2026 - 2031) | 9.85% CAGR |
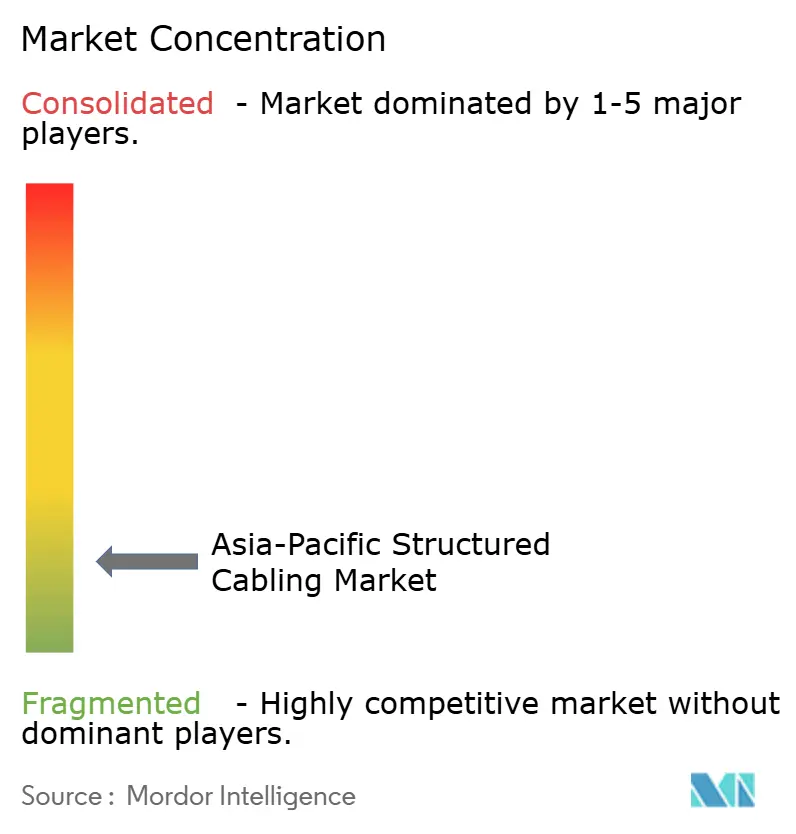
| Market Concentration | Low |
Major Players *Disclaimer: Major Players sorted in no particular order Image © Mordor Intelligence. Reuse requires attribution under CC BY 4.0. | |
Asia-Pacific Structured Cabling Market Analysis by Mordor Intelligence
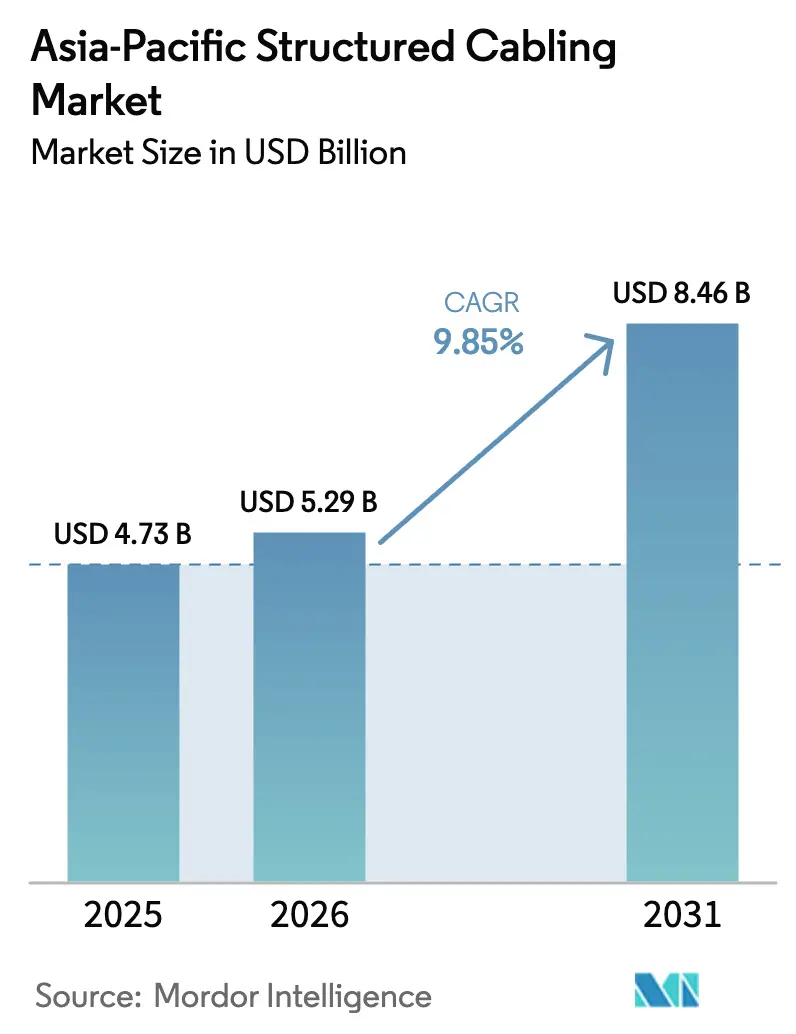
The Asia-Pacific Structured Cabling Market size is expected to grow from USD 4.73 billion in 2025 to USD 5.29 billion in 2026 and is forecast to reach USD 8.46 billion by 2031 at 9.85% CAGR over 2026-2031. This growth reflects surging hyperscale construction, sovereign AI compute clusters, and large-scale fiber-to-the-home rollouts that together amplify demand for high-density copper and optical connectivity. Hardware still drives the bulk of revenue, yet services are expanding faster as enterprises retrofit legacy local-area networks to support multi-gigabit PoE switches and Wi-Fi 6E access points. Fiber optic solutions dominate new builds because single-mode trunks and 400G-plus optics reduce latency inside AI clusters, while Cat 6 copper is winning horizontal runs where 10GBASE-T headroom is vital. Competitive pressure remains intense as global manufacturers battle regional specialists that promise shorter lead times and local-content compliance, although raw-material volatility and stricter standards compliance add cost friction across the value chain.
Key Report Takeaways
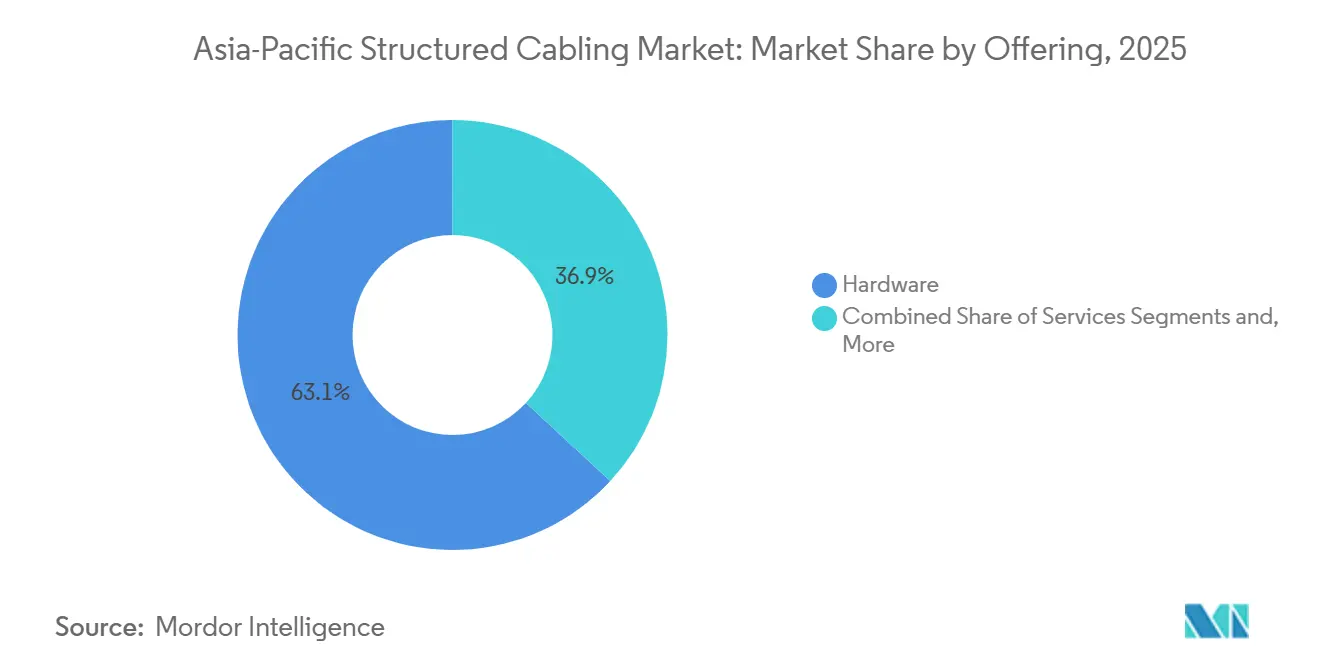
- By offering, hardware led with 63.12% revenue share in 2025 while services are advancing at a 10.22% CAGR through 2031.
- By cable type, fiber optic solutions captured 56.41% of 2025 revenue and are forecast to expand at a 10.97% CAGR to 2031.
- By cable category standard, Cat 5e retained 51.8% share in 2025 whereas Cat 6 is progressing at a 10.56% CAGR through 2031.
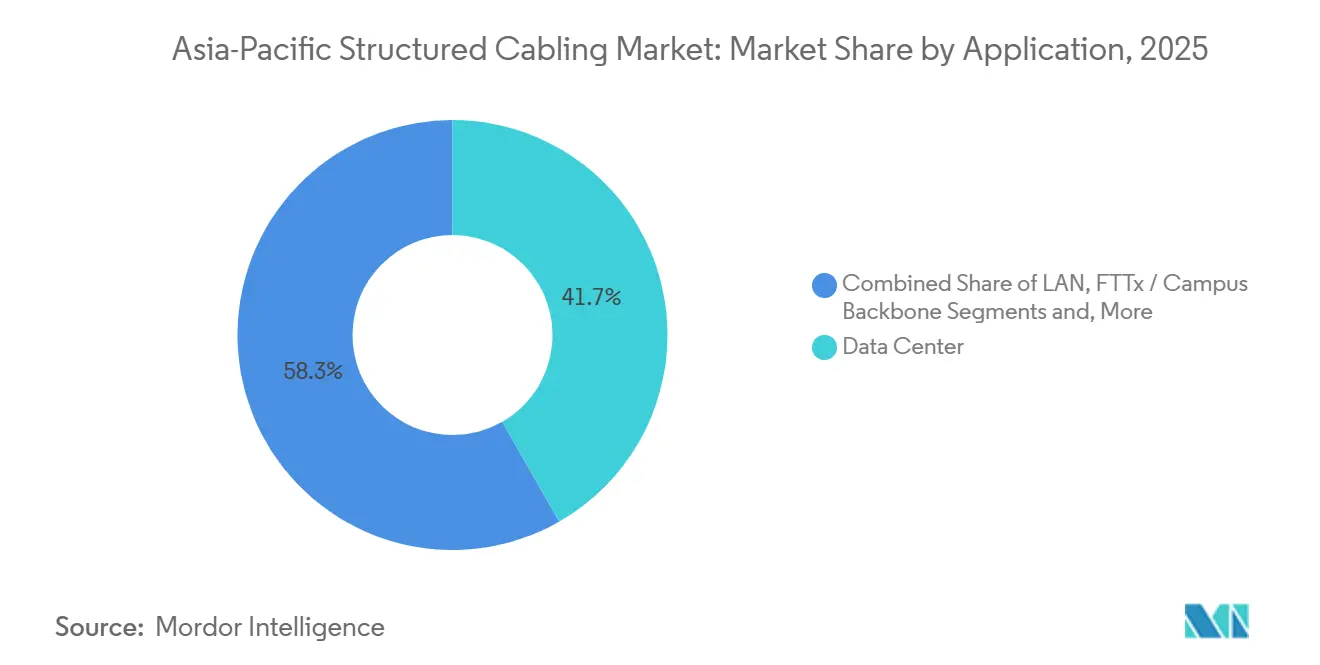
- By application, data centers held 41.73% of 2025 revenue; FTTx and campus backbones are growing at a 10.32% CAGR to 2031.
- By end-user industry, cloud and colocation operators commanded 35.21% spending in 2025 and post the fastest 11.22% CAGR through 2031.
- By geography, China accounted for 29.67% of 2025 value while India is set to outpace all markets with a 10.74% CAGR to 2031.
Note: Market size and forecast figures in this report are generated using Mordor Intelligence’s proprietary estimation framework, updated with the latest available data and insights as of January 2026.
Asia-Pacific Structured Cabling Market Trends and Insights
Drivers Impact Analysis*
| Driver | (~) % Impact on CAGR Forecast | Geographic Relevance | Impact Timeline |
|---|---|---|---|
| Accelerating hyperscale and edge data-center build-outs | +2.8% | China, India, Singapore, Australia, Japan, South Korea | Medium term (2-4 years) |
| Surge in PoE and remote powering requirements | +1.6% | India, ASEAN, Australia, China | Short term (≤ 2 years) |
| Increasing retrofits for smart buildings and campuses | +1.4% | China, Japan, South Korea, Singapore, Australia | Medium term (2-4 years) |
| Government fiber-to-the-home initiatives | +2.2% | India, Indonesia, Thailand, Vietnam, Philippines | Long term (≥ 4 years) |
| Low-latency demand for AI and ML cluster interconnects | +1.9% | China, India, Japan, South Korea, Singapore | Short term (≤ 2 years) |
| Convergence of OT and IT cabling in Industry 4.0 factories | +1.5% | China, Japan, South Korea, India, Thailand | Medium term (2-4 years) |
| Source: Mordor Intelligence | |||
Accelerating Hyperscale And Edge Data-Center Build-Outs
Investments from hyperscale providers exceed USD 50 billion across Southeast Asia, India, and Australia, with AWS, Google, Microsoft, Alibaba Cloud, and Oracle each commissioning multigigawatt campuses that rely on 144- or 288-fiber MPO trunks and Cat 6 top-of-rack links. Rising construction in secondary cities such as Hyderabad, Chengdu, and Ho Chi Minh City shortens latency for streaming and gaming applications and enlarges the addressable footprint for vendors. Edge facilities under 5 MW use pre-terminated solutions to cut installation time by up to 40%, leading integrators to favor factory-assembled cassettes over field terminations. Because labor costs in Singapore and Sydney rose 3.8% in 2025, contractors actively seek designs that trim onsite hours without sacrificing performance.[1]Cushman and Wakefield, “Asia Pacific Data Center Construction Cost Report,” cushmanwakefield.com Component suppliers that bundle cabling, racks, and cable management gain share by mitigating project risk for hyperscale tenants that demand reliable completion schedules.
Government Fiber-To-The-Home Initiatives
India’s BharatNet installed 692,676 km of optical fiber and connected 214,323 gram panchayats by December 2025 under a INR 220 billion (USD 2.6 billion) allocation. Thailand, Indonesia, and Vietnam follow similar blueprints that pair universal service funds with domestic-content rules, steering contracts toward local manufacturers that meet delivery windows in cyclone-prone regions. These mandates elevate single-mode fiber demand, spur fusion splicer sales, and push rural operators to adopt hardened closures that withstand monsoon flooding. Because sovereign broadband plans stretch to 2030 and beyond, structured cabling vendors lock in decade-long revenue visibility and hedge against cyclical data-center spending. The initiatives also foster public-private partnerships that bundle dark-fiber leases with smart-city use cases, accelerating campus backbone upgrades in provincial towns.
Surge In PoE And Remote Powering Requirements
Ratification of IEEE 802.3bt enables 90-watt PoE, catalyzing adoption of LED lighting, Wi-Fi 6E access points, and PTZ cameras that each draw 25-30 watts.[2]IEEE Standards Association, “IEEE 802.3bt Power over Ethernet Standard,” ieee.org Enterprises in Singapore, Tokyo, and Bengaluru are ripping out Cat 5e and installing Cat 6 to cap voltage drop across 100 m horizontal runs, thereby consolidating power and data over a single cable. Smart-building retrofits now bundle PoE lighting with environmental sensors to realize 40% energy savings, pushing integrators to preconfigure switch stacks for converged management planes. IDC surveys show 80% of Asia-Pacific IT leaders see 6 GHz Wi-Fi as transformational for wired infrastructure, nudging refresh cycles forward by two years. These upgrades, while modest in material volume, create lucrative service engagements because contractors must validate thermals, grounding, and load balancing across newly electrified cable bundles.
Low-Latency Demand For AI And ML Cluster Interconnects
NVIDIA’s GB200 NVL72 rack draws 132 kW and depends on 400G InfiniBand or Ethernet to complete training jobs within acceptable SLAs.[3]NVIDIA Corporation, “GB200 NVL72 AI Infrastructure Specifications,” nvidia.com SoftBank, Oracle, and KT Corporation collectively earmarked more than USD 18 billion for AI facilities that will enter service between 2026 and 2028, each requiring hundreds of 288-fiber MPO cassettes per hall. Pre-terminated single-mode trunks slash installation errors and enable spine-leaf topologies that achieve sub-microsecond latency, a must for LLM training. Liquid-cooled racks force designers to reroute cable trays above coolant loops, and vendors that offer integrated pathways gain a premium. Because AI nodes cluster in seismic zones such as Japan and Taiwan, consultants now specify seismic-rated ladder racks and flexible fiber raceways to comply with local building codes.
Restraints Impact Analysis*
| Restraint | (~) % Impact on CAGR Forecast | Geographic Relevance | Impact Timeline |
|---|---|---|---|
| Rising adoption of enterprise WLAN and 5G FWA solutions | -1.2% | India, ASEAN, Australia, China | Short term (≤ 2 years) |
| Complex standards compliance and testing costs | -0.9% | Asia-Pacific (all markets) | Medium term (2-4 years) |
| Supply-chain volatility in copper and optical fiber | -1.1% | China, India, ASEAN, Australia | Short term (≤ 2 years) |
| Deferral of on-premises data-center builds amid cloud migration | -1.0% | Asia-Pacific developed and emerging markets | Short term (≤ 2 years) |
| Source: Mordor Intelligence | |||
Rising Adoption Of Enterprise WLAN And 5G FWA Solutions
Wi-Fi Alliance has certified more than 2,500 Wi-Fi 6E devices, and field trials show average throughputs above 1.7 Gbps, prompting many office planners to adopt a wireless-first strategy that trims the need for new horizontal cable drops. Telcos in India, Indonesia, and the Philippines now market 100-300 Mbps 5G fixed wireless packages, with Reliance Jio alone activating 115,000 FWA terminals during 2025, thereby bypassing last-mile copper or fiber in cost-sensitive locations. Cisco benchmarks indicate that Wi-Fi 6E access points draw roughly 28 watts, requiring 90-watt PoE switch ports but still fewer cable runs per floor, which compresses demand for Cat 6 in small and midsize offices. Systems integrators report that renovation projects now devote only 25% of cabling budgets to copper endpoints compared with 45% in 2022, redirecting spend toward aggregation links and network services. While data-center and hyperscale environments remain insulated because high-density racks depend on fiber trunks, reduced office installations constitute a meaningful headwind for structured-cabling vendors in Australia, Thailand, and urban India.
Supply-Chain Volatility In Copper And Optical Fiber
Copper spot prices on the London Metal Exchange peaked near USD 10,719 per tonne in October 2025, while a projected 900,000-tonne shortfall in 2026 has prompted buyers to secure long-term contracts or shift to aluminum-clad copper for non-critical runs. Fiber manufacturers face less raw-material risk, yet draw-tower capacity constraints surfaced during 2024 when hyperscalers synchronized expansion schedules. Vendors with vertically integrated smelters or in-house draw towers weather these shocks better, but installers still grapple with 8-12-week lead times on niche SKUs, stretching project timelines and pressuring margins. Contractors pass cost increases through to clients, yet hyperscale tenants cap allowable price escalation, intensifying competition and eroding profitability.
*Our forecasts treat driver/restraint impacts as directional, not additive. The impact forecasts reflect baseline growth, mix effects, and variable interactions.
Segment Analysis
By Offering: Services Outpace Hardware On Retrofit Complexity
The Asia-Pacific structured cabling market size for hardware reached USD 3.34 billion in 2025, equal to 63.12% of total spend, thanks to copper pairs, fiber trunks, modular panels, and cable management systems that dominate greenfield budgets. Design and installation services, however, are growing at a 10.22% CAGR because enterprises must upgrade legacy cabling to support 90-watt PoE, 10GBASE-T throughput, and Wi-Fi 6E backhaul. This service boom benefits contractors certified under BICSI Installer 2, whose credentials shorten procurement cycles for hyperscale tenants. Vendors bundle as-built documentation and thermal simulation into maintenance contracts that now stretch seven years, reflecting higher rack densities and the scarcity of skilled technicians in Indonesia and India.
Software remains a sliver of revenue but is ascending as hyperscalers automate cable inventories to lower mean-time-to-repair by up to 40%. Platforms that ingest test results directly from Fluke or Viavi certifiers produce ISO-compliant handover packs in minutes, trimming administrative labor. Hybrid build-operate agreements are emerging, where integrators assume responsibility for uptime over a five-year horizon, thus embedding recurring revenue during the post-installation phase. The Asia-Pacific structured cabling market creates room for value-added resellers that overlay digital twin capabilities onto cabling blueprints, enabling predictive maintenance on PoE switch ports and fiber-channel utilization.


By Cable Type: Fiber Dominates On AI And Backbone Demand
Fiber captured 56.41% of 2025 value and is expanding at a 10.97% CAGR because spine-leaf architectures inside AI clusters demand 400G-plus optics and single-mode trunks that sustain link budgets beyond 300 meters. OM4 and OM5 multimode still serve short-reach links inside server rows, yet hyperscalers increasingly leapfrog to single-mode to standardize spares. Copper retains relevance in horizontal runs and industrial plants where Cat 6 shielded cable tolerates electromagnetic interference. Rising copper prices and mining concentration in Chile, Peru, and the Democratic Republic of the Congo amplify price swings, making aluminum-clad copper attractive for budget-constrained LANs.
Connector technology evolves in tandem: LC duplex still dominates data-center patching, but 16-fiber MPO and emerging SN interfaces shrink port counts on 800G switches, driving density gains. Pre-terminated assemblies reduce installer labor by 25-35%, a key selling point amid chronic talent shortages in Southeast Asia. Because fiber boasts lower raw-material volatility than copper, telcos with long planning horizons prefer single-mode to hedge cost risk, reinforcing the Asia-Pacific structured cabling market share advantage for optical connectivity.
By Cable Category Standard: Cat 6 Persists in Legacy Builds While Cat 5e Retains Lead
Cat 5e lingers mainly in cost-sensitive retrofits, accounting for 51.8% of 2025 revenue. Low-rise residential buildings and temporary facilities such as construction site offices. Contractors continue to stock Cat 5e because its smaller diameter simplifies pulls through congested conduits, and its material cost can be 18-22% lower per meter than Cat 6. However, rising demand for 30-watt PoE endpoints exposes Cat 5e’s higher DC resistance, prompting facility managers to schedule gradual upgrades when budgets allow. Some provincial administrations in Indonesia and Vietnam still approve Cat 5e for subsidized broadband hubs, creating isolated pockets of volume that keep the category alive. Even in these scenarios, tender documents increasingly bundle fiber backbones, signaling that Cat 5e’s role will narrow to short horizontal drops as the Asia-Pacific structured cabling market size shifts decisively toward higher-grade copper.
Cat 6 is underscoring its position as the mainstream choice for new horizontal runs across offices, campuses, and small data rooms.[4]Telecommunications Industry Association, “ANSI/TIA-568.0-E Standard Update,” tiaonline.org Enterprises value its proven support for 1 Gbps throughput over 100 m channels, lower insertion loss than Cat 5e, and straightforward termination that keeps labor costs predictable. Regional building codes in Singapore, Hong Kong, and Sydney now specify Cat 6 or higher for new construction, effectively locking the category into most greenfield projects. As Wi-Fi 6 access points saturate floors, owners deploy Cat 6 to maintain Gigabit uplinks without overpaying for higher-category jackets, helping the Asia-Pacific structured cabling market share for Cat 6 stay dominant through 2028. Integrators also favor Cat 6 for industrial control rooms where shielded variants mitigate electromagnetic interference, extending adoption beyond commercial real estate.
By Application: FTTx And Campus Backbone Surge On Government Mandates
Data centers generated 41.73% of 2025 revenue, reflecting the fiber-heavy architectures required for AI accelerators, but FTTx and campus backbones are climbing at a 10.32% CAGR under national broadband missions. BharatNet alone aims to connect 270,000 villages by 2030, guaranteeing multi-year demand for single-mode fiber, hardened splice closures, and pole hardware. Smart-city pilots in China’s tier-3 municipalities deploy fiber rings that link traffic cameras, environmental monitors, and 5G macro sites, further expanding addressable volumes.
LAN spend remains roughly flat as wireless substitution tempers new outlet counts; however, each Wi-Fi 6E access point uplink now requires 10GBASE-T and 90-watt PoE, doubling per-port cabling cost relative to Cat 5e installations pre-2020. Industrial automation networks in China, Japan, and South Korea specify shielded Cat 6 or fiber with ruggedized jackets to combat oil, vibration, and electromagnetic noise, commanding 10-15% price premiums. As factories chase Industry 4.0 digitization, the Asia-Pacific structured cabling market gains a stable secondary demand stream that is less correlated with hyperscale capital cycles.
By End-User Industry: Enterprise Offices Split Between Cat 5e Cost Control and Cat 6 Performance
Cloud and colocation operators spend predominantly on fiber inside white space but still specify Cat 6 for administrative floors and BMS consoles because it balances Gigabit headroom with manageable bend radius. Financial institutions retrofit branches to Cat 6 as they roll out high-resolution conferencing booths and digital-signage walls that exceed Cat 5e’s 100 MHz envelope. Retail chains remain loyal to Cat 5e at new storefronts across Indonesia and the Philippines, finding it adequate for inventory scanners and payment terminals while freeing budget for Wi-Fi mesh systems.
Healthcare campuses in Japan and Australia standardize on Cat 6 for nurse-call stations and real-time location-tracking tags, citing lower latency and straightforward migration paths to 2.5 Gbps. Manufacturers show a similar split; automotive plants in China select shielded Cat 6 to mitigate welding-arc interference, whereas textile mills in Vietnam employ Cat 5e for non-critical monitoring lines. Education networks reveal the starkest duality: urban universities migrate to all-fiber backbones with Cat 6 classrooms to support VR labs, while rural schools funded by provincial grants still pull Cat 5e to keep per-seat costs down. As a result, demand skews toward Cat 6 in high-density, high-power use cases, yet Cat 5e persists wherever cost and ease of installation outrank performance headroom.
Geography Analysis
China held 29.67% of the Asia-Pacific structured cabling market in 2025, anchored by Alibaba Cloud’s USD 52.4 billion multiyear infrastructure plan and continuous fiber build-outs in tier-3 cities. Domestic cable makers benefit from proximity to the world’s largest refined copper supply and frequently undercut imported products, although export controls on critical minerals encourage hyperscalers to dual-source components. Made in China 2025 accelerates industrial automation spending, driving ruggedized cabling demand inside automotive and electronics plants across Guangdong, Jiangsu, and Zhejiang provinces.
India is poised for the fastest 10.74% CAGR through 2031, fueled by BharatNet’s village-level fiber, USD 6 billion from Google Cloud, USD 30 billion from Reliance, and USD 1 billion from TCS HyperVault. Scarcity of powered sites in Mumbai and Hyderabad lifts land conversion costs and favors brownfield conversions that require complex retrofit cabling. Metro fiber rings upgrade to 200G coherent optics for 5G backhaul, while BFSI and government offices standardize on Cat 6 to power IoT-enabled service counters and electronic-identification kiosks.
Japan, South Korea, and Australia form a mature triad where AI-specific facilities dominate incremental growth. SoftBank’s USD 9 billion AI center in Mihara, Oracle’s USD 8 billion Tokyo program, and KT Corporation’s USD 1.02 billion Gimcheon site drive demand for 400G optics and seismic-rated cable management. Singapore, Indonesia, Thailand, Malaysia, and Vietnam continue to attract hyperscale capital, yet land scarcity in Singapore caps capacity and shifts investments toward Batam, Johor, and Bangkok suburbs. Australia’s National Broadband Network upgrade to fiber for 10 million premises by end-2025 couples with hybrid work adoption, sustaining enterprise LAN refreshes to Cat 6 and fiber spines. Collectively, these dynamics preserve a diverse opportunity landscape across developed and emerging economies, reinforcing the strategic importance of supply-chain localization for participants in the Asia-Pacific structured cabling market.
Regulatory Landscape
Structured cabling demand in Asia-Pacific is shaped by safety, performance, and installer-competency requirements that increasingly point to formal technical standards for both components and installation practices. In Australia, ACMA-backed rules have been refreshed through the Telecommunications (Requirements for Customer Cabling Products - AS/CA S008) Technical Standard 2025, along with the Telecommunications (Cabling Provider) Rules 2025 that govern who can install and certify customer cabling, tightening compliance expectations for contractors serving enterprise LAN, campus, and data-center fit-outs.
Across major markets, national standards bodies and ministries drive divergence in what vendors must design for and test to, rather than a single regional baseline. China applies MIIT-linked GB standards for cabling performance, while India uses BIS-aligned requirements that emphasize fire safety ratings for indoor installations. Standards development and updates through bodies such as Standards Australia (CT-001 Communications Cabling Committee), and industry frameworks tied to Communications Alliance, further reinforce the need for documented testing, traceability, and compliant materials, which increases the value of certified installers and vendor support for audit-ready handover packs.
Competitive Landscape
The Asia-Pacific structured cabling market remains moderately fragmented; the top five suppliers together control roughly 45% share, leaving ample space for regional challengers. Prysmian, Nexans, Corning, Furukawa, and Sumitomo dominate premium data-center and FTTH segments by leveraging global manufacturing footprints and extensive standards compliance. LS Cable and System, Hengtong, and Sterlite rise quickly in government projects where local-content requirements or aggressive pricing decide tenders. Hyperscale tenants are consolidating vendor rosters to minimize SKU counts and enforce uniform quality metrics, yet smaller colocation operators diversify suppliers to hedge lead-time risk caused by copper price volatility.
Product innovation centers on pre-terminated fiber assemblies, high-density 16-fiber MPO cassettes, and Cat 6 shielded patch-cord ranges that withstand 90-watt PoE temperatures. Panduit, Legrand, and Belden embed automated documentation software that ingests certification results and populates digital twins, giving facility managers real-time visibility of physical layer assets. Manufacturers with in-house compound extrusion smoothly adopted the stricter flame-retardancy criteria outlined in UL plenum tests, whereas smaller firms struggle with higher scrap rates. Standards revisions, notably ANSI/TIA-568.0-E and ISO/IEC 11801, lift pass-fail thresholds, effectively raising the bar for newcomers and consolidating share within incumbents that fund continuous R&D.
Regional specialists exploit faster service response times and tailored SKUs, such as typhoon-rated aerial fiber for the Philippines or termite-resistant cables for Northern Australia, extracting 10-30% price premiums. However, chronic shortages of BICSI-certified technicians limit deployment velocity in high-growth territories like Vietnam and Malaysia, giving integrated cabling and services providers an edge. Currency swings and freight bottlenecks favor suppliers with distributed warehousing, a compelling proposition as hyperscalers demand just-in-time delivery to meet tight commissioning schedules. Overall, technology differentiation, standards agility, and service depth will decide long-term winners in the Asia-Pacific structured cabling market.
Asia-Pacific Structured Cabling Industry Leaders
Belden Inc.
CommScope Holding Company Inc.
Corning Incorporated
Prysmian Group SpA
Nexans SA
- *Disclaimer: Major Players sorted in no particular order

Market Opportunities and Future Outlook
Data-center density and AI-driven interconnect requirements create whitespace for high-fiber-count, high-density connectivity, and for faster-to-deploy architectures across Asia-Pacific where commissioning schedules are constrained by labor availability and tighter compliance. The report scope already reflects this pull, with data centers representing 41.73% of 2025 revenue, supporting opportunities in pre-terminated single-mode trunks, 16-fiber MPO (and emerging high-density interfaces), and integrated pathway and cable-management solutions that reduce onsite work and rework in liquid-cooled rack layouts.
Supply-chain localization and compliance-ready product portfolios are also tangible avenues for vendors and integrators as Australia tightens cabling product and installer rules under the 2025 updates to AS/CA S008 and related cabling provider requirements. Recent company actions reinforce this direction, including Corning’s plans to scale high-precision fiber optic connector harness production in Shanghai (Jiading), and Belden expanding manufacturing capability in India (Pune), both aimed at shorter lead times for hyperscale and enterprise builds. Government broadband programs such as India’s BharatNet (692,676 km of optical fiber completed by December 2025) sustain demand for hardened closures, drop cables, and field-installation services, which in turn supports testing, documentation, and maintenance contracts tied to long-lived public network assets.
Recent Industry Developments
- June 2026: Belden Inc. launches PPC DiamonDrop single-fiber drop cable for last-mile and broadband applications. The launch expands APAC last-mile capacity for FTTH and FTTE deployments and strengthens multi-vendor data-center connectivity in the region.
- June 2026: Belden Inc. launches ruggedized IT/OT infrastructure innovations Hirschmann GREYHOUND GRS2000 switches and IT DAP849 APs. The capacity addition strengthens APAC footprint in harsh environments and broadens IT/OT portfolio to capture growing hyperscale and industrial edge opportunities.
- June 2026: Corning Incorporated signs to launch a new Shanghai Jiading project to scale up production of high-precision fiber optic connector harnesses for data centers. The localization of production reduces lead times and supports AI and data-center scale in China.


Research Methodology Framework and Report Scope
Market Definition and Coverage
For this study, we define the Asia-Pacific structured cabling market as the revenues earned from standardized copper and fiber cabling infrastructure and related connectivity used to build and operate enterprise LANs and data center physical networks across the region.
Scope exclusions: it excludes active network equipment (such as switches and routers), end-user devices, and general electrical wiring that is not used for structured data communication.
Segmentation Overview
- By Offering
- Hardware
- Cabling (Copper, Fiber)
- Connectivity (Connectors, Patch-Panels, Jacks, Cords)
- Racks, Cabinets and Cable Management
- Services
- Design and Consulting
- Installation and Integration
- Maintenance and Support
- Software
- Hardware
- By Cable Type
- Copper
- Copper Cable
- Copper Connectivity
- Fiber
- Single-Mode Cable
- Multi-Mode Cable
- Fiber Connectivity
- Copper
- By Cable Category Standard
- Cat 5e
- Cat 6
- By Application
- LAN
- Data Center
- FTTx / Campus Backbone
- Industrial Automation Networks
- By End-User Industry
- IT and Telecom Service Providers
- Cloud and Colocation Data Centers
- BFSI and Enterprise Offices
- Healthcare Facilities
- Government and Defense
- Manufacturing and Industrial
- Education
- By Geography
- Asia-Pacific
- China
- India
- Japan
- South Korea
- ASEAN
- Australia
- New Zealand
- Rest of Asia-Pacific
- Asia-Pacific
Data Sources, Market Sizing, and Validation
Desk Research
Desk research was used to anchor market context and set realistic bounds for demand across Asia-Pacific. We reviewed public sources such as ITU connectivity indicators, national telecom regulator releases, World Bank and IMF macro series, and UN Comtrade trade statistics for relevant cable and connector movements. Where available, standards and guidance from bodies such as ISO/IEC and TIA were checked to keep cabling categories and compliance language consistent across countries.
For supply and pricing signals, we referred to company annual reports, investor presentations, and reputable press coverage on data center buildouts, fiber rollouts, and construction spending. We also used paid subscriptions for company financials and intelligence, patent databases, and import and export shipment-level checks to validate directional shifts in product mix (copper versus fiber) and sanity check average pricing. The desk sources mentioned here are illustrative only, and we also used other public documents and databases to support data collection, validation, and clarification.
Primary Interviews and Surveys
Primary work was used to turn the desk inputs into a usable sizing model for Asia-Pacific, where pricing, project mix, and how newer cabling categories are accepted can vary country to country. We spoke with manufacturers, distributors, installers, data center contractors, and enterprise IT and facilities stakeholders, then used follow-up questions to close gaps on typical bill-of-material splits, replacement cycles, and channel margins across major sub-regions.
Distribution of primary research fieldwork respondents
| Company type | Respondent position | Region |
|---|---|---|
| Top tier: 39% | CXOs: 14% | |
| Mid tier: 47% | Functional/Unit leaders: 26% | |
| Smaller Players: 14% | Managers: 60% |
Market-Sizing & Forecasting
For sizing, we start with a top-down build where regional demand is reconstructed using a demand-pool view of cabling needs tied to new builds and upgrades in data centers and commercial and industrial facilities, then scaled using country-level adoption and refresh rates. To keep totals grounded, we also run selective bottom-up approximations, including sampled project bill-of-material checks, channel feedback on volumes, and average selling price (ASP) cross-checks for common cable categories.
Key inputs in the model include data center capacity additions and build pipelines, enterprise network refresh cycles, the mix shift between copper and fiber, average link density per rack or floor area, and copper and fiber raw material price direction that impacts ASPs. When country-level detail was incomplete, we used proxy indicators such as construction activity, broadband rollout intensity, and import patterns, followed by interview-based adjustments so gap handling stayed consistent.
Forecasting relied mainly on scenario analysis, where base, conservative, and accelerated cases were shaped around data center build schedules, fiber rollouts, and macro conditions, then aligned to consensus ranges shared by industry participants. We chose the final forecast path after checking that implied volumes and pricing trends remained realistic for each major market in the region.
Data Validation & Update Cycle
We validate outputs through several checks so that one unusual assumption does not drive the full result. Model totals are compared against independent signals such as trade movements, reported expansion plans, and implied spend per project type, then the largest variances are reviewed again with additional calls when needed.
Before sign-off, the numbers go through a multi-step analyst review where inputs, formulas, and unit conversions are rechecked, followed by a final consistency scan across countries and end uses. Reports are refreshed annually, and interim updates are triggered when material events occur, such as major project delays, sharp input cost changes, or large policy shifts. Right before delivery, we run a last pass so clients receive the most current view available.
Mordor Intelligence's Asia Pacific Structured Cabling Market Estimate Compared With Other Published Estimates
Published market sizes for structured cabling in Asia-Pacific can look different because boundaries are not always identical and the underlying demand signals are not measured the same way. These variations usually come from what is counted as structured cabling revenue, which geographies are fully covered, and how pricing and mix shifts are treated when projecting forward.
By tracking data center capacity additions, copper versus fiber mix, and channel-level ASP movements, Mordor Intelligence keeps the estimate tied to a repeatable demand pool for Asia-Pacific, instead of blending in adjacent electrical wiring or active network equipment spend. Some other estimates also rely on a single base case and older exchange-rate timing, which can widen the gap when material costs move and when project cycles shift across the region.
Benchmark comparison
| Source | Market Size | Gaps in Research Methodology |
|---|---|---|
| Mordor Intelligence | USD 4.73 B (2025) | |
| Regional Consultancy A | USD 4.18 B (2026) | Uses a later base year but appears to apply narrower inclusion around enterprise LAN retrofits, which can undercount replacement demand and service revenue tied to modernization projects. |
| Trade Journal B | USD 7.60 B (2024) | Reports a worldwide total for structured cable and connectivity, so the scope is not Asia-Pacific only and the category boundary can differ depending on how connectivity and data center spend are grouped. |
The spread in the table is mainly explained by scope and measurement choices, not by a single forecasting assumption. When the market boundary is kept specific to structured cabling in Asia-Pacific and inputs are checked against project activity and realistic ASP paths, the result is easier to trace, update, and reuse for planning discussions.


Key Questions Answered in the Report
How fast is the Asia-Pacific structured cabling market growing through 2031?
It is expected to rise from USD 5.29 billion in 2026 to USD 8.46 billion by 2031, reflecting a 9.85% CAGR.
Which segment adds revenue fastest within the Asia-Pacific structured cabling market?
Services exhibit the highest growth, expanding at a 10.22% CAGR because enterprises retrofit networks for 90-watt PoE and 10GBASE-T.
Why is fiber capturing the largest Asia-Pacific structured cabling market share?
AI data centers and national broadband projects rely on single-mode trunks and 400G optics that demand fiber’s reach and bandwidth.
What drives Cat 6 adoption across new commercial buildings?
Tenants require 10 Gbps throughput and 90-watt PoE support for Wi-Fi 6E access points, LED lighting, and smart-building sensors.
Which geography posts the quickest expansion in structured cabling demand?
India leads with a projected 10.74% CAGR, underpinned by BharatNet village fiber, hyperscale build-outs, and metro backhaul upgrades.
How is the copper supply deficit affecting project budgets?
Spot-price volatility and a forecast 900,000-tonne shortfall for 2026 push contractors to lock long-term contracts or shift to aluminum-clad alternatives.
Page last updated on:






